S&P Global (SPGI) Has Dropped in 10 of 10 Midterm Spring Windows, and the Next One Starts Now
S&P Global is heading into a 39-session midterm-year stretch that has never produced a gain in the last ten cycles, just as the stock trades well below its 52-week high after a sharp guidance-driven sell-off.

Key takeaways
- S&P Global has posted losses in this 39-session midterm-year window in all of the last 10 cycles, with an average decline of 4.23% for the stock.
- The upcoming window runs from Mar 20 through roughly mid-May, grouping only midterm election years to reflect policy and liquidity dynamics unique to that phase of the cycle.
- The pattern is defined as a short setup, with 100% Percent Profitable, 10 winners and 0 losers for traders positioned with the trend.
- Average winner size is 4.23%, while the TradeWave Ratio of 2.54 signals that price has typically moved meaningfully in the trade direction inside the window.
- Intraperiod swings have been uncomfortable: in the weakest year, the stock’s worst drawdown from entry reached about 12%, and even the milder years saw several percentage points of adverse move.
- SPGI is down about 25.8% from its 52-week high and roughly 15% year to date, after a February guidance cut tied to AI disruption fears reset expectations for 2026 earnings.[1][2][3]
According to historical data from TradeWave.ai, this specific midterm-year spring stretch has behaved very differently from an average month for S&P Global, and the next iteration is about to start.
Seasonal window
S&P Global has fallen in each of the last 10 midterm election years during this 39-session window, averaging 4.23% losses for the stock. The next iteration begins on Mar 20, with SPGI last trading at 426.59, about 25.8% below its 52-week high and roughly 15% lower year to date.[1][2]
This pattern is built around the presidential election cycle, using only the last 10 midterm election years rather than a simple run of calendar years. That matters for a company like S&P Global because midterm years often bring a mix of tighter financial conditions, regulatory noise and slower deal activity, all of which can feed directly into ratings, indices and data demand.
The trade direction for this setup is short. In other words, the historical record has favored traders positioned for SPGI to drift lower or sell off during this stretch, not investors betting on a rally. Across the 10 midterm-year samples, Percent Profitable is 100%, with 10 winners and 0 losers for the short side, and the average profit on those winning shorts is 4.23%.
Because every year in the sample was a winner for the short direction, the average profit across all years is the same 4.23%. That is a clean profile: there are no offsetting big squeezes that erase the edge, at least in the historical record.
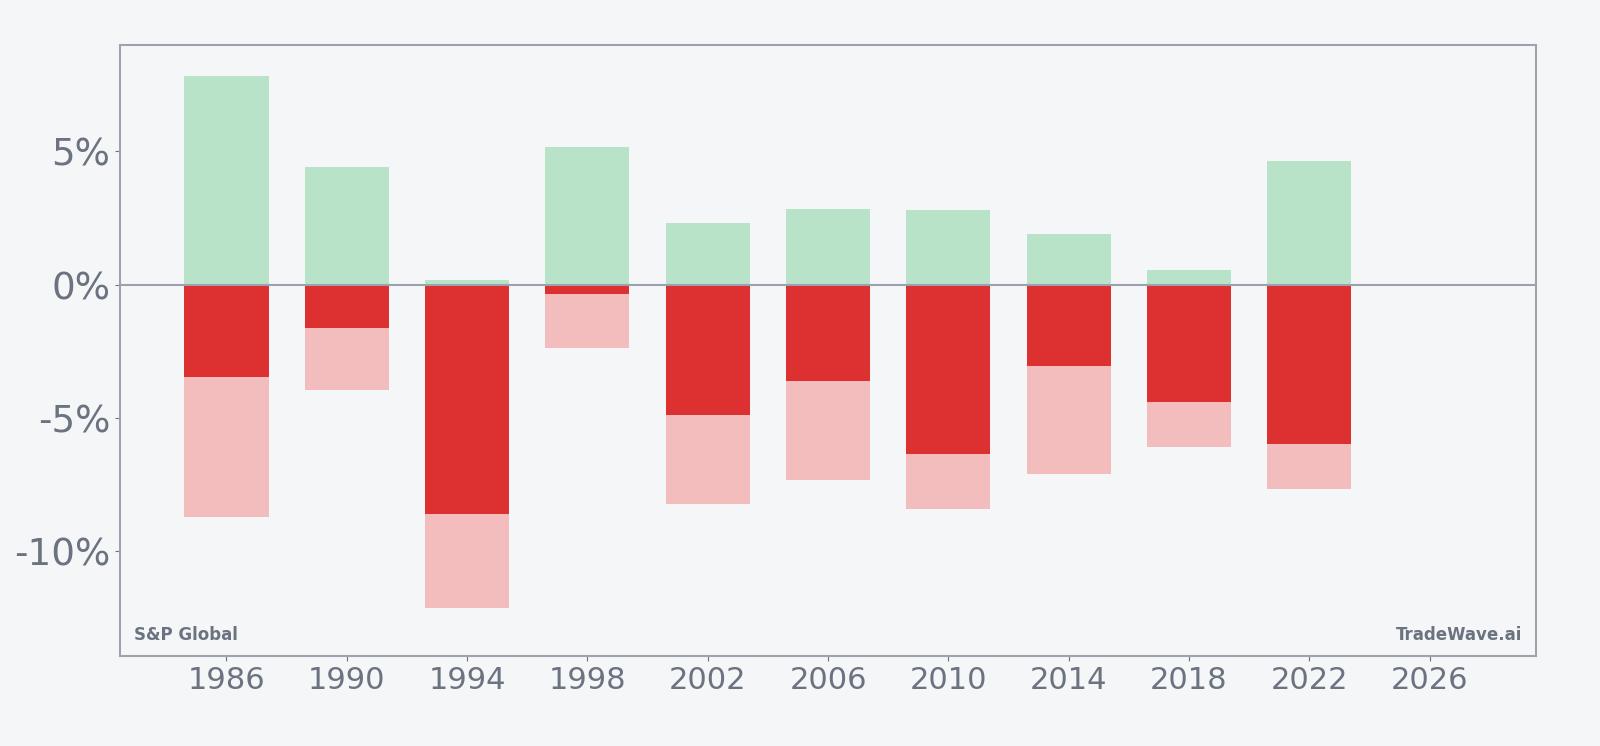
The volatility inside the window has still been real. In 1994, the worst year for the stock in this pattern, SPGI fell 8.61% from entry to exit, with a maximum adverse move of about 12.13% against the short before the trade finished in the money. In 2022, the stock dropped 5.96% over the window, but at one point rallied roughly 4.64% against the short before rolling over again.
Those numbers speak to the MFE/MAE profile. Maximum favorable excursion, or MFE, is the best point-to-peak move in the trade direction during the window, while maximum adverse excursion, or MAE, is the worst drawdown from entry. In this pattern, MFE has often reached mid-single digits for shorts, but MAE has also run into the high single digits in several years, underscoring that even “perfect” historical windows have required sitting through sharp countertrend rallies.
The typical path inside the window has been a grind lower rather than a straight-line drop. The seasonal trend curve shows SPGI often holding up in the first week or two, then seeing selling pressure build into the back half of the window as midterm-year macro and policy headlines accumulate.
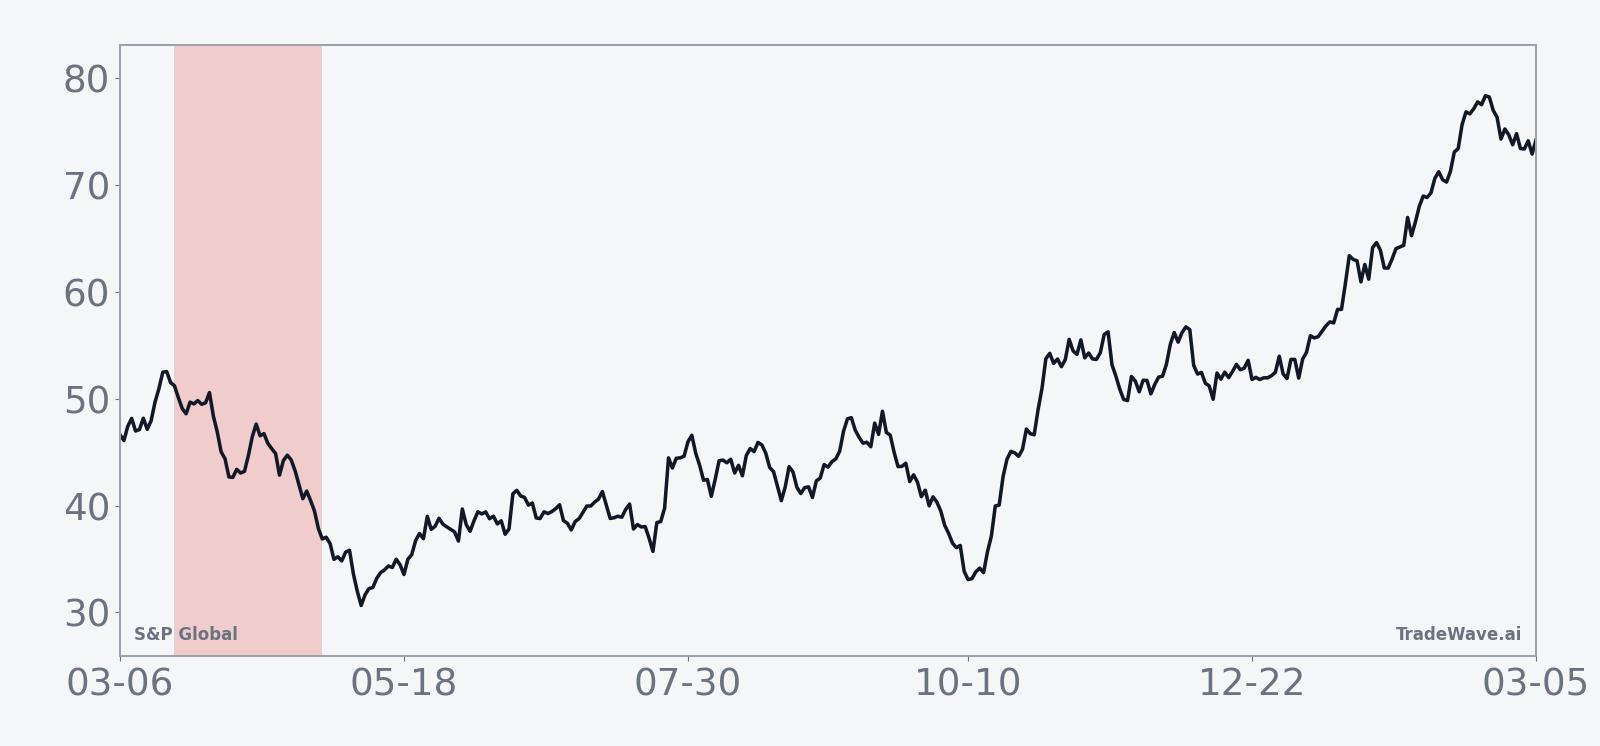
A second view combines yearly net results with the best and worst intraperiod swings to show how far SPGI has tended to travel in both directions.
The TradeWave Ratio of 2.54 reinforces that point. TradeWave Ratio (TWR) is how far price typically travels in the trade direction within the window, independent of the final close. For SPGI in this setup, that means the stock has usually offered meaningful downside travel for shorts before the window ends.
History does not guarantee future results, and the worst adverse moves in prior years show that even “perfect” windows can involve sizable drawdowns before they resolve.
Price and near-term drivers
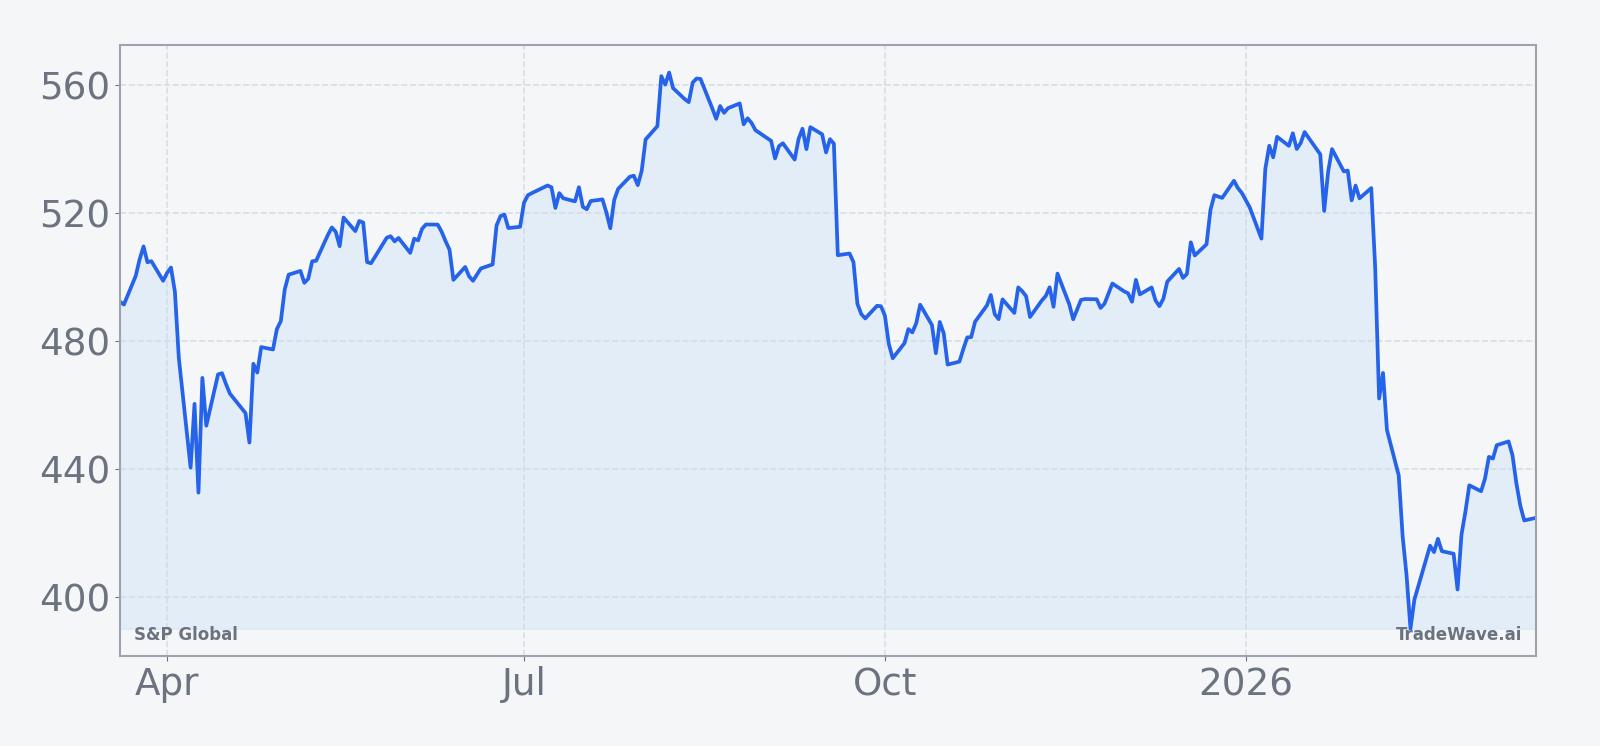
S&P Global closed Monday at 426.59, up 0.97% on the day, but still roughly 15% lower year to date and about 25.8% below its 52-week high of 574.77 as investors digest a sharp reset in 2026 earnings expectations.[1][2][3]
The stock’s slide accelerated on Feb 10, when the company guided 2026 adjusted earnings per share to a range of $19.40 to $19.65, below analyst estimates of $19.94, triggering an 18% premarket drop as investors fretted about AI-driven disruption to its data and ratings franchises.[2][3] That move came less than a year after S&P Global had been raising guidance on the back of strong demand for its data products, highlighting how quickly sentiment has flipped.[4][5]
In Q4 2025, revenue rose 9% to $3.92 billion, with adjusted EPS of $4.30 just shy of the $4.33 consensus, while earlier in 2025 the company had posted a Q2 beat and lifted its full-year outlook on robust subscription growth in Market Intelligence and Ratings.[1][4][5] The latest guidance cut does not erase that demand story, but it has forced investors to rethink how much pricing power and volume growth S&P Global can sustain as AI tools commoditize some analytics even as they increase appetite for high-quality proprietary data.[1][2]
Macro context is doing little to smooth the ride. Concerns about AI disruption sit alongside a broader debate over how higher-for-longer rates and tighter credit conditions will affect issuance, structured products and corporate borrowing, all key revenue drivers for S&P Global’s ratings and index businesses.[1][2] At the same time, the company’s role at the center of benchmarks and risk models means it could also benefit if volatility and regulatory scrutiny push more clients toward premium data and analytics packages.[1]
The chart below situates the latest move in its recent multi-month context.
Election-cycle and policy backdrop
This seasonal window sits in the midterm election year, a phase that often looks very different from the presidential election year or the year before it. Historically, midterm years have featured more policy uncertainty, periodic fiscal brinkmanship and a heavier regulatory tone, all of which can weigh on risk appetite and issuance volumes even when the broader economy is expanding.
For S&P Global, that backdrop can cut both ways. Slower deal flow and choppy credit markets can pressure ratings revenue, but heightened risk awareness and regulatory focus can also push banks, asset managers and corporates to lean harder on the company’s data and analytics platforms.[1][2] The fact that SPGI has still tended to trade lower in this specific midterm-year spring window suggests that, in prior cycles, the drag from softer issuance and risk-off episodes has outweighed any incremental demand boost.
What to watch as the window opens
The 39-session window starting Mar 20 will test whether that 10-for-10 midterm-year pattern still has bite. The first thing to watch is how SPGI behaves if it rallies into the start of the window. In prior cycles, some of the biggest eventual declines began from short-lived bounces that faded as macro and policy headlines accumulated.
Second, levels matter. With the stock already well below its 50-day moving average of 473.99 and trading under the 52-week midpoint, traders will be watching whether any rebound can reclaim that moving average or whether it acts as resistance during the window.[1] A failure to retake that band while the seasonal window is open would be consistent with the historical short bias; a decisive break above it would be an early sign that this cycle may diverge from the script.
Third, the macro and policy calendar will be key. Any shifts in rate expectations, credit spreads or regulatory rhetoric around AI and financial data could quickly feed into SPGI’s earnings narrative.[1][2] If those headlines skew cautious while the stock is in the seasonal window, history suggests the path of least resistance has been lower.
Finally, watch how quickly intraperiod swings develop. In past midterm-year windows, the worst adverse moves against the short often arrived early, followed by a more orderly drift lower. If SPGI instead grinds higher without the typical downside follow-through, that would be a clear sign that this midterm-year stretch is breaking from the 10-cycle pattern.
Sources
- Forbes: “S&P Global Stock Now 32% Cheaper: Is It Time To Buy?” (Feb 12, 2026)
- Reuters: “S&P Global forecasts 2026 profit below estimates, shares plunge” (Feb 10, 2026)
- CNBC: “Stocks making the biggest moves midday: Ferrari, Incyte, S&P Global, Datadog, BP and more” (Feb 10, 2026)
- Reuters: “S&P Global forecasts annual profit above estimates on strong demand” (Jul 31, 2025)
- The Wall Street Journal: “S&P Global Earnings Rise; Lowers FY Earnings Expectations” (Jul 31, 2025)