Marvell Technology (MRVL) Has Fallen in All Six Midterm Windows Starting Mar 23
Marvell Technology is heading into a historically weak midterm-election-year stretch just as its AI-fueled rally leaves the stock about 14% below its 52-week high and volatility elevated.

Key takeaways
- A 239-day midterm-election-year window for Marvell Technology starting Mar 23 has produced losses in all 6 historical cycles, aligning with a short trade direction.
- The pattern shows 100% Percent Profitable for shorts, with 6 winners and 0 losers and an average profit of 26.98% per window.
- Intraperiod swings have been large, with some years showing adverse moves of more than 40% before the short ultimately worked.
- Today MRVL trades at $87.86, about 14.4% below its 52-week high of roughly $102.62, after a sharp AI-driven earnings surge.
- Management-authorized buybacks and heavy post-earnings volume spikes add a positioning twist as the historically weak window approaches.[1][4][7]
According to historical data from TradeWave.ai, this upcoming stretch for Marvell has behaved very differently from an average year in past midterm-election cycles.
Seasonal window
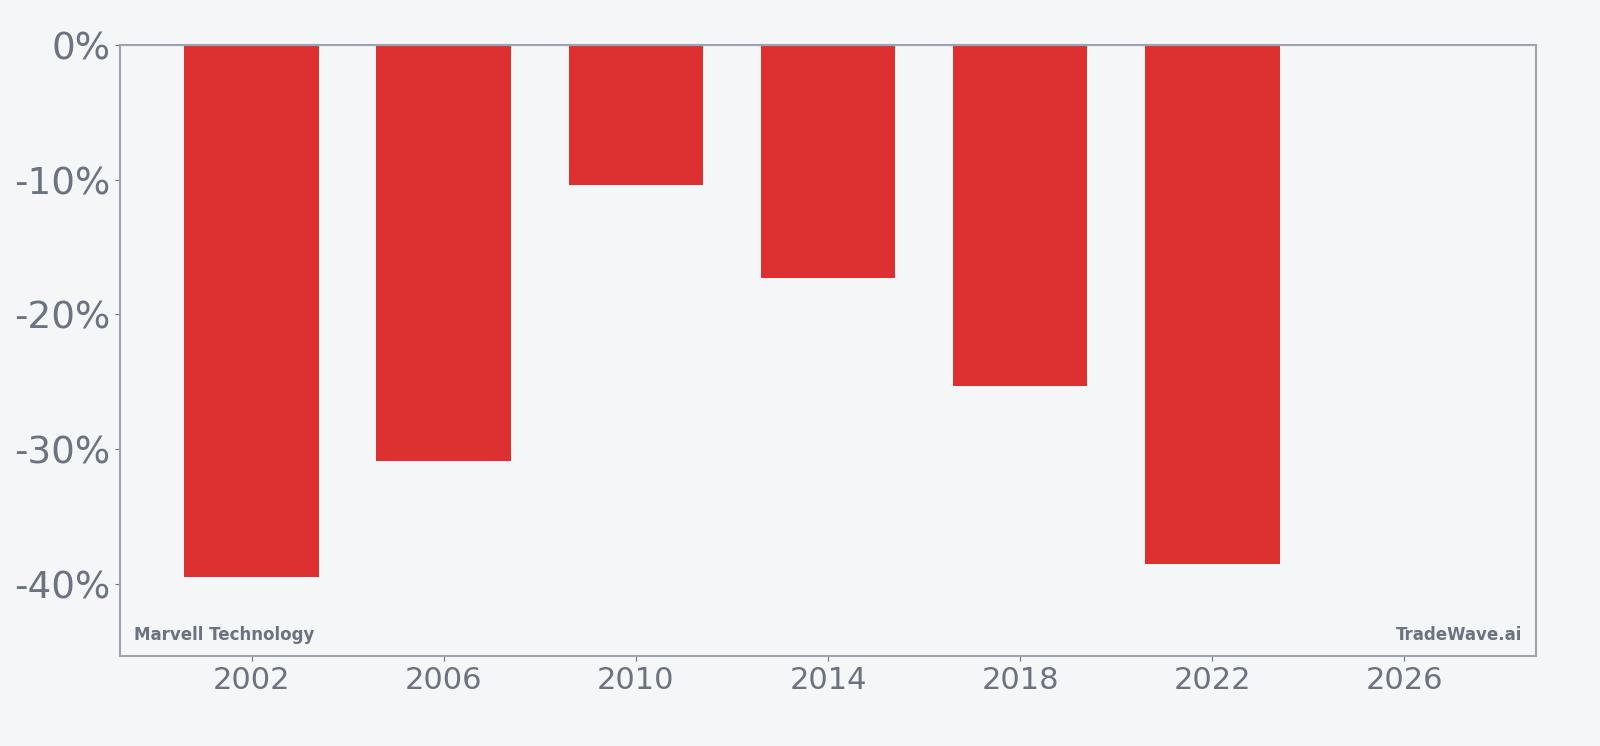
Marvell Technology has fallen in all 6 midterm-election-year windows that begin around Mar 23 and run for 239 trading days, with shorts averaging gains of 26.98%. The stock closed Monday at $87.86, about 14.4% below its 52-week high near $102.62 and up 12.31% over the past month, leaving it elevated but off the highs as this historically weak stretch approaches.
The window sits in the midterm election year, a phase that often brings policy uncertainty, shifting regulation risk and more selective liquidity for high-growth tech. Grouping results by this part of the presidential cycle matters because AI infrastructure spending, export controls and data-center incentives tend to move in multi-year policy waves rather than smooth calendar-year trends.
Historically, this 239-day stretch has been a clean short setup for Marvell. Percent Profitable is 100%, with 6 winners and 0 losers for the short side, and the average profit of 26.98% lines up with a 26.52% annualized return and a Sharpe ratio of 2.1, which is unusually strong for a single-name seasonal pattern. Add it up and the cumulative return across the six midterm-year windows is 310%, meaning a hypothetical strategy that repeated the short each cycle would have compounded meaningfully.
The per-year table shows how those gains have come together. The strongest year for shorts was 2002, when the window captured a 39.46% decline from an entry around $8.23 to an exit near $4.98. The weakest winning year was 2010, which still delivered a 10.41% drop from roughly $18.01 to $16.13 by the end of the window. Every midterm-year sample in between, including 2018 and 2022, finished with double-digit percentage declines for the stock.
Intraperiod swings have been rough. In 2002, the worst drawdown from the short entry, or maximum adverse excursion, was a 70.84% move against the position before the trade ultimately worked, while the best favorable move, or maximum favorable excursion, was 14.75%. In 2022, the short saw a favorable move of 11.1% at best but also had to sit through a 48.62% adverse swing at one point, underscoring how violent rallies can be inside an ultimately bearish window.
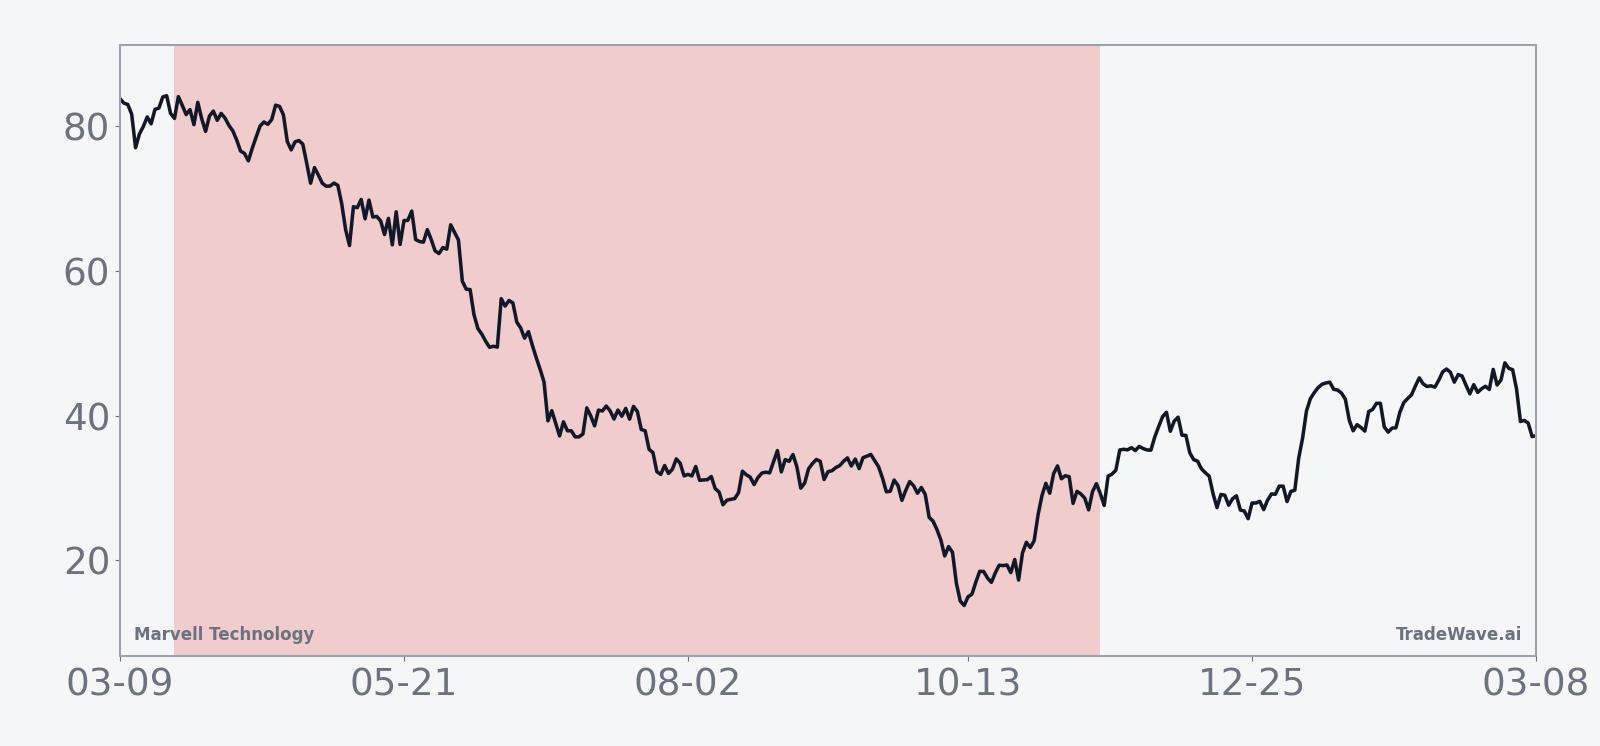
The typical path is not a smooth grind lower. Trend metrics show 54 days where the long side dominated versus zero for shorts when looking at one lens, and 57 long-favored days versus zero short-favored days on another, which suggests that rallies often appear inside the window even though the final outcome has favored shorts. The average cumulative return curve slopes lower over the full 239 days, but it does so in steps, with pockets of strength that would be painful for anyone leaning aggressively into the pattern too early.
Year-by-year bars with maximum favorable and adverse moves show how often big swings have occurred inside this window.
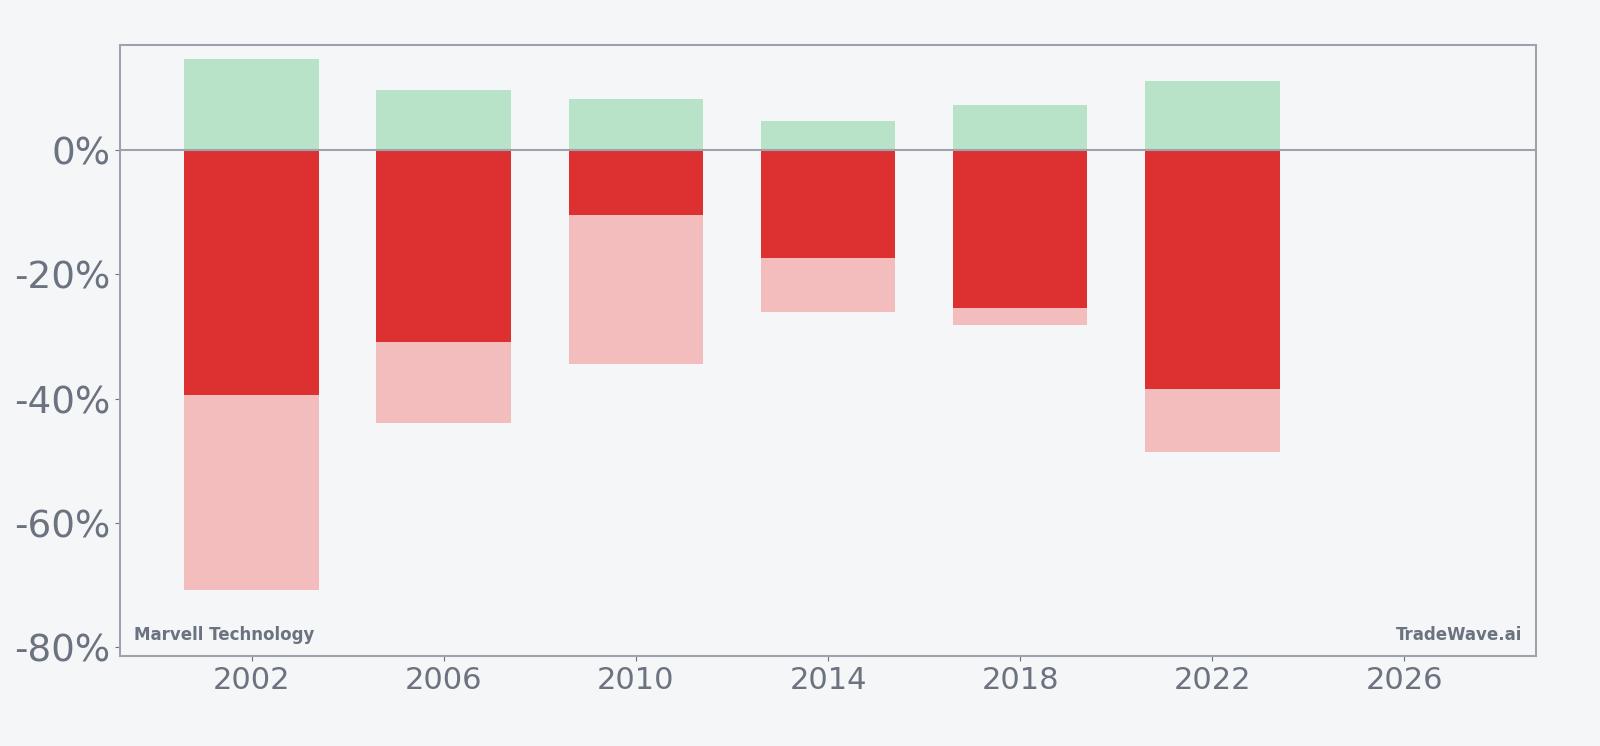
History does not guarantee future results; even in windows where the short ultimately won, adverse excursions have been large and could be difficult to sit through.
Price and near-term drivers
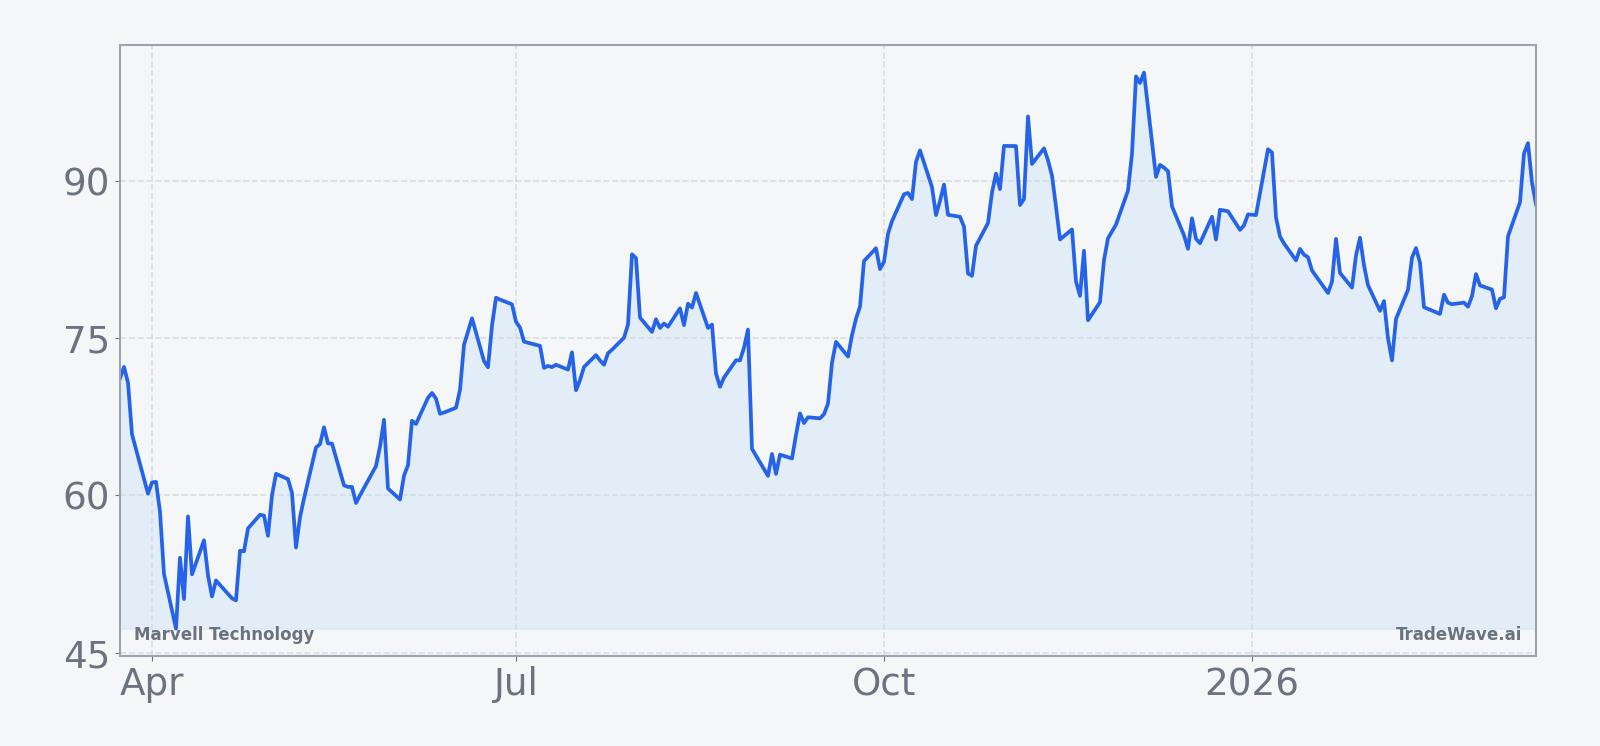
Marvell shares finished Monday at $87.86, up 0.22% on the day, extending a 12.31% gain over the past month and leaving the stock about 14.4% below its 52-week high near $102.62. The latest leg higher followed a strong Mar 5 earnings report, where Marvell posted Q4 revenue of $2.22 billion, up 22% year over year and slightly ahead of estimates, with adjusted EPS of 80 cents topping expectations by a penny.[1]
The company also guided fiscal 2027 revenue to grow more than 30% year over year to nearly $11 billion and forecast Q1 revenue of $2.40 billion, plus or minus 5%, above Wall Street’s prior view of about $2.27 billion.[1] Management highlighted robust demand for custom AI data-center chips, including work tied to Microsoft’s Maia program, reinforcing Marvell’s positioning as a key infrastructure supplier in the current AI buildout.[1][7]
That guidance sparked a sharp reaction in the stock. On Mar 5, shares surged roughly 15% to 18% in extended trading as investors rushed back into the name after last year’s worries about custom AI chip demand from cloud giants.[1][4][12] Trading volume spiked well above normal levels, and commentary from analysts framed the quarter as a validation of Marvell’s AI strategy after a choppy 2025 that included a selloff on a weaker data-center outlook in late August.[1][4][5][12]
In addition to the earnings beat, management has signaled confidence through a $6 billion buyback authorization and increased insider buying, according to prior analysis, which adds a layer of corporate support under the stock even as it trades in a volatile AI hardware cohort.[2] The sector backdrop remains constructive, with data-center and AI chip demand driving a 21% jump in Marvell’s data-center segment to $1.65 billion in the latest quarter, and broader commentary across the industry pointing to sustained hyperscaler investment in AI infrastructure.[1][5][7]
The chart below situates the latest move in its recent multi-month context.
Macro and election-cycle backdrop
The upcoming window unfolds in the midterm election year, a phase that often brings more policy noise around technology, trade and national security. For a company like Marvell, which sits at the intersection of AI infrastructure, cloud spending and semiconductor supply chains, shifts in export controls, data-center incentives or government AI funding can all influence order timing and investor sentiment.
Macro-wise, the story is still about AI infrastructure demand. Hyperscalers are racing to build out custom accelerators and networking gear, and Marvell’s latest quarter showed that AI-driven data-center revenue is already a major growth engine.[1][7] That demand can be lumpy, though, and midterm years have historically seen more abrupt pauses and re-accelerations in capex as policy debates over deficits, regulation and industrial strategy heat up.
For traders, the tension is clear. On one side, Marvell is riding a powerful AI wave with strong guidance and supportive corporate actions. On the other, the stock is about to enter a midterm-year window that has, in every prior cycle, rewarded patience on the short side with sizable eventual declines. The historical pattern does not call the top, but it does say that this part of the election cycle has often been the point where enthusiasm met a rougher tape for MRVL.
What to watch as the window opens
The 2026 midterm-year window for Marvell formally begins on Mar 23 and runs for 239 trading days, stretching deep into the year before the presidential election. Historically, shorts have been profitable in all six prior iterations, with average gains near 27% and several years posting declines of more than 30% from entry to exit. The key tell this time will be whether the stock can hold its post-earnings gains as the calendar flips into that historically weak stretch.
First, watch the $90 to $100 zone. That band sits just above Monday’s close and below the 52-week high, and it has been the launchpad for the latest AI-driven move. Sustained trade back above $100 would look very different from prior midterm-year windows, which typically saw rallies fade into deeper declines. A failure to reclaim that area, especially if accompanied by heavier selling on down days, would look more like the historical pattern.
Second, monitor AI data-center headlines and hyperscaler capex commentary. The last time sentiment turned sharply, in late Aug 2025, it was because Marvell’s data-center outlook fell short and raised questions about custom AI chip demand from cloud giants.[12] Any sign that current AI orders are being pushed out, resized or reprioritized could interact with the seasonal backdrop to amplify downside pressure.
Third, keep an eye on how the post-earnings volume spike and insider-support narrative evolve. The early-March surge came with 15% to 18% after-hours gains and heavy trading as investors chased the AI story.[1][4][7] If that enthusiasm cools quickly, or if buyback activity appears to be absorbing more selling than expected, it would suggest that the seasonal tendency toward choppier, weaker midterm-year behavior is reasserting itself. If, instead, volume remains constructive on up days and insiders continue to add, the stock could diverge from its historical script even as the window opens.[2]
Finally, volatility itself is a signal. Past midterm-year windows for MRVL have featured large maximum adverse excursions for shorts, meaning big rallies inside an ultimately bearish path. If this year’s window again delivers sharp two-way swings, traders may need to respect both the strength of the historical pattern and the reality that AI narratives can turn quickly with each earnings print or policy headline.
Sources
- [1] Reuters, "Marvell forecasts first quarter revenue above estimates," Mar 5, 2026.
- [2] Seeking Alpha, "Marvell: Significant AI Win Coming Soon (Double Upgrade)," Oct 6, 2025.
- [3] Seeking Alpha, "Marvell Stock Could Be A Marvellous Buy," Oct 5, 2025.
- [4] MarketWatch, "Marvell’s stock rockets 18% as data-center business demand grows," Mar 5, 2026.
- [5] Barron's, "Marvell Earnings Beat Thanks to ‘Robust’ AI Demand," Mar 5, 2026.
- [6] Forbes, "Should You Buy Marvell Technology Stock Today?," Dec 30, 2025.
- [7] Forbes, "Marvell Stock: AI Forecast Sparks Massive Investor Interest," Mar 9, 2026.
- [12] Reuters, "Marvell sinks as weak data center outlook stokes custom AI chip worries," Aug 29, 2025.