Oracle Corporation (ORCL) Has Delivered Gains in 10 of 10 Years in This 304-Day Window
Oracle Corporation is heading toward a 304-day stretch that has delivered double-digit gains in every year of the past decade, even as the stock trades well below its 52-week high and Wall Street remains split on the AI cloud story.

Key takeaways
- Oracle Corporation’s upcoming 304-day window starting Mar 27 has been profitable in 10 of 10 years, with a long trade direction.
- Across that decade, the average gain in winning years is 18.56%, with cumulative returns of 416% for the pattern.
- The window has seen sharp swings inside the trend, including a maximum favorable move of 138.51% in 2025 and a worst intraperiod drawdown of 26.69% in 2022.
- Today the stock trades at $151.56, about 55.8% below its 52-week high near $342.71, after a volatile AI-driven run.
- Recent commentary ranges from an Oppenheimer call to buy the post-selloff dip to high-profile short bets from Michael Burry, underscoring a crowded, polarized tape.[7][8]
- The seasonal profile is bullish but high-variance, with a TradeWave Ratio of 0.9 and a Sharpe ratio of 1.08, so intraperiod downside has historically been meaningful even in winning years.
According to historical data from TradeWave.ai, this is not just another long tech rally but a specific calendar regime that has behaved differently from an average year for Oracle Corporation. The next section walks through how that pattern has played out in prior cycles and what it could mean for the coming stretch.
Seasonal window
Oracle Corporation has risen in 10 of 10 years during this 304-day window, averaging gains of 18.56%. The next iteration begins on Mar 27, with the stock currently at $151.56 and trading about 55.8% below its 52-week high of roughly $342.71.[1] That combination of a strong historical window and a stock well off its peak gives traders a clear calendar marker to watch as the AI cloud story evolves.
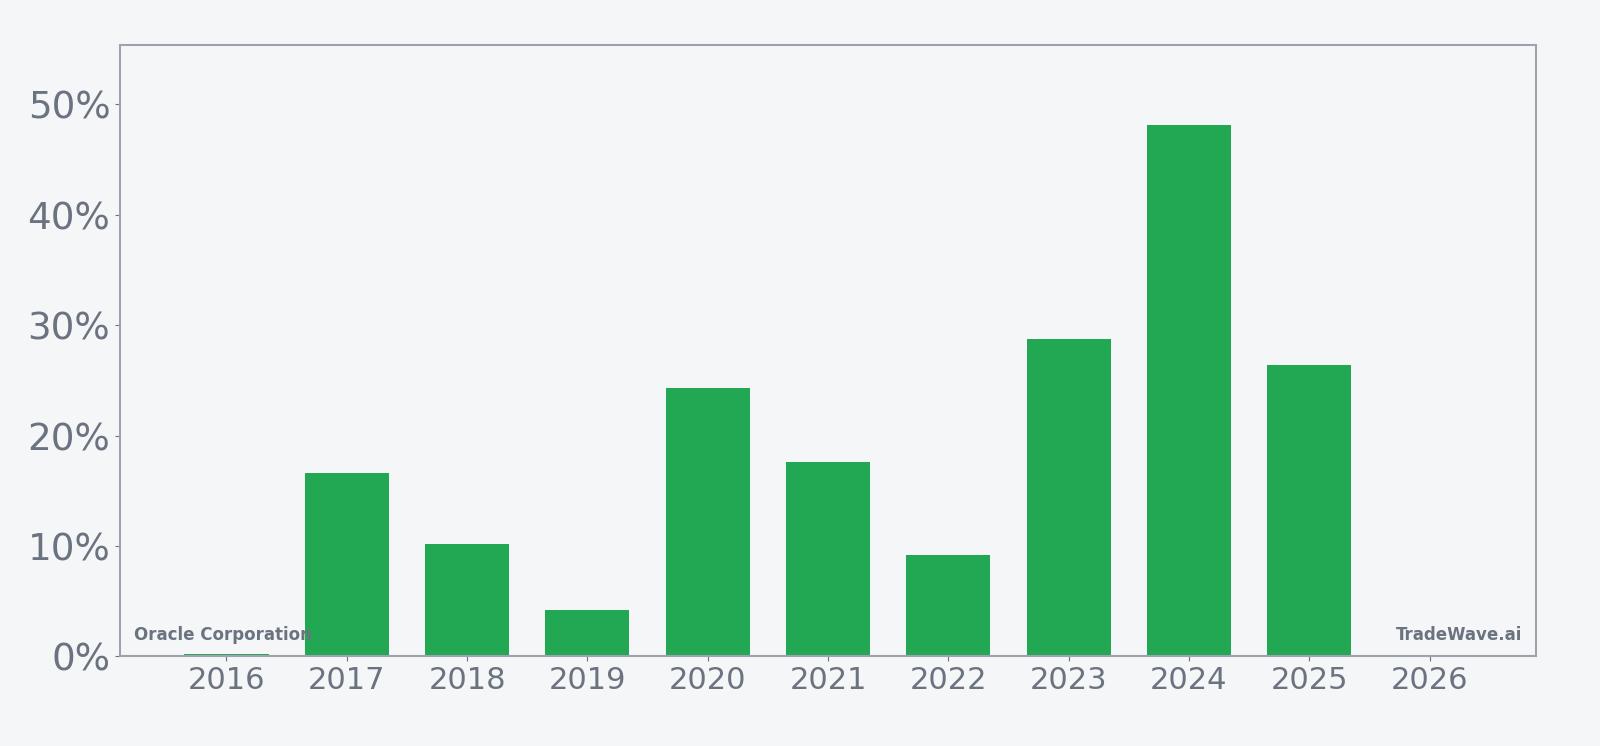
Historically this has been a long-biased regime for Oracle Corporation. Every one of the past 10 cycles finished higher over the 304 trading days, with the weakest year, 2016, still closing slightly positive at 0.23% and the strongest, 2024, up 48.17%. The pattern’s long trade direction lines up with that track record, but the path to those gains has rarely been smooth.
Average profit in winning years sits at 18.56%, while the median outcome is close by at 17.11%, which suggests the distribution is not dominated by a single outlier. At the same time, the standard deviation of 14.07% and a Sharpe ratio of 1.08 point to a window that has rewarded patience but demanded a strong stomach for volatility. Add it up: 416% cumulative return across ten of these long windows is a powerful backdrop for a stock that has become a core AI infrastructure play.
The per-year detail shows how that volatility has played out. In 2020, the stock’s best intraperiod move, or maximum favorable excursion, reached 34.59% before settling at a 24.29% gain by the end of the window. In 2025, the peak run-up was even more extreme at 138.51%, with the trade still closing up 26.42% after a deep giveback. On the downside, the worst intraperiod drawdown, or maximum adverse excursion, came in 2022, when the stock was down as much as 26.69% inside the window before finishing with a 9.16% gain.
That mix of large positive and negative excursions is what the TradeWave Ratio of 0.9 is flagging. Price has typically traveled a long way in the trade direction at some point during the window, but the MAE profile shows that those moves have often come with double-digit drawdowns along the way. For traders, the message is that this has been a “stay in your seat” window rather than a gentle grind higher.
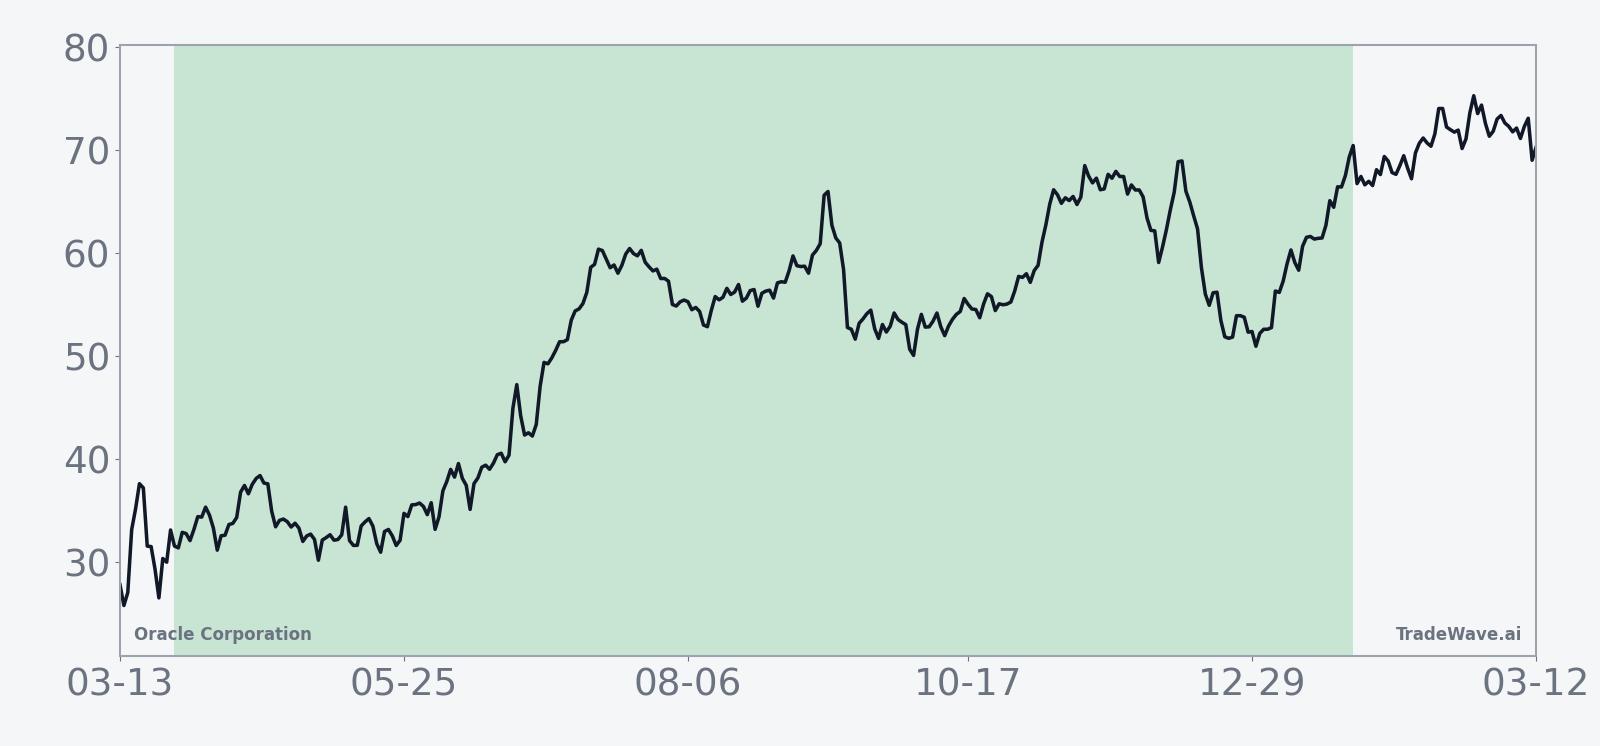
The 10-year average seasonal trend suggests that strength has tended to build in the middle and later portions of the window rather than in a straight line from the start. Some years, such as 2019 and 2021, saw relatively modest early gains that accelerated later, while others, like 2022, experienced a sharp early drawdown before recovering into the close. The cumulative pattern is less about a single “hot month” and more about a long regime where upside has eventually dominated.
Year-by-year net returns and intraperiod swings put that regime into sharper focus.
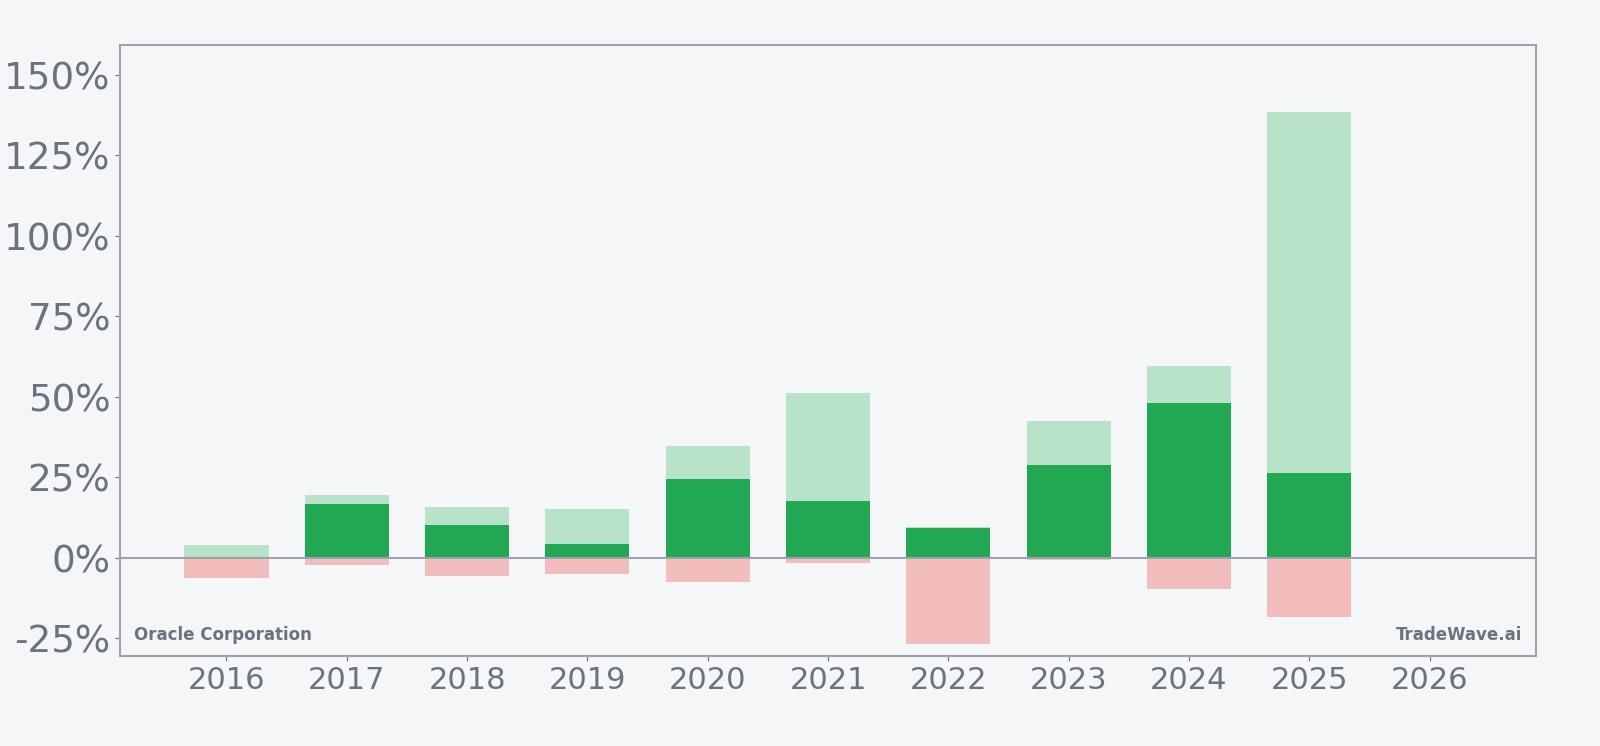
Those bars show a consistent pattern: every year finished green, but several saw Oracle Corporation trade deeply underwater at some point. The 2022 bar, for example, pairs a modest final gain with a steep intraperiod loss, while 2024 and 2025 show very large peak run-ups that were partially surrendered before the window closed. For a long setup, that combination of strong maximum favorable moves and sizable maximum adverse moves points to a high-variance environment where timing and risk limits matter as much as direction.
History does not guarantee future results; adverse excursions can be large even in winning windows, and past seasonal behavior may not repeat.
Price and near-term drivers
Oracle Corporation shares closed Monday at $151.56, down 0.9% on the day, after trading between $146.43 and $152.00 in a busy session that saw volume of about 30.9 million shares against a 20-day average near 25.9 million. The stock sits well below its 50-day moving average around $169.54 and far off its 52-week high near $342.71, a reminder of how violent the AI cloud trade has been over the past year.[1]
That volatility has drawn in both bulls and bears. On Feb 25, Oppenheimer argued it was time to buy Oracle after the latest selloff, pointing to the company’s positioning in AI infrastructure and the potential for cloud demand to reassert itself.[7] In January, Michael Burry, known for “The Big Short,” was reported to have taken a bearish stance on Oracle, adding to a chorus of skeptics who worry about valuation and the pace of cloud backlog conversion.[8] Earlier commentary from Morgan Stanley in late 2025 also leaned negative, suggesting short positions on concerns around financing strategy and execution.[10]
Those debates have played out against a backdrop of strong but uneven fundamentals. In fiscal Q2 2026, Oracle delivered adjusted earnings of $2.26 per share on $16.06 billion in revenue, up 14% year over year, with cloud revenue reaching $8 billion but coming in slightly below some estimates.[1][6] Management has guided to at least $67 billion in total revenue for fiscal 2026, leaning heavily on accelerating growth in cloud and AI infrastructure, even as investors parse how quickly that backlog converts into realized sales.[1]
Analyst views remain constructive on balance. LSEG data cited by CNBC and UBS shows a Buy consensus rating and a price target of $335, a level that reflects expectations formed when the stock was trading in a higher range than today.[1][2][3][4][7] Some firms, including UBS, trimmed targets after mixed earnings in December 2025, citing the revenue miss and questions around the pace of AI-related deals, while others such as Mizuho have reiterated Outperform ratings based on Oracle’s cloud growth trajectory.[1][3][4]
Sector context has been supportive. In June 2025, Reuters reported that Oracle shares hit a record high as AI cloud demand propelled the company’s revenue forecast, with cloud infrastructure revenue growing 66% and positioning the firm as a key player in the AI super-cycle.[5] That same AI infrastructure theme continues to dominate macro narratives around Oracle, even as the stock’s pullback and the emergence of high-profile shorts show how crowded and contested the trade has become.[2][5][8]
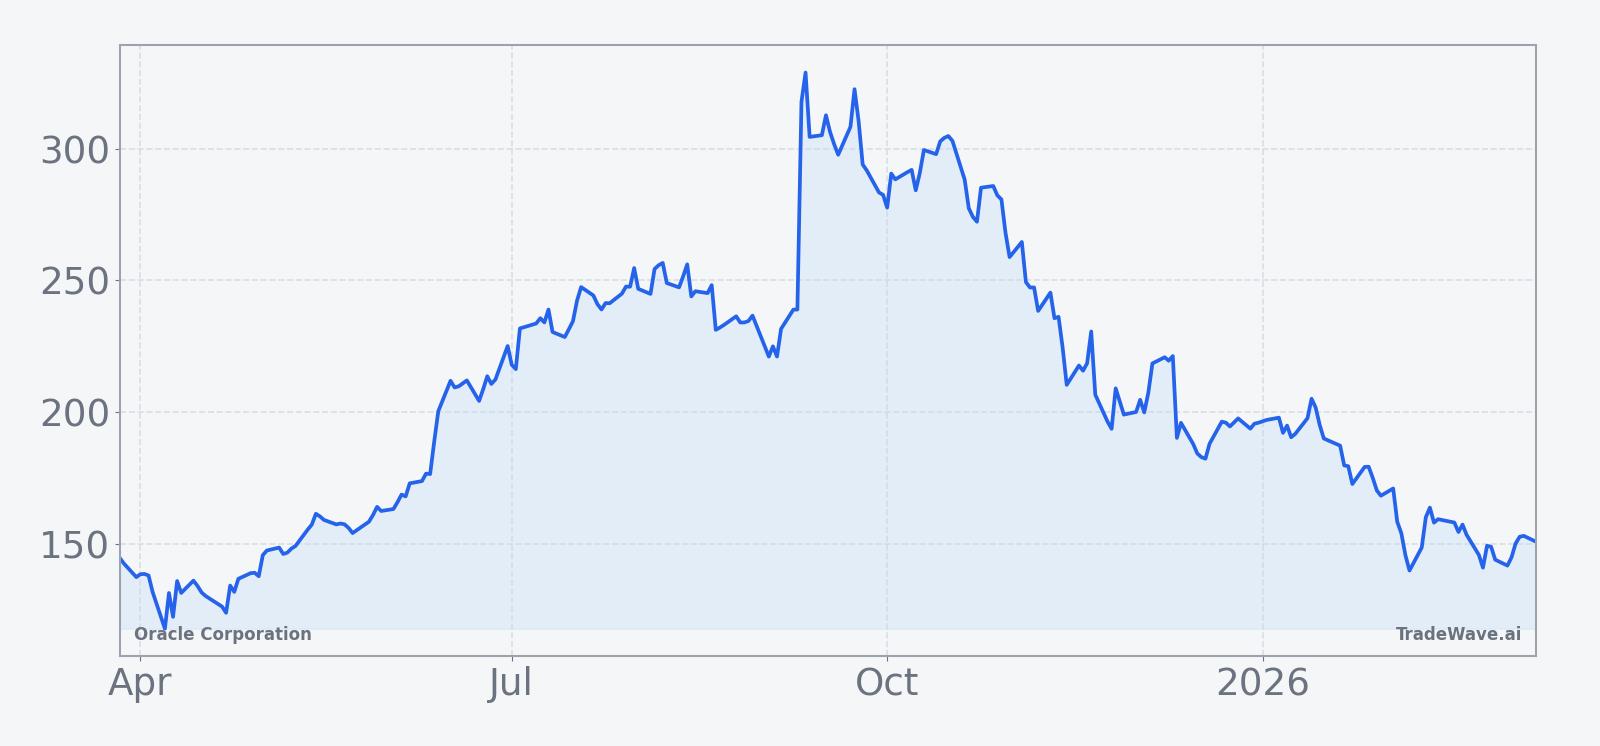
The chart below situates the latest move in its recent multi-month context.
Earnings and guidance backdrop
Oracle’s recent earnings pattern helps explain why the stock is both volatile and polarizing heading into the next seasonal window. In December 2025, the company reported mixed fiscal Q2 results, with revenue slightly below expectations despite strong cloud growth, which triggered a sharp selloff and its worst single-day drop of the year on heavy volume.[1][4][6] That reaction reflected investor sensitivity to any sign that AI-driven demand might not translate into near-term revenue as quickly as hoped.
Even so, the earnings line has remained solid. The latest quarter’s 14% year-over-year revenue growth and $8 billion in cloud revenue underscore that Oracle is still gaining share in key infrastructure markets.[1][6] Management’s guidance for at least $67 billion in fiscal 2026 revenue leans on continued acceleration in cloud and AI infrastructure, suggesting that the company expects the current investment cycle to support multi-year growth rather than a one-off spike.[1]
Wall Street’s expectations reflect that tension. CNBC’s preview of Oracle’s December earnings highlighted a wide range of analyst views, from those focused on the durability of AI workloads to others worried about margin pressure and capital intensity.[2][4] That dispersion in estimates and narratives is part of what makes the upcoming seasonal window notable: a historically strong long regime is about to intersect with a fundamental story that is anything but consensus.
Macro and sector positioning
On the macro side, Oracle sits squarely in the AI super-cycle theme that has dominated equity markets. CNBC and other outlets have framed the company as a key beneficiary of AI infrastructure build-out, with large cloud and database deals driving revenue and backlog.[2][5] That positioning ties Oracle’s fortunes not just to enterprise IT budgets but to broader questions about how quickly AI workloads scale and how much of that spend flows to its platforms versus hyperscale rivals.
Within the cloud infrastructure sector, Oracle has been one of the more aggressive players in pitching AI-specific capacity. Yahoo Finance coverage of its recent quarters has emphasized 66% growth in cloud infrastructure and strong demand for AI-related services, even as some analysts worry about the pace of backlog conversion and the capital required to support that growth.[1][5] For investors, that means Oracle trades at the intersection of secular AI optimism and cyclical concerns about spending and financing.
Valuation and positioning into the window
Valuation is harder to pin down precisely without fresh multiples, but the broad contours are clear. Oracle is treated as a growth compounder in AI and cloud, which has historically supported a premium to legacy software peers, yet the stock’s slide from its 52-week high has compressed that premium and opened the door for both value-oriented buyers and high-profile shorts.[5][8] The consensus Buy rating and $335 target from LSEG via CNBC and UBS reflect expectations formed in a more euphoric price regime, so investors are now weighing whether the current level represents a reset or a value trap.[1][2][3][4][7]
Positioning data is limited, but the presence of bearish calls from Morgan Stanley and short bets from Michael Burry suggests that some sophisticated investors see downside risk if AI demand or financing conditions disappoint.[8][10] At the same time, Oppenheimer’s late-February call to buy the dip shows that other institutions view the pullback as an opportunity to add exposure ahead of what they see as a multi-year AI infrastructure cycle.[7]
What to watch as the window opens
For traders tracking this pattern, the key date is Mar 27, when the 304-day seasonal window kicks in. Historically, the strongest gains have often come after periods of volatility and drawdown inside the window, so the behavior of Oracle Corporation in the first few months will be important. A repeat of 2022-style early weakness followed by recovery would fit the historical script, while a straight-line move with little intraperiod downside would mark a departure from the past decade.
Earnings and guidance will be the first major test. Any update that changes the trajectory of the $67 billion fiscal 2026 revenue target or the pace of AI cloud growth could either reinforce or challenge the bullish seasonal backdrop.[1][2][4][6] Traders will also be watching how the stock trades around its 50-day moving average near $169.54 and whether it can build a base above recent lows near the mid-$140s as the window progresses.[1]
Street positioning is the other key variable. Follow-through on Oppenheimer’s bullish stance, or a shift in tone from previously cautious houses like Morgan Stanley, would signal that the fundamental narrative is catching up with the historical seasonal tailwind.[7][10] Conversely, if high-profile shorts such as Michael Burry add to positions or new bearish calls emerge, that would suggest the market is leaning against the pattern and bracing for a different outcome this time.[8]
In short, the calendar is about to flip into a window that has been 10-for-10 for Oracle Corporation over the past decade. Whether that streak continues will depend on how AI cloud demand, earnings execution and a divided Wall Street interact with a historically powerful but volatile seasonal regime.
Sources
- Yahoo Finance: Oracle (ORCL) Gets Price Target Cut From UBS After Mixed Earnings (Dec 14, 2025)
- CNBC: What Wall Street analysts expect from Oracle earnings (Dec 10, 2025)
- Yahoo Finance: Mizuho Reaffirms Oracle (ORCL) Outperform Rating (Jan 2, 2026)
- CNBC: Wall Street is disappointed by Oracle's report (Dec 11, 2025)
- Reuters: Oracle shares hit record high as AI cloud demand propels revenue forecast (Jun 12, 2025)
- Yahoo Finance: Oracle (ORCL) Suffers Its Worst Drop of 2025 After Q2 Miss (Dec 11, 2025)
- CNBC: It's time to buy Oracle shares after the sell-off, says Oppenheimer (Feb 25, 2026)
- Seeking Alpha: Big Short Michael Burry bets against Oracle (ORCL) (Jan 10, 2026)
- Financial Times: Morgan Stanley thinks you should short Oracle (Nov 27, 2025)
- CNBC: Final Trade: ORCL, NVO, VLO, VEA (Sep 16, 2025)