JPMorgan Chase (JPM) Has Rallied in 10 of 10 Years in This 233-Day Bullish Window
JPMorgan Chase is heading toward a long seasonal stretch that has delivered double-digit gains in every year of the past decade, even as shares trade well below their 52-week high and investors eye the next earnings update.
Key takeaways
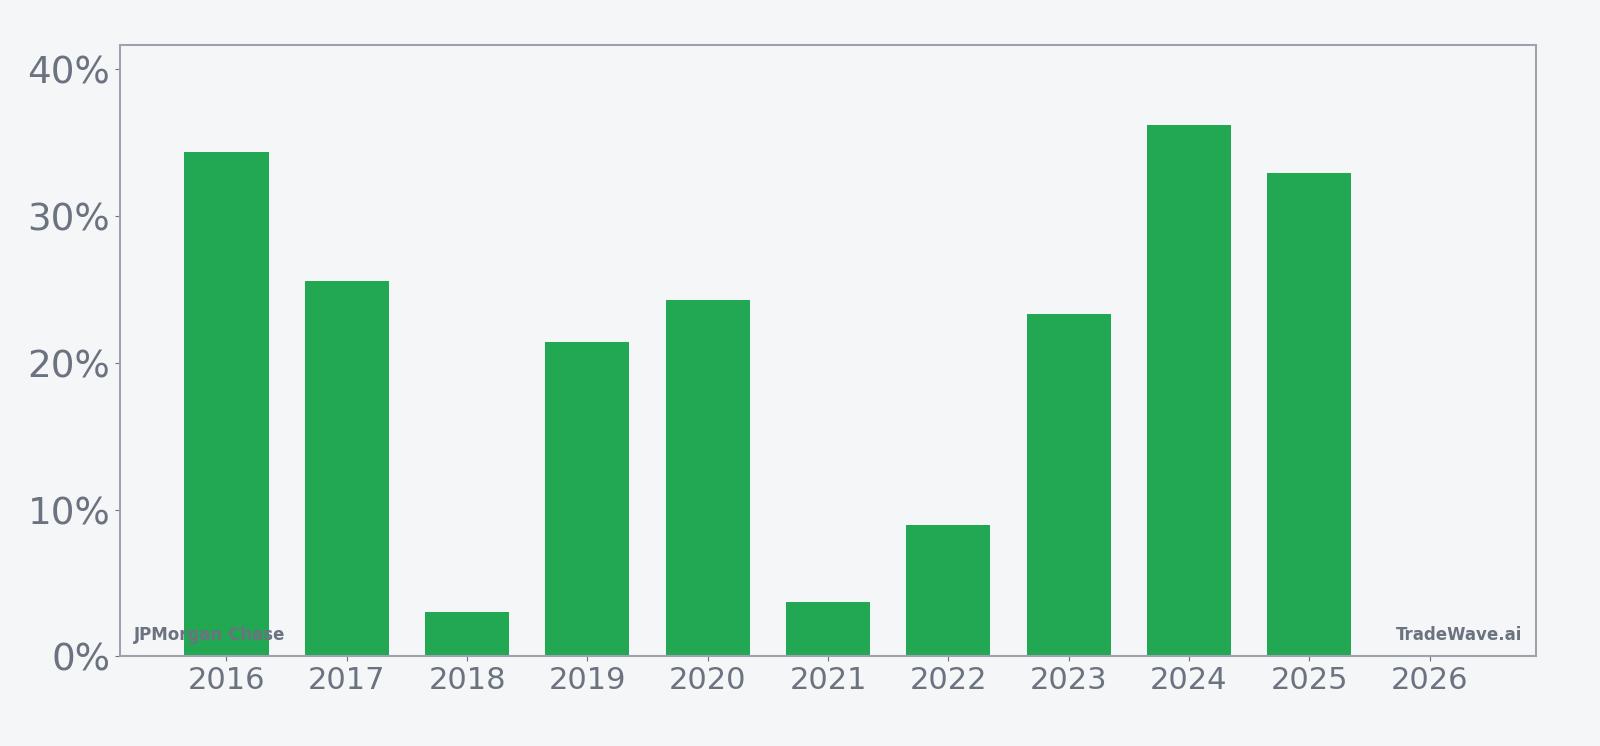
- JPMorgan Chase has posted gains in 10 of 10 years during this 233-day window, with an average profit of 21.37% for long positions.
- The upcoming window begins Apr 13, 2026 and runs for roughly three quarters of the year, functioning as a long seasonal regime rather than a short-term trade.
- All years in the sample were winners, with no losing seasons, and a median profit of 23.8% that is slightly higher than the average, hinting at a consistent upside skew.
- The TradeWave Ratio of 1.99 and a Sharpe ratio of 1.53 point to strong historical upside moves relative to volatility in this stretch.
- Intraperiod swings have still been meaningful, with some years showing double-digit drawdowns from entry before finishing higher, so timing and risk controls have mattered.
- With JPM shares about 14.6% below their 52-week high and the next earnings report expected in October, this window could intersect with key macro and bank-specific catalysts.
According to historical data from TradeWave.ai, this part of the calendar has behaved very differently for JPMorgan Chase than an average year, and the next iteration of that pattern is approaching again.
Seasonal window
JPMorgan Chase has risen in 10 of 10 years during this 233-day window, averaging 21.37% gains for long positions. The next window begins on Apr 13, 2026, with the stock last closing at $286.89, about 14.6% below its 52-week high of $335.87.[1] That combination of a strong long-term seasonal tailwind and a pullback from the highs gives this stretch more weight than a typical calendar quirk.
A combined view of net returns with peak run-ups and worst drawdowns shows how far JPM has tended to travel inside the window.
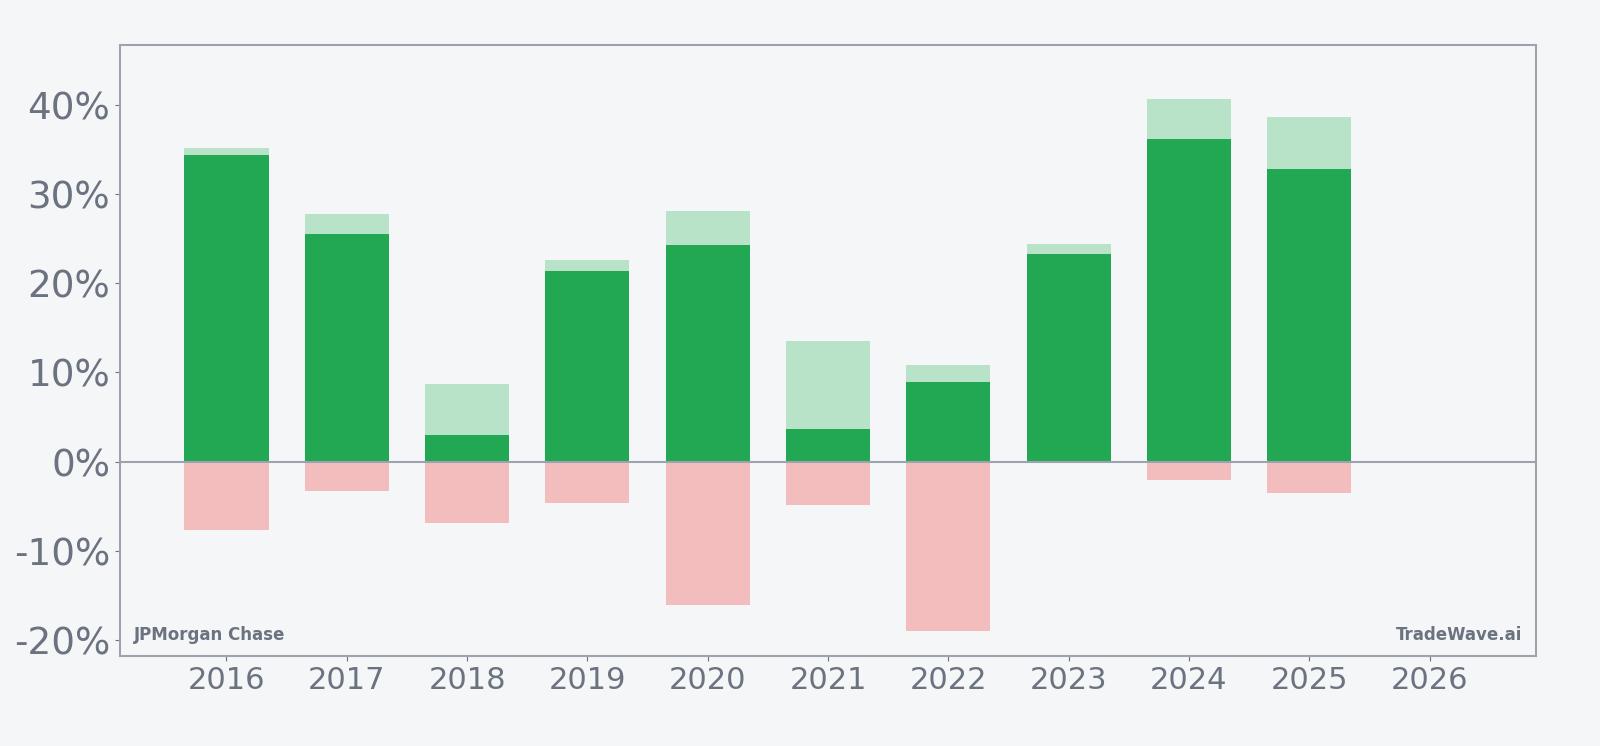
Across the 10-year sample, the long trade direction has been clear. Every single year finished positive, with the weakest outcome still up 3.03% and the strongest year, 2024, delivering a 36.22% gain from entry to exit. The median profit of 23.8% sits slightly above the average, which suggests the distribution has leaned toward solid, repeatable gains rather than a pattern dominated by one or two outliers.
The intraperiod swings tell a more nuanced story. In 2020, for example, the best point-to-peak move inside the window reached 28.18%, but the worst drawdown from entry was a sizable 16.08% before the trade finished higher. In 2022, the stock ultimately gained 8.94%, yet at one point it was down 19.02% from the starting level. Those maximum favorable and adverse excursions show that even in winning years, the path has not always been smooth.
Other years have looked more controlled. In 2017, JPMorgan Chase rallied 25.57% with a peak run-up of 27.81% and only a 3.28% worst drawdown from entry. The 2024 window was similar in spirit, with a 36.22% net gain, a 40.68% best intraperiod rally and just a 2.02% adverse move at the worst point. When the stock has been in a strong fundamental and macro backdrop, the seasonal tailwind has often coincided with relatively shallow pullbacks.
The 10-year average trend line for this window slopes higher in a fairly steady fashion rather than spiking only at the end. That suggests gains have tended to accrue across the life of the trade, with multiple opportunities for the stock to make new highs inside the window. The cumulative return profile, at 561% across the decade, underlines how powerful this specific slice of the calendar has been for long exposure when repeated year after year.
The volatility profile, captured in the standard deviation of 12.27% and a Sharpe ratio of 1.53, points to a window where returns have been strong relative to risk. The TradeWave Ratio of 1.99 indicates that price has typically traveled meaningfully in the trade direction during the window, not just drifted modestly higher. Add it up: 10 for 10 winning years, double-digit average gains and a history of sizable intraperiod swings that have so far resolved in favor of the bulls.
History does not guarantee future results; adverse excursions (MAE) can be large even in winning windows.
Price and near-term drivers
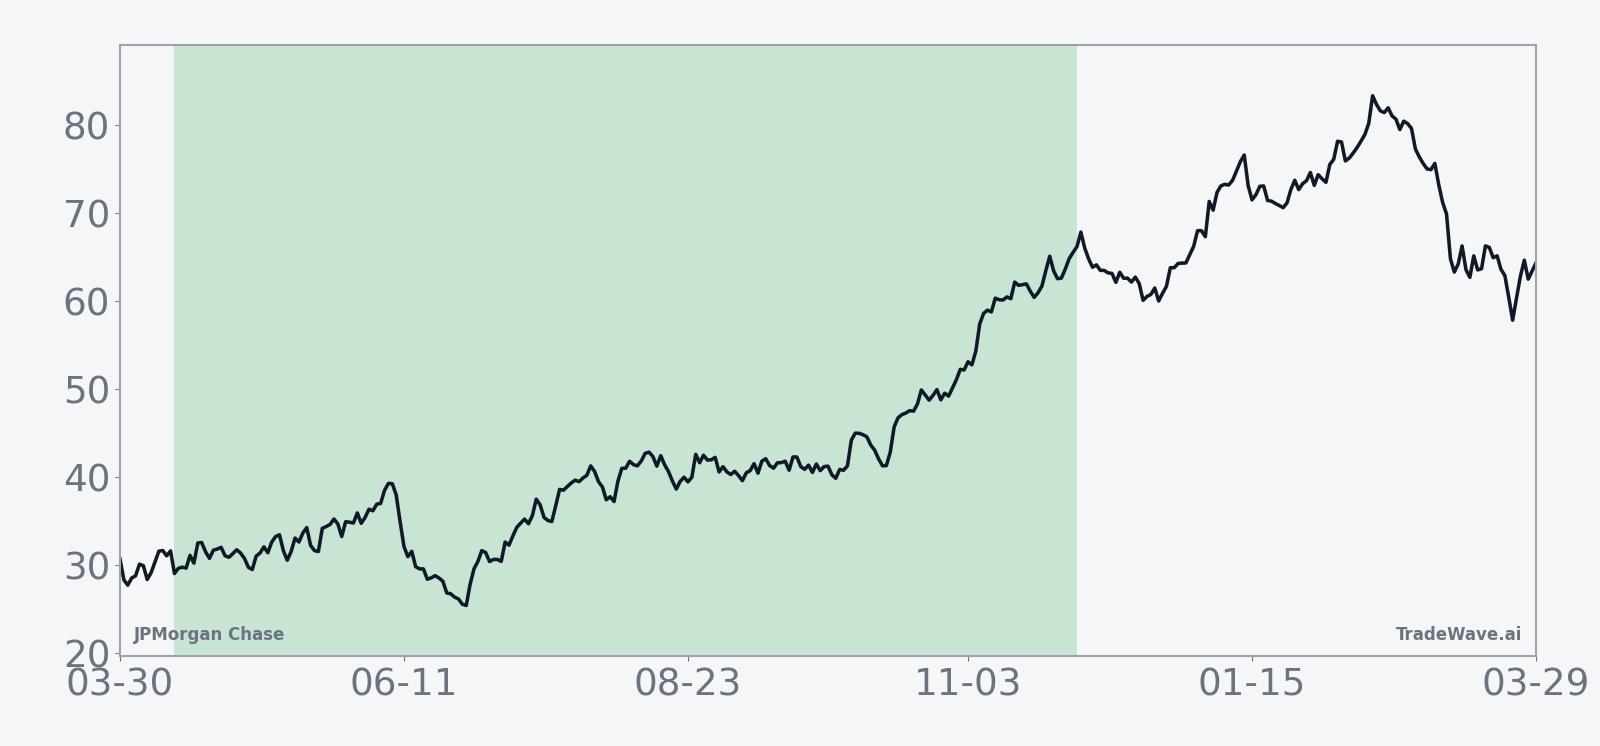
JPMorgan Chase closed at $286.89 on Mar 17, up 0.3% on the day, leaving the stock about 14.6% below its 52-week high of $335.87 and well above its 52-week low of roughly $196.52.[1] The pullback over the past month, a decline of 6.59%, comes after a powerful multi-year run that has seen JPM outpace many peers and become the de facto bellwether for large U.S. banks.[1]
In January 2026, JPMorgan’s fourth-quarter earnings beat expectations, with profit helped by strong trading performance even as political pressure on credit card rates weighed on the stock price around the release.[9] That followed a string of beats through 2025, including a Q4 2024 report that delivered earnings per share of $4.81 on revenue of $42.77 billion, up 10.9% year over year, and a first-quarter 2025 print that showed profit of $14.64 billion and 8% revenue growth to $46.01 billion.[1][5] Across those quarters, trading and investment banking fees repeatedly came in ahead of forecasts, helped by volatility tied to tariffs and shifting trade policy.[2][3][7][10]
Street expectations heading into the next scheduled earnings date on Oct 14, 2025, called for Q3 earnings per share of $4.84 and revenue of $45.4 billion, with analysts focused on how long robust trading and consumer resilience can offset higher funding costs.[2] Management has already raised its 2025 net interest income guidance to $95.8 billion and introduced 2026 guidance at $95 billion excluding markets, signaling confidence in the core lending and deposit franchise even as markets debate the path of rates and credit quality.[3]
Sector context has been supportive. Large banks have outperformed regional lenders, with the KBW Bank Index up 15% at one point as trading and wealth management helped offset pressure on traditional spread income.[2] JPMorgan has also leaned hard into technology, with a $17 billion tech budget for 2024 and roughly 9% of revenue allocated to technology, earning it the “Nvidia of banking” label from one prominent analyst in March 2025.[8] That AI and automation push has become a key part of the bull case as investors look for scale advantages in a more regulated, capital-intensive industry.
Macro conditions have been a double-edged sword. Volatility from tariffs and trade policies under President Trump has boosted trading revenue, but it has also raised questions about the durability of global growth and the potential for higher credit losses if asset prices reset.[5][6] JPMorgan has positioned itself as a shock absorber in that environment, preparing for scenarios that include persistent inflation, elevated asset prices and renewed tariff battles, while still returning capital through dividends and buybacks.[1][5]
The chart below situates the latest move in its recent multi-month context.
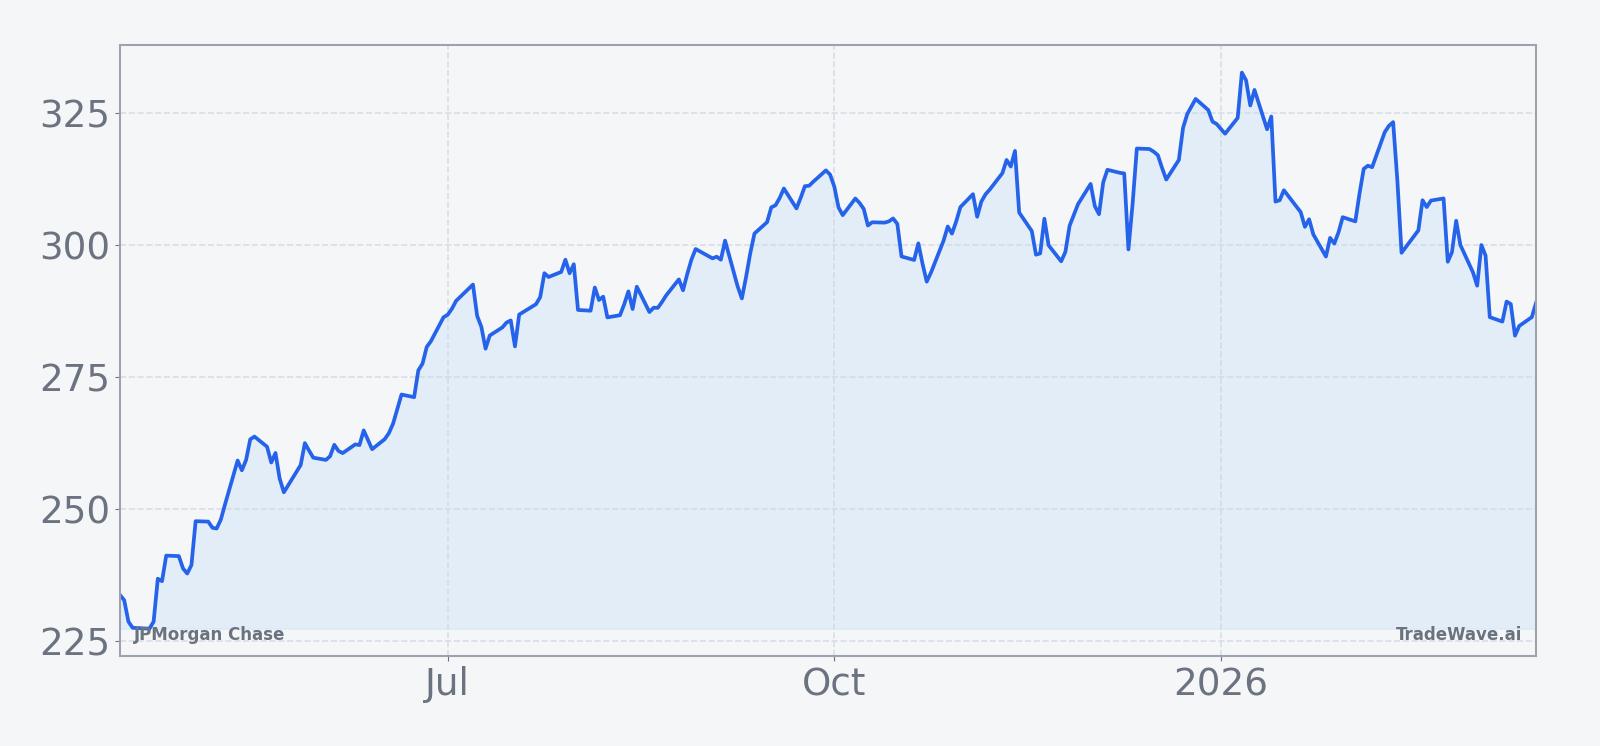
What to watch as the window opens
The seasonal window starting Apr 13 will run for 233 trading days, overlapping JPMorgan’s next two earnings reports and a critical stretch for U.S. monetary policy. For traders tracking the pattern, the first checkpoint will be how the stock behaves into and just after the April start date: in prior years, the average path has shown gains building steadily rather than waiting for a single late surge.
Price levels matter. On the upside, the 50-day moving average around $305.83 and the 52-week high near $335.87 are the obvious resistance zones to watch.[1] A move back above the 50-day during the early part of the window would echo the stronger historical years, when rallies developed quickly and drawdowns stayed shallow. On the downside, the one-month low near $285.95 and the much lower 52-week trough around $196.52 frame the risk if macro or regulatory shocks hit while the window is open.[1]
Earnings will be the other key test. If Q3 and Q4 results around October and January again show trading and investment banking outperformance, alongside stable credit and confirmation of the higher net interest income guidance, that would align with the backdrop that has historically supported the best seasonal outcomes.[2][3][4][7][9][10] A weaker tape around those reports, or any sign that political pressure on fees and lending spreads is biting harder than expected, would be a clear break from the pattern that has underpinned the 10-for-10 record.
Finally, watch how JPMorgan trades relative to the broader bank complex. Outperformance versus the KBW Bank Index and continued leadership in AI and technology spending would reinforce the idea that investors are still willing to pay a premium for scale and innovation.[2][8] Underperformance, especially if paired with renewed tariff or macro shocks, would be a sign that this cycle’s version of the window may not follow the script of the past decade.
Sources
- [1] MarketBeat: JPMorgan Chase & Co. (NYSE:JPM) Declares Dividend Increase (Mar 18, 2025)
- [2] CNBC: JPMorgan Chase is set to report third-quarter earnings (Oct 14, 2025)
- [3] Seeking Alpha: JPMorganChase lifts 2025 NII, expense guidance (Oct 14, 2025)
- [4] CNBC: Stocks making the biggest moves premarket: L3Harris, JPMorgan (Jan 13, 2026)
- [5] CNBC: JPMorgan Chase is set to report first-quarter earnings (Apr 11, 2025)
- [7] Bloomberg: JPMorgan Traders, Bankers Crush Estimates for Third-Quarter Haul (Oct 14, 2025)
- [8] Seeking Alpha: JPMorgan Chase is the 'Nvidia of banking' (Mar 20, 2025)
- [9] Barron's: JPMorgan’s Unusual Fourth Earnings Weigh on Stock (Jan 12, 2026)