S&P 500 Energy Sector SPDR (XLE) Has Rallied in Every Midterm Spring Window So Far
S&P 500 Energy Sector SPDR is stepping into a historically bullish 61-day midterm-year stretch just as options traders and geopolitical shocks pull fresh money into the sector.

Key takeaways
- A 61-day seasonal window for S&P 500 Energy Sector SPDR tied to midterm election years began on Mar 3.
- Across the last 6 midterm cycles, XLE has finished this window higher every time, with 6 winners and 0 losers.
- Average gain across those winning years is 6.97%, with a 49% cumulative return and a long trade direction.
- Intraperiod swings have been meaningful, with individual years showing adverse moves of up to about 6% before recovering.
- Options traders positioned for a sector comeback in late 2025, and retail flows spiked into XLE after fresh geopolitical shocks in early March 2026.[1][2][3]
- History points to a bullish seasonal bias, but the window has still delivered sizable drawdowns along the way.
According to historical data from TradeWave.ai, this specific midterm-year spring stretch has behaved very differently from an average two-month period for XLE. The next section unpacks how that pattern has played out across prior cycles and what it implies for the current backdrop.
Seasonal window
The seasonal window that began on Mar 3 and runs for 61 trading days has never produced a losing outcome for S&P 500 Energy Sector SPDR in the last six midterm election years, with XLE posting gains every time and averaging 6.97% advances. Today’s price sits within an 11.73% one-month upswing and between a 52-week low near 17.71 and a 52-week high of 57.88, leaving plenty of room on either side for volatility in this regime.[3] That combination of a clean seasonal track record and a sharp recent rally gives this window outsized importance for energy traders trying to gauge whether flows into the sector have real staying power.
Grouping the data by the presidential election cycle matters here because energy has often traded differently in midterm years than in election or pre-election years, as policy debates over regulation, drilling, and strategic reserves tend to heat up in the middle of a presidential term. This pattern phase isolates the last six midterm election years and asks a simple question: what typically happened to XLE when this 61-day spring window opened?
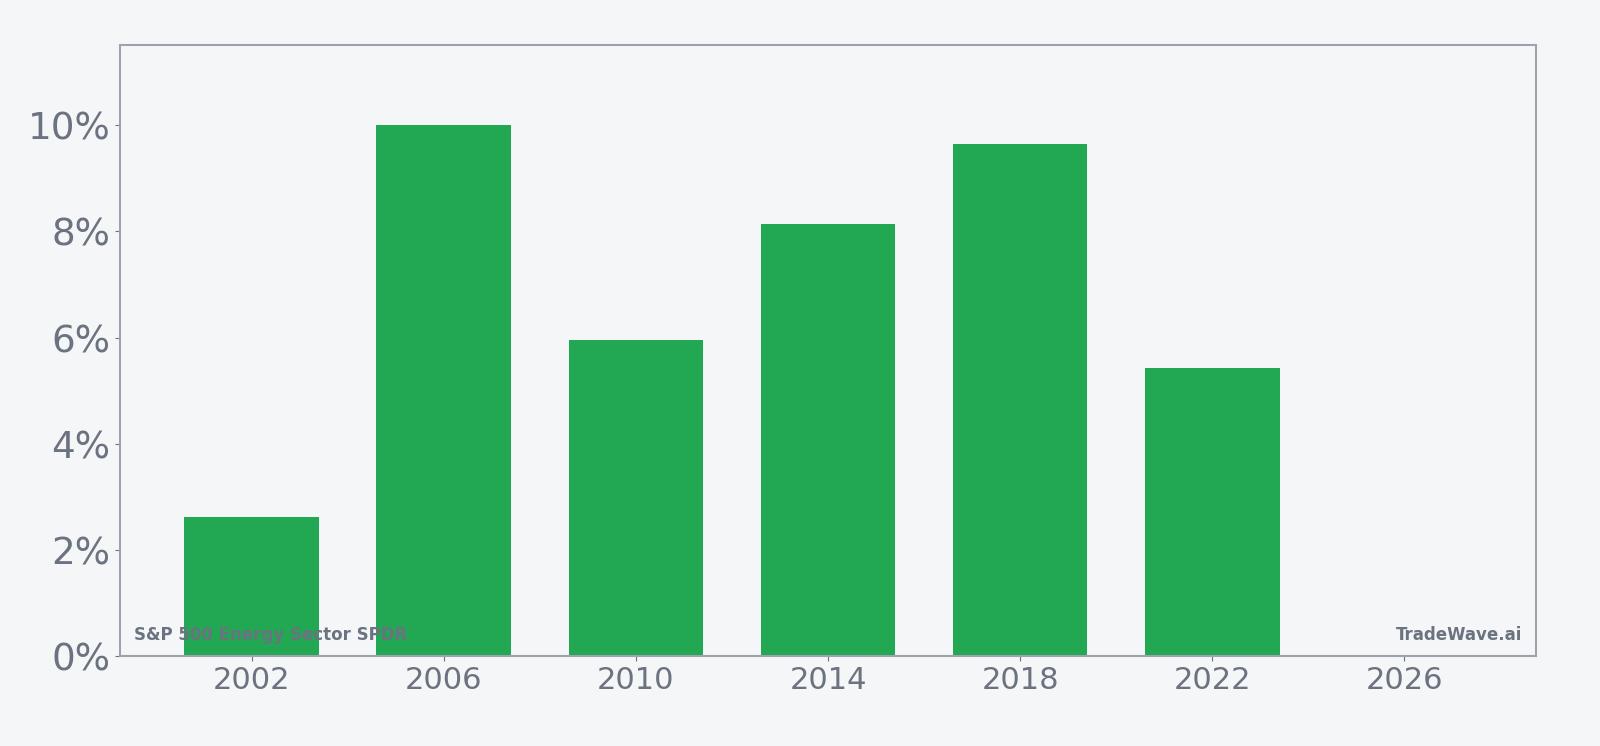
Across the six midterm-year samples, XLE’s average path in this window has been steadily positive rather than explosive. The median profit of 7.05% sits close to the average, which suggests the gains have not been driven by a single outlier year but by a cluster of solid advances. The strongest net return in the sample came in 2006, when XLE gained 10.01% between the entry and exit dates, while the softest still-delivered year was 2002 with a 2.63% rise.
Year-by-year net, peak run-up, and worst drawdown show how much XLE has typically moved inside the window before settling at the final result.
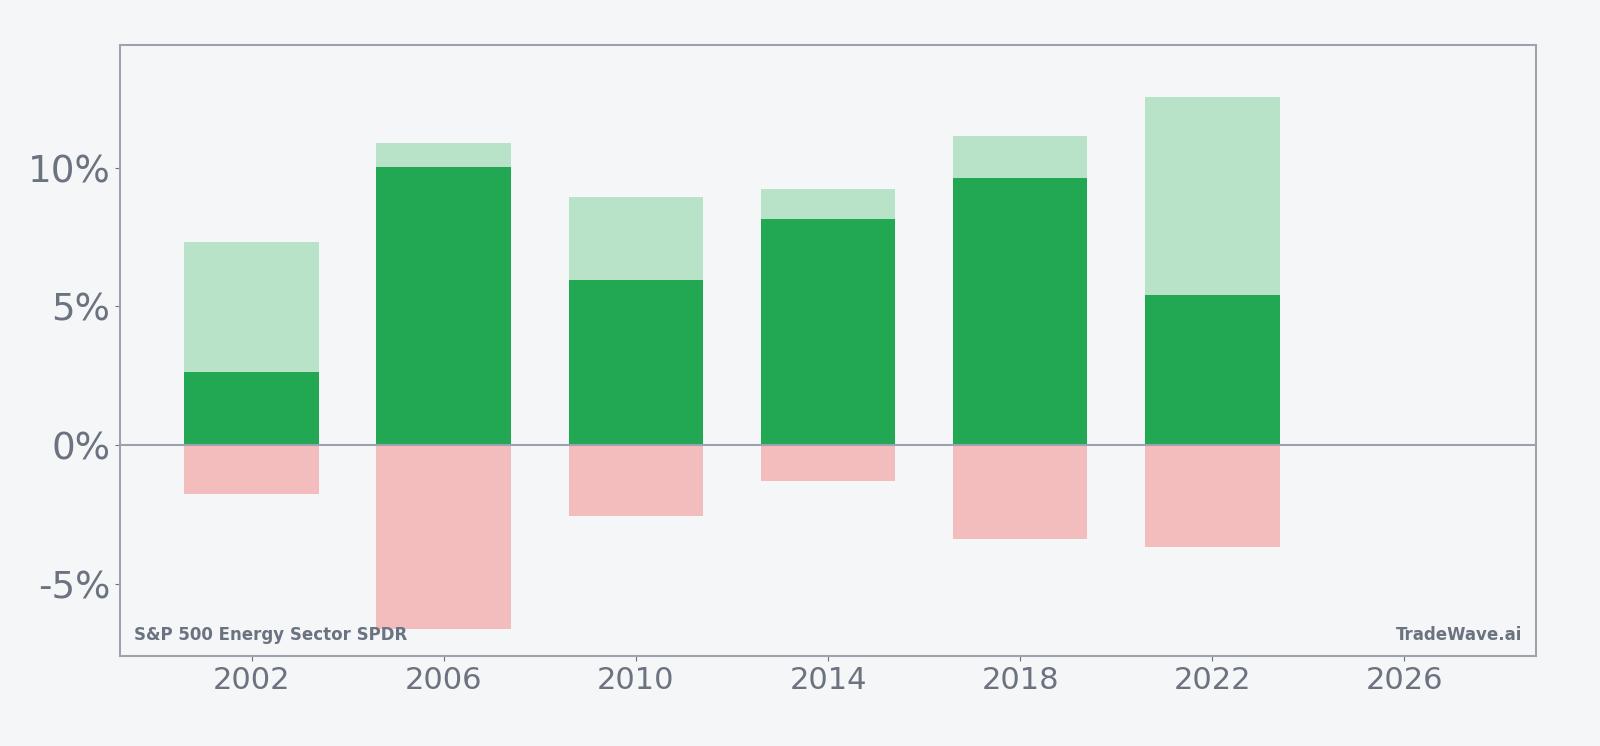
The maximum favorable move inside the window has often exceeded the final net gain, which is what you would expect from a trending but volatile sector ETF. In 2022, for example, XLE’s best intraperiod run-up reached 12.54% even though the final net gain for the window was 5.42%, showing how rallies can overshoot before giving some ground back. On the downside, the worst intraperiod drawdown in the sample came in 2006, when XLE fell as much as 6.61% below the entry level before finishing the window up 10.01%, a reminder that even “all green” windows can feel uncomfortable in real time.
Put together, the pattern is unusually clean for a sector ETF: six for six winning years, a long trade direction, and a Sharpe ratio of 2.23 that points to strong risk-adjusted returns across the sample. The TradeWave Ratio of 5.01 indicates that price has typically traveled meaningfully in the trade direction within the window, which aligns with the sizable maximum favorable excursions seen in several years. The key takeaway is simple: in midterm election years, this specific spring stretch has historically favored long exposure to XLE, even though the path has included sharp swings along the way.
History does not guarantee future results; adverse excursions can be large even in winning windows, and past midterm-year behavior may not repeat in the current cycle.
Price and near-term drivers
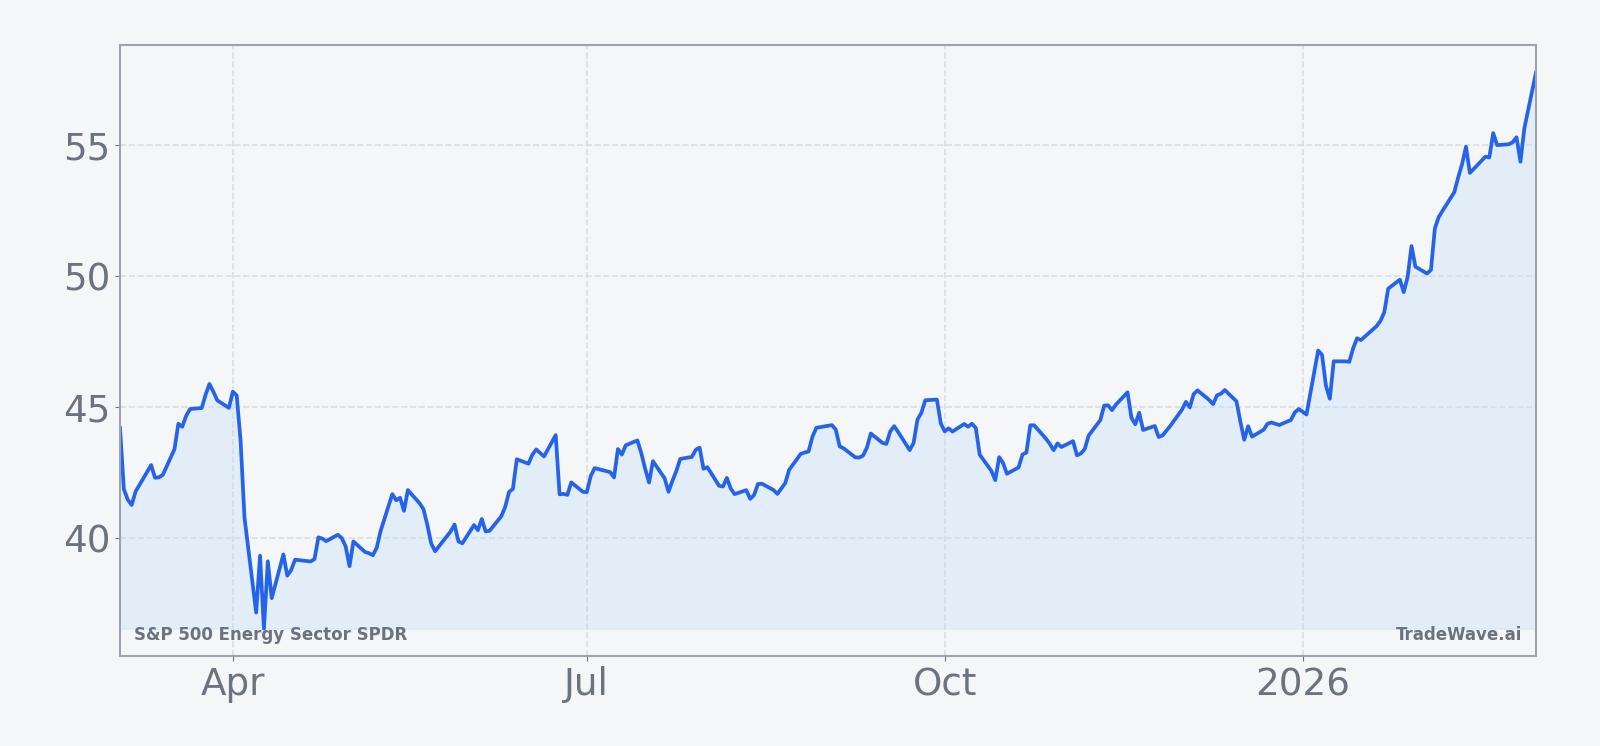
While precise intraday levels were not available, XLE comes into this seasonal window on the back of an 11.73% one-month gain, trading between a 52-week low near 17.71 and a 52-week high of 57.88 with 20-day average volume around 57.6 million shares.[3] That move follows a late-2025 period when options traders were already leaning into a potential energy comeback, using structures such as risk reversals around the 89 level to express upside views on XLE.[2] In early March 2026, retail investors added fuel, net buying more than $14 million of XLE in the first hour of trading after U.S.-Israeli strikes on Iran raised fresh concerns about oil supply disruptions and pushed more money toward energy exposure.[3]
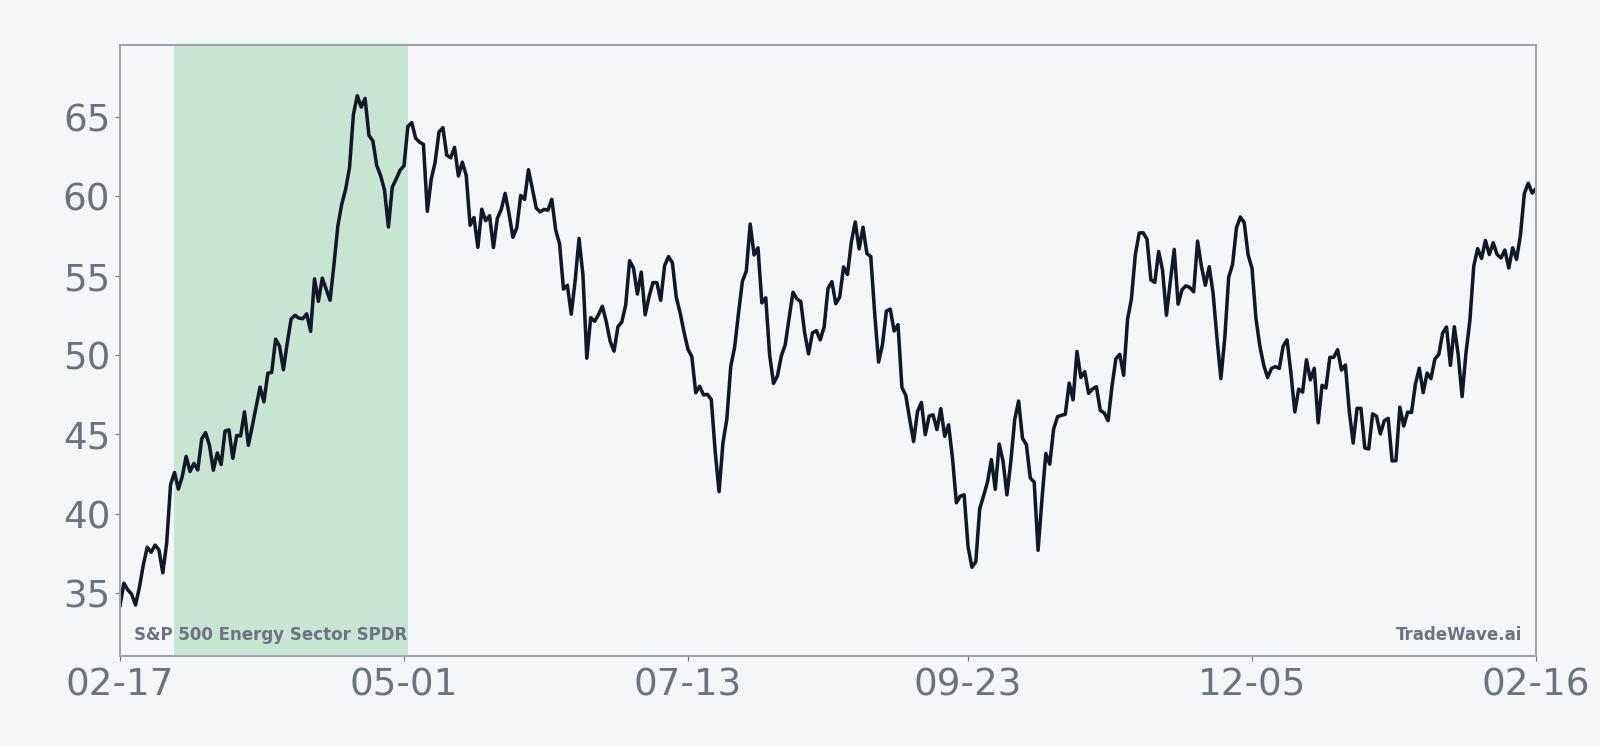
The chart below situates the latest move in its recent multi-month context.
Macro and political backdrop
The current midterm election year adds another layer to the story. Energy policy, drilling approvals, and the use of the Strategic Petroleum Reserve often become bargaining chips in midterm-year politics, which can amplify volatility in sector ETFs like XLE even when the broader market is calm. In late 2025, technicians such as Carter Worth were already flagging the energy sector for a potential upside breakout, arguing that XLE’s relative strength was improving against the broader market.[1] That narrative has since collided with a new round of geopolitical risk, as strikes involving the United States and Israel in Iran have revived worries about supply constraints and pushed investors toward energy as a hedge.[3]
Those cross-currents help explain why both derivatives traders and retail investors have been active in XLE. The options activity around a sector comeback in October 2025 signaled that some investors were willing to pay for upside exposure even before the latest geopolitical shock.[2] The early-March 2026 volume spike from retail buyers shows that the tape is now reflecting those macro concerns in real money flows, not just in commentary.[3] Against that backdrop, a historically bullish seasonal window can act as a tailwind, but it also raises the stakes if the pattern fails to show up this time.
What to watch in this window
For the next two months, the key question is whether XLE behaves anything like its prior six midterm-year spring windows, which all finished in the green with average gains near 7%. Traders will be watching how price reacts on pullbacks of 3% to 6%, a range that has historically marked the worst intraperiod drawdowns before the ETF recovered to end the window higher. A shallow dip followed by renewed strength would rhyme with the historical pattern, while a deeper and persistent break would mark a clear departure.
On the macro side, any escalation or easing in Middle East tensions will matter for this window, as will signals from Washington on drilling policy, export rules, and reserve releases. If geopolitical risk fades but XLE continues to track higher, that would suggest the seasonal and technical forces flagged in late 2025 are doing more of the work than headline-driven fear.[1][3] Conversely, if oil-related headlines stay hot but XLE stalls or reverses, it would hint that a lot of the risk premium is already in the price.
Options and flow data are the other big tell. The earlier use of upside-focused structures around XLE in October 2025 and the more recent retail buying surge in March 2026 created a base of bullish positioning.[2][3] If that positioning keeps building, with continued call buying and strong ETF inflows, it would reinforce the idea that investors are leaning into the historical seasonal edge. If, instead, options activity cools and flows turn flat or negative while the window is still open, it would be a sign that traders are fading the pattern and taking profits into strength.
Seasonality does not trade the market by itself, but it does set expectations. For XLE, the bar is unusually high: six for six winning midterm-year spring windows, a long bias, and a history of sizable intraperiod swings that have so far resolved higher. How the ETF behaves against that backdrop over the coming weeks will tell investors whether this midterm-year cycle is following the old playbook or writing a new one.