Near 52-Week Highs, Nasdaq QQQ Invesco ETF (QQQ) Faces a 66-Day Midterm Tech-Test Window
Nasdaq QQQ Invesco ETF is approaching a 66-day midterm-year stretch that has historically favored downside in tech, just as the ETF trades near its 52-week high.

Key takeaways
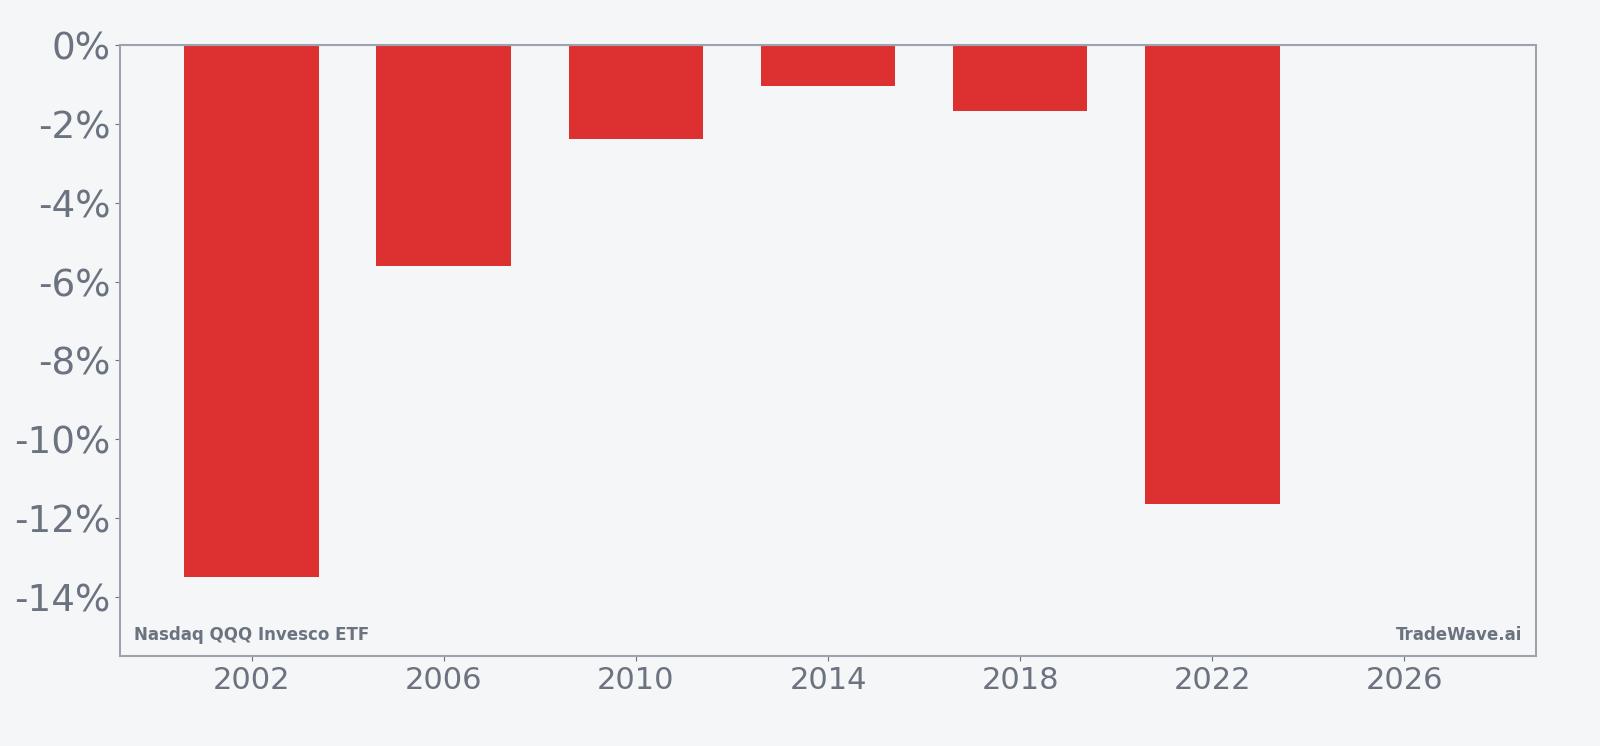
- Nasdaq QQQ Invesco ETF has declined in all six midterm-year spring windows in this study, a 100% hit rate for the short side.
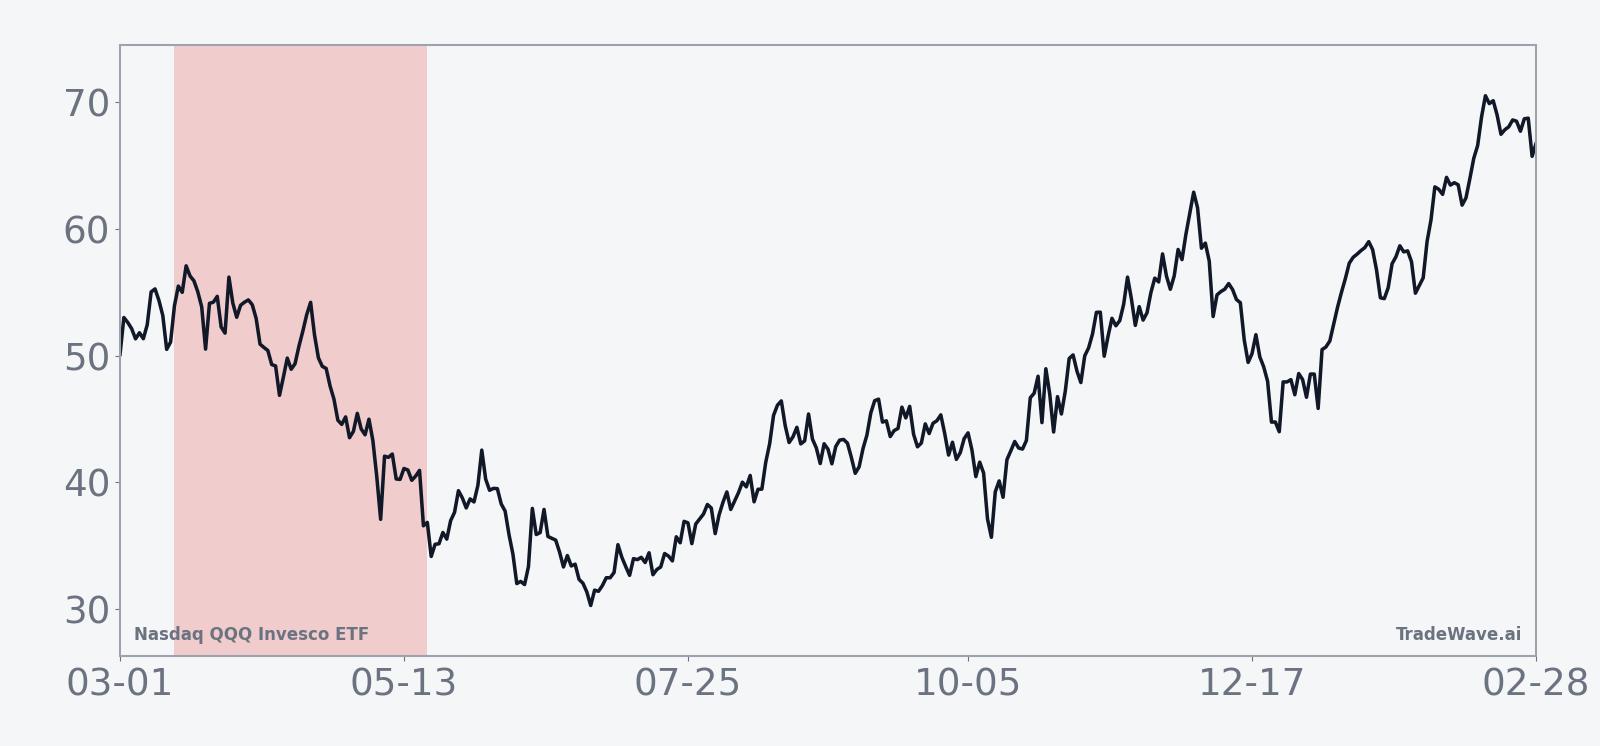
- The upcoming 66-day window begins Mar 15, 2026 and runs through late May, covering the heart of the midterm-year policy and earnings season.
- Average profit for the short pattern is 5.97%, with six winners and zero losers across the last six midterm election years.
- The TradeWave Ratio of 1.83 signals that QQQ has typically moved meaningfully in the trade direction within the window, not just at the close.
- Intraperiod swings have been sharp, with some years showing double-digit peak gains for shorts before sizable countertrend rallies.
- With QQQ trading about 5.8% below its 52-week high, this historically weak midterm window collides with a still-elevated tech tape.
According to historical data from TradeWave.ai, this midterm-year stretch has behaved very differently from a typical spring for QQQ, and the next iteration is about to start.
Seasonal window
Nasdaq QQQ Invesco ETF has produced profitable short trades in all six midterm election years during this 66-day spring window, averaging 5.97% gains for the short side. The next window begins on Mar 15, 2026, with QQQ last trading at 599.75, about 5.8% below its 52-week high of 636.60. That combination of a still-elevated price and a clean six-for-six record of downside in this phase makes the upcoming stretch one of the more notable calendar tests for tech leadership in the current cycle.
The presidential election cycle matters here because this pattern only looks at the last six midterm election years, a phase that often brings tighter policy talk, regulatory noise around big tech and more selective liquidity. Grouping by midterm years strips out the stronger pre-election and election-year rallies and focuses on how QQQ behaves when Washington is debating budgets and oversight rather than cutting taxes or launching new stimulus.
Across those six midterm years, the short pattern has been clean. Percent Profitable is 100%, with six winners and zero losers, and the average profit for the short side clocks in at 5.97%. The median outcome is a 4.0% gain for shorts, which means even the middle-of-the-pack years have delivered meaningful downside for QQQ within this window.
The per-year table shows how that plays out in practice. In 2002, QQQ fell 13.48% from entry to exit during the window, the strongest year for the short side in this sample. In 2022, the ETF dropped 11.64% over the same calendar slice, again rewarding shorts even as the broader cycle was dominated by debates over inflation, rates and tech valuations. The “softest” year for the pattern was 2014, when QQQ still slipped 1.04% over the window.
Volatility inside the window has been real. Maximum favorable excursion, or MFE, is the best point-to-peak move in the trade direction during the window, and several years show high single-digit or low double-digit MFE for shorts before the final close. Maximum adverse excursion, or MAE, is the worst drawdown from entry, and in 2002 QQQ rallied as much as 1.91% against shorts before sliding, while in 2010 it pushed 7.33% higher at one point even though the final result still favored the short side.
The TradeWave Ratio of 1.83 captures how far QQQ has typically traveled in the trade direction within the window, independent of where it finished. A ratio above 1 suggests that intraperiod moves have been larger than the final net change, which fits a pattern where shorts have often seen sizable open profits and then had to sit through countertrend rallies before the window closed.
Trend counts inside the window also lean toward persistent downside. The pattern logs 33 days where the short trend dominates versus 6 days where the long side has the upper hand, with a similar skew in the shorter-term trend measures. That points to a tape that has tended to grind lower more often than not during this midterm-year slice, even if some days deliver sharp squeezes.
Yearly net and peak moves highlight how often shorts have seen both sizable gains and meaningful countertrend rallies inside the window.
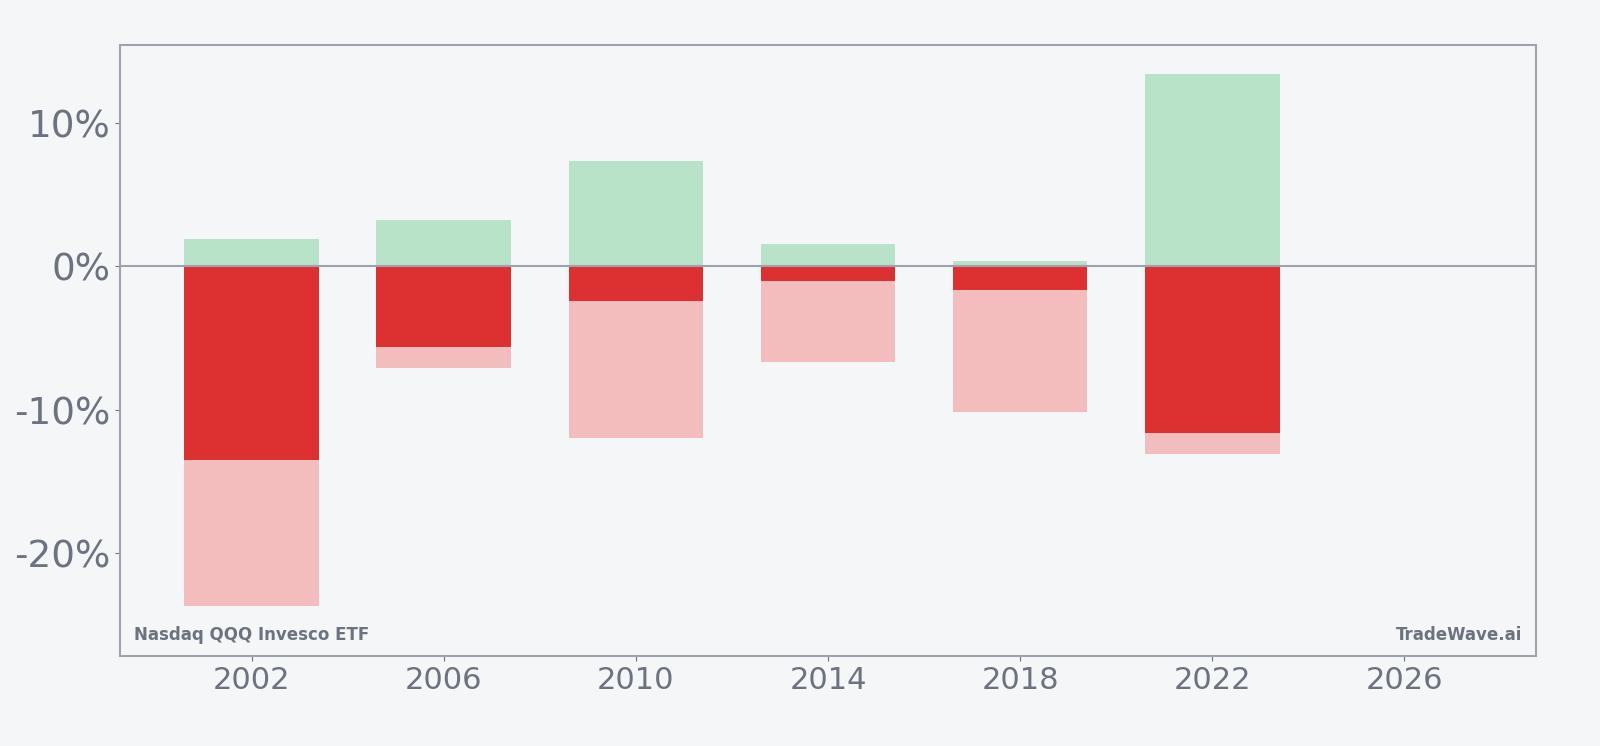
History does not guarantee future results; adverse excursions can be large even in winning windows, and shorts have repeatedly faced sharp rallies before the pattern played out.
Price and near-term drivers
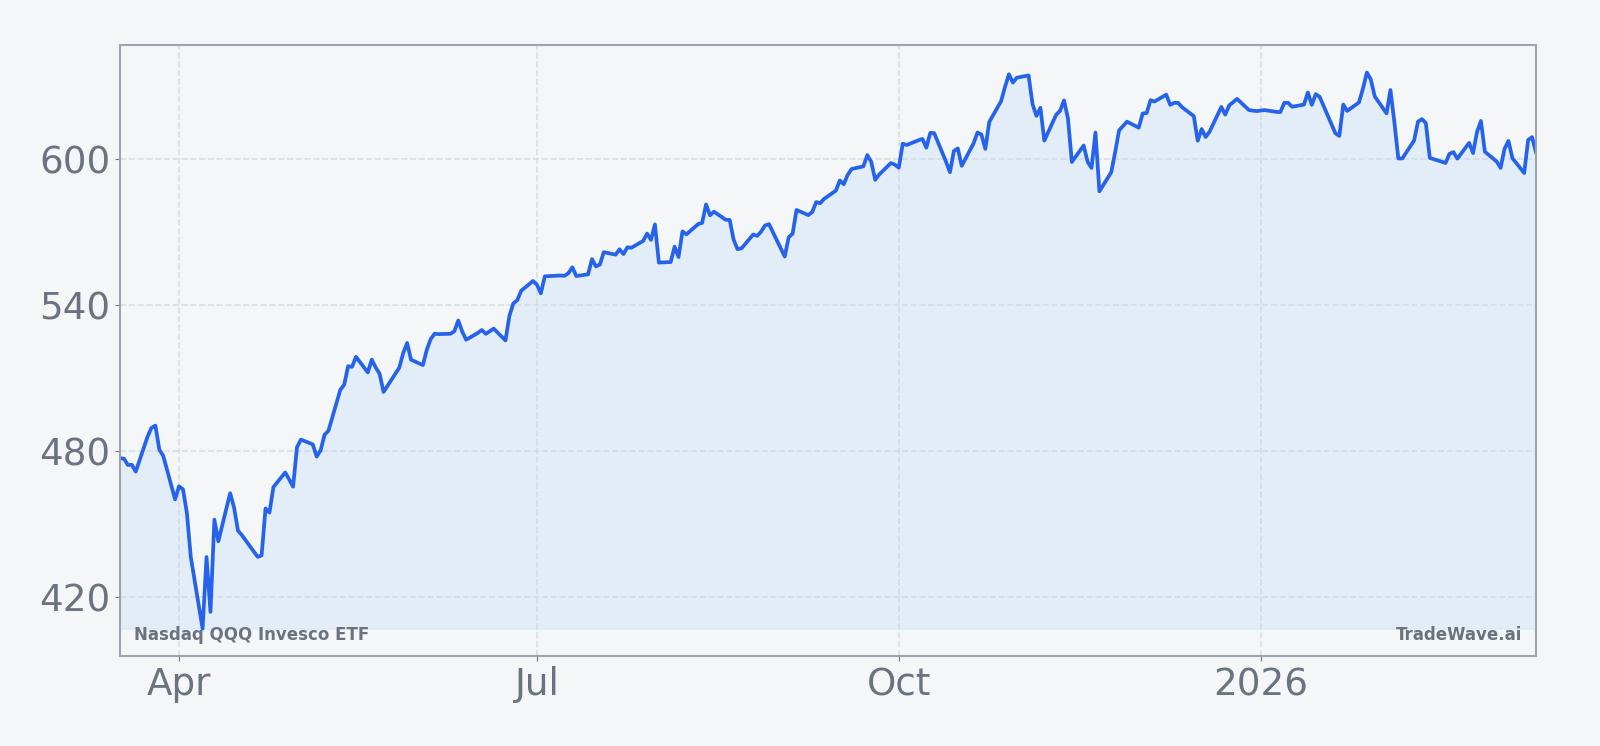
QQQ finished the latest session at 599.75, down 1.5% on the day, and about 5.8% below its 52-week high of 636.60. The ETF has slipped 2.59% over the past month, a modest pullback after a powerful run that saw it tag a 52-week low near 399.53 and then surge to a high above 636, with 20-day average volume running around 72.7 million shares.
In October, QQQ was the top performer among major U.S. benchmarks, rising 4.8% and briefly exceeding a yearly R2 resistance level at 623.76 with a high of 637.01, while support emerged near 589.05 and the Nasdaq 100 advance/decline line confirmed the move higher.[1] That episode underlined how quickly flows can rotate back into mega-cap tech when growth and liquidity narratives line up, even late in a long rally.
Those dynamics matter heading into the midterm-year window. QQQ is a proxy for the market’s appetite for high-duration growth and AI-heavy balance sheets, and its swings often set the tone for broader risk sentiment. A historically weak seasonal stretch for QQQ that starts with the ETF still close to its highs is a different setup from a pattern that begins after a deep correction.
The chart below situates the latest move in its recent multi-month context.
Macro and election-cycle backdrop
The calendar phase for this pattern is the midterm election year, while the broader presidential cycle is transitioning toward the pre-election year that often favors risk assets. Historically, midterm years have been split personalities for equities: choppy and policy-driven in the first half, then stronger once the political path clears and the long midterm-to-pre-election “100-Year Pattern” window kicks in.
This 66-day QQQ window sits in that earlier, more fragile part of the year. Budget fights, regulatory hearings and shifting expectations for central bank policy can all hit the growth and valuation assumptions that underpin the Nasdaq 100. When those macro debates flare while QQQ is priced for perfection, the historical record shows that the ETF has often leaked lower, even if the longer-term bull trend stayed intact.
For tech investors, that creates a two-playbook year. The first playbook covers this midterm spring stretch, where QQQ has tended to struggle and intraperiod drawdowns have been larger. The second playbook looks ahead to the stronger midterm-to-pre-election regime, where history has been kinder to long exposure. Knowing which playbook the market is trading from can help frame whether a pullback feels like a threat to the cycle or a reset inside a bigger uptrend.
What to watch as the window opens
As the Mar 15 start date approaches, the first thing to watch is how QQQ behaves around the 600 level and the 50-day moving average near 613.85. A quick reclaim of the recent highs would echo the October pattern of aggressive dip-buying, while a failure to bounce could signal that the seasonal midterm headwind is starting to bite.
Second, monitor how macro headlines intersect with tech. Midterm years often bring louder debates over regulation, antitrust and digital policy, and any renewed scrutiny of mega-cap platforms can weigh on QQQ even when earnings remain solid. If those stories cluster inside the 66-day window, they would rhyme with prior cycles where policy noise amplified seasonal weakness.
Third, watch breadth inside the Nasdaq 100. In October, the advance/decline line confirmed QQQ’s breakout, suggesting broad participation rather than a narrow mega-cap squeeze.[1] If the seasonal window opens with QQQ under pressure but breadth holding up, that would look more like a rotation than a full-blown risk-off move. If both price and breadth roll over together, it would be closer to the historical pattern of sustained downside for the short side.
Finally, treat intraperiod swings with respect. Past midterm windows have delivered sizable maximum favorable and adverse excursions for shorts, meaning both sharp drops and violent rallies have been common. Behavior inside this window that matches that profile would reinforce the idea that seasonality is in play, while a quiet, low-volatility drift would mark a clear break from the last six cycles.