After a 25% Surge Off August Lows, S&P 500 Healthcare Sector SPDR (XLV) Runs Into a 49-Day Midterm Test
S&P 500 Healthcare Sector SPDR is heading into a 49-day midterm-year stretch that has delivered consistent downside in past cycles, just as the sector digests a powerful rally off its August lows.

Key takeaways
- A 49-day seasonal window for S&P 500 Healthcare Sector SPDR (XLV) begins on Mar 18 and targets short exposure in midterm election years.
- Across the last 6 midterm election years, XLV has moved lower in this window every time, with 100% Percent Profitable for the short setup, 6 winners and 0 losers.
- The average profit for winning short trades has been 3.9%, with a cumulative return of 25% across those six cycles.
- The TradeWave Ratio of 4.66 signals that price has typically traveled meaningfully in the trade direction within the window, even beyond the final close.
- Intraperiod swings have been uncomfortable at times, with maximum adverse moves against the short reaching between roughly 4% and 7% in individual years.
- The pattern sits in the early part of the midterm election year, a phase that often brings policy noise and choppy trading for defensive sectors like healthcare.
According to historical data from TradeWave.ai, this upcoming stretch for XLV behaves very differently from an average spring. The next section walks through how that pattern has played out across prior midterm election years.
Seasonal window
S&P 500 Healthcare Sector SPDR has posted short-side gains in all 6 midterm election years during this 49-day window, averaging 3.9% profits for the short setup. The next iteration begins on Mar 18 and runs through early May, landing squarely in the early midterm election year when policy debates and regulatory noise often dominate the healthcare tape. That combination of a clean six-for-six record and a defined election-cycle backdrop makes this one of the more striking seasonal patterns on the healthcare calendar.
The presidential election cycle matters here because the pattern is built only from midterm election years, a phase that often brings tighter rhetoric on drug pricing, reimbursement and entitlement spending. Grouping by this cycle strips out noise from other years and focuses on how healthcare has behaved when Washington is in midterm mode, which is when legislative risk tends to spike even if actual laws move slowly.
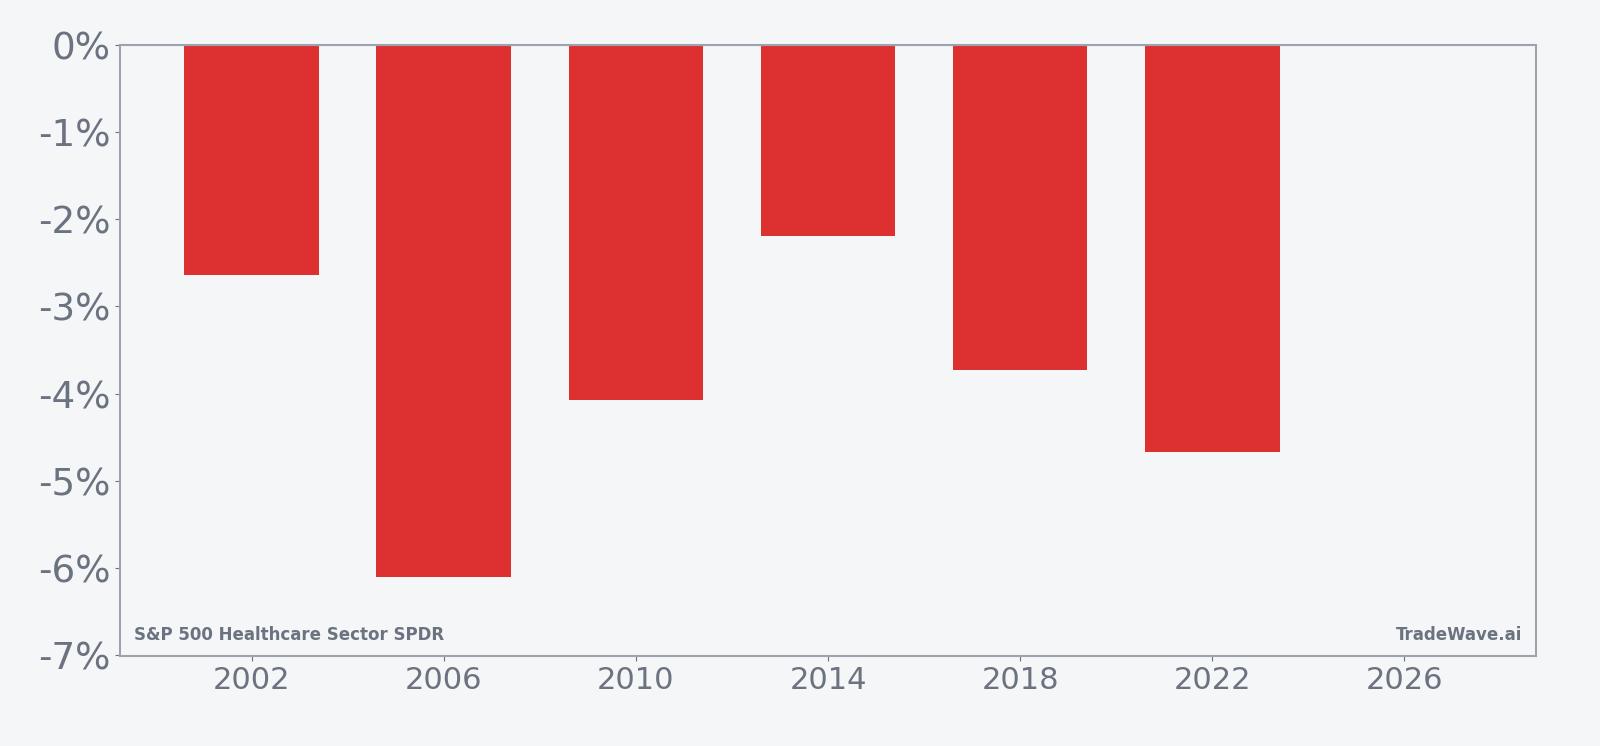
Across the six midterm years in the sample, the trade direction is explicitly short. In every case, XLV finished the 49-day window below its entry level, with net returns ranging from about 2.2% to 6.1% in favor of the short. The average profit of 3.9% reflects those consistent declines, while the Sharpe ratio of 2.39 shows that the end-of-window outcomes have been unusually stable for a directional pattern.
The per-year table shows 2006 as the strongest year for the short, with XLV dropping 6.1% from entry to exit, and 2014 as the mildest, with a 2.19% decline. In 2022, the ETF fell 4.67% over the window, but also printed the largest intraperiod rally against the short, with a maximum favorable move for longs of 5.02% before rolling over. That mix of steady net losses and sometimes sharp countertrend pops is what gives this window its distinct character.
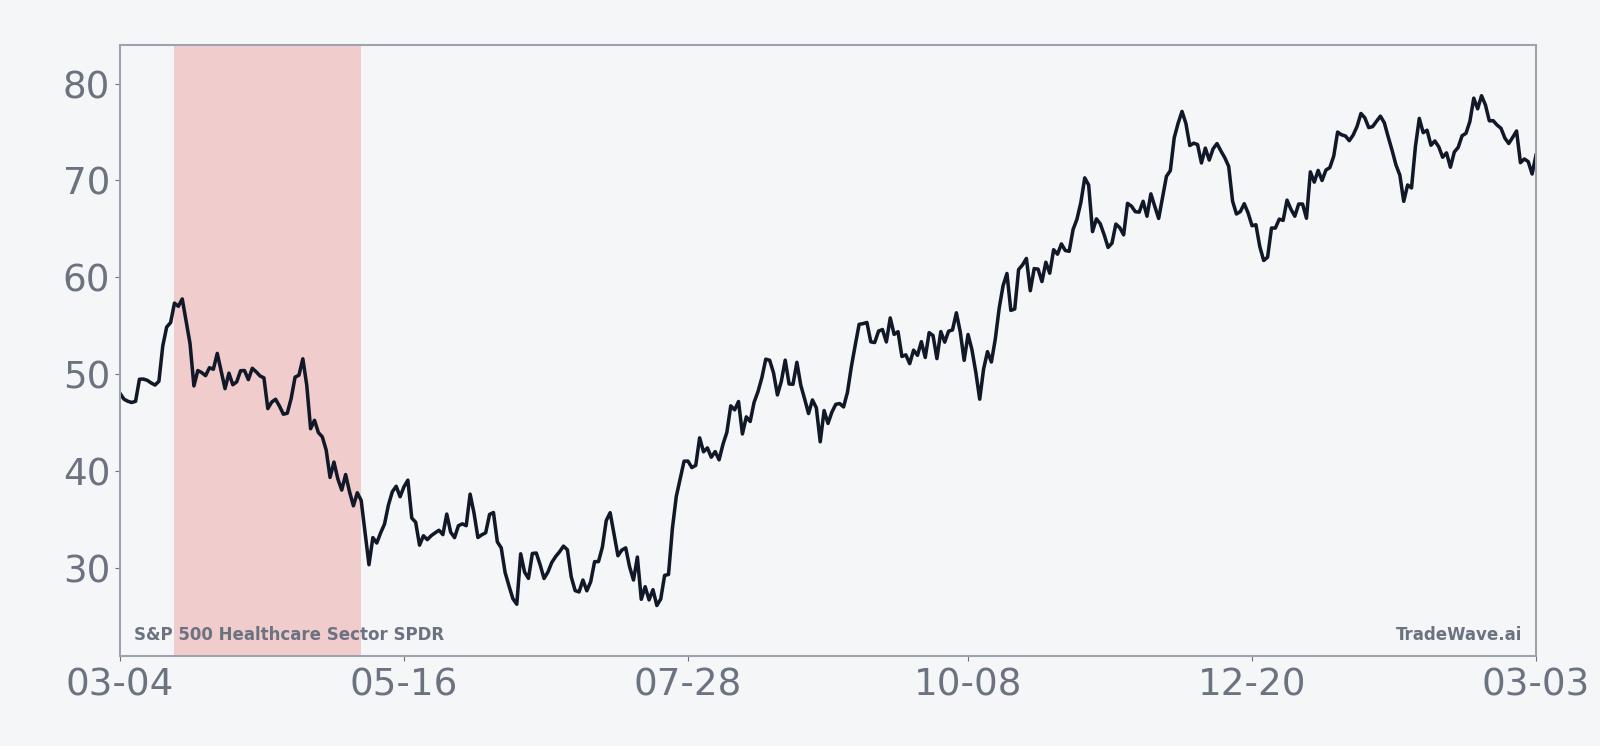
The historical seasonal trend line slopes lower for most of the window, with the bulk of the short-side gains accruing gradually rather than in a single air pocket. The pattern tends to show early choppiness, then a more persistent drift lower into the back half of the 49 days, which fits the idea of policy headlines wearing on sentiment rather than a one-off shock.
A combined view of yearly net returns and intraperiod swings shows how much XLV has typically moved in both directions before the window closes.
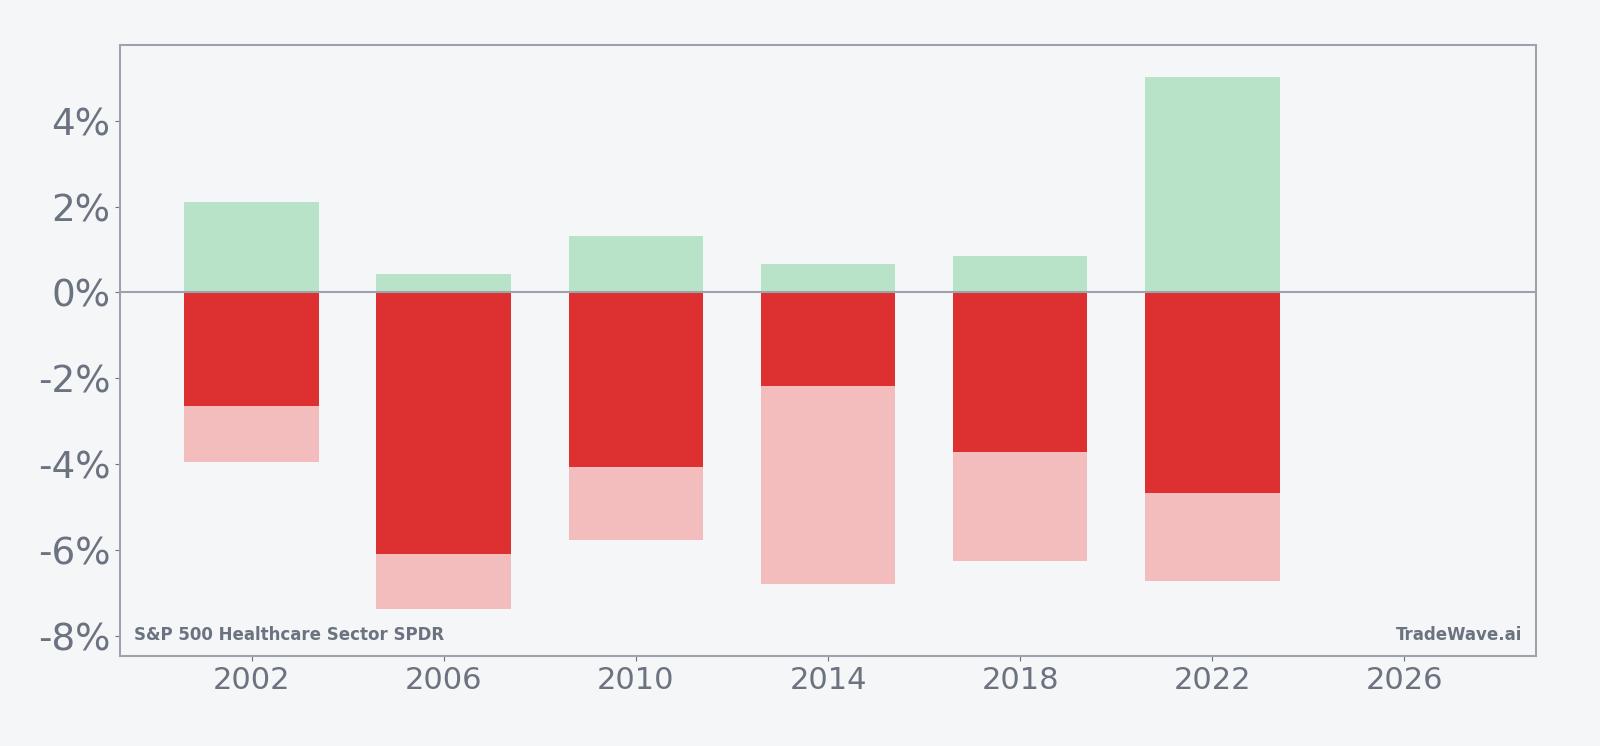
The stacked bar profile shows that while net outcomes have favored the short every time, maximum adverse moves against the trade have often run between roughly 4% and 7%, especially in 2006, 2014, 2018 and 2022. Maximum favorable excursions in the trade direction have also been meaningful, which is reflected in the TradeWave Ratio of 4.66 and signals that when this window moves, it tends to move with some force rather than grinding sideways.
History does not guarantee future results; adverse excursions can be large even in winning windows, and past midterm-year behavior may not repeat in the next cycle.
Price and near-term drivers
XLV comes into this midterm-year setup after a powerful run from its August low, when healthcare stocks led gains in the S&P 500 and the ETF surged roughly 25% on the back of sector strength and a broader market rally.[1] That move unfolded as U.S. stocks swung around shifting expectations for interest rates, with yields tumbling after softer jobs data and defensive groups like healthcare catching a bid.[1] Sector headlines have also been dominated by renewed focus on drug pricing, including political pressure on big pharma and attention on high-profile names such as Novo Nordisk, which has kept regulation and reimbursement risk in the foreground for investors.[1]
The chart below situates the latest move in its recent multi-month context.
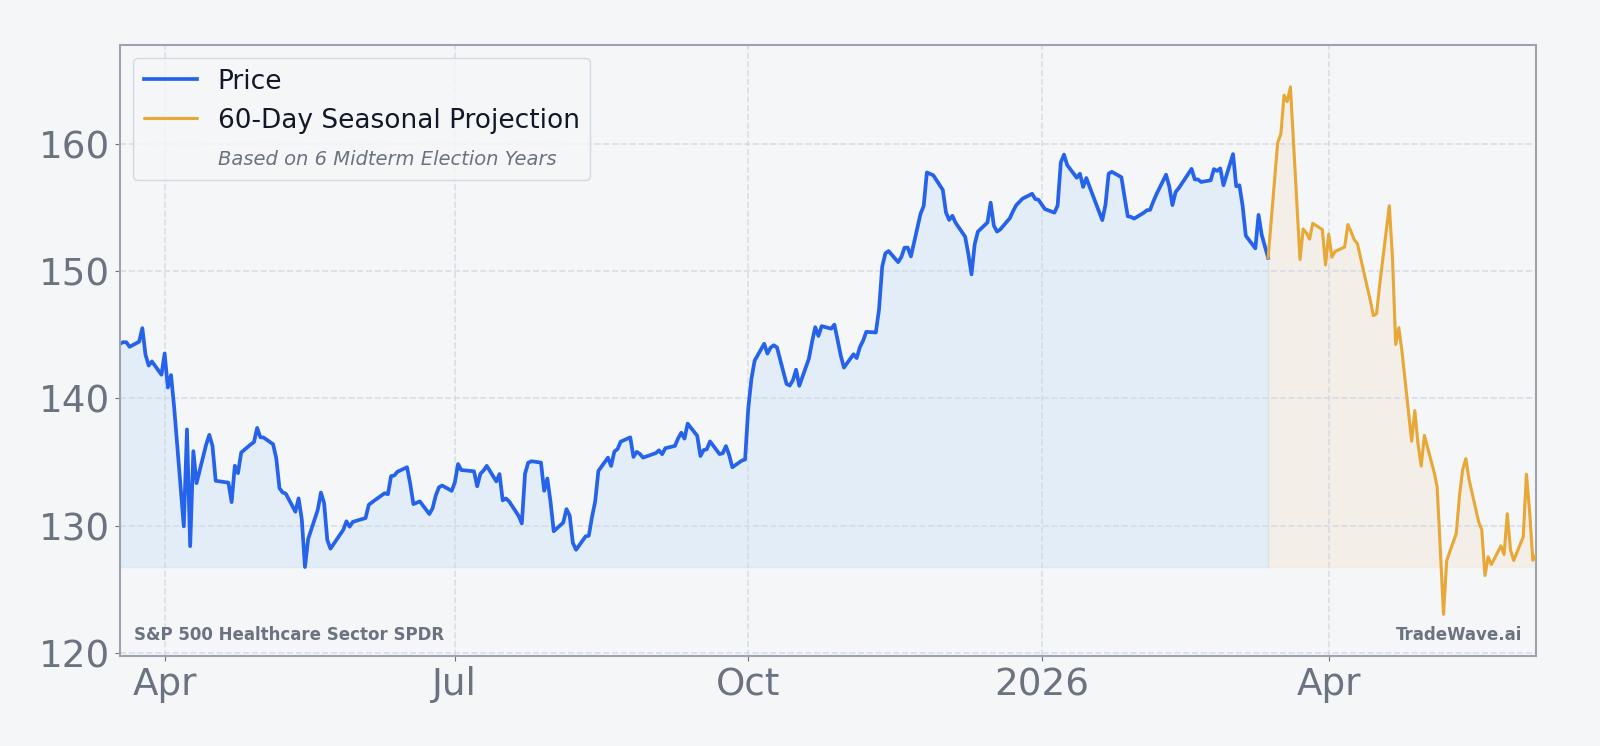
The macro backdrop heading into this window is a tug-of-war between rate expectations and policy risk. On one side, cooling inflation and bouts of weaker data have periodically pulled Treasury yields lower, which tends to support defensive, dividend-paying sectors like healthcare.[1] On the other, the midterm election year often brings louder debate over Medicare spending, drug costs and coverage rules, themes that can cap multiples even when earnings hold up.
For XLV, that means the upcoming 49-day stretch is less about a single binary catalyst and more about how the sector trades as Washington rhetoric heats up. Historically, early midterm months have been the choppier half of the cycle for many risk assets, with investors reluctant to pay up for policy-sensitive groups until the legislative picture clears. The fact that healthcare has already banked a sizable rally from last summer’s lows only sharpens the contrast with a seasonal window that has, so far, leaned consistently in favor of short exposure.
What to watch as the window opens
As Mar 18 approaches, the first thing to watch is how XLV behaves around recent support and resistance levels carved out during the post-August rally. A quick rejection from recent highs or a failure to make new ground as the window begins would be more in line with the historical pattern, while a clean breakout and sustained strength would mark a clear departure from prior midterm years.
Second, keep an eye on the policy calendar. Hearings, budget negotiations and any renewed push on drug pricing or entitlement reform can all feed into the defensive tone that has historically weighed on healthcare during this phase. Even when legislation does not move, headline risk alone has been enough in past cycles to sap momentum from the group.
Third, monitor volatility inside the window, not just where XLV finishes. Prior midterm years have seen intraperiod rallies of several percent against the short before the ETF rolled over again, which means sharp squeezes have been part of the playbook rather than an exception. If this year’s window features similar spikes that fade rather than stick, it would echo the historical pattern of choppy downside drift. If, instead, pullbacks are shallow and buyers step in quickly, that would signal a regime shift away from the six-for-six record that has defined this stretch so far.
Finally, watch how healthcare trades relative to the broader S&P 500. In earlier cycles, XLV’s weakness in this window has sometimes contrasted with more resilient index performance, reflecting sector-specific policy pressure rather than a full-blown risk-off move. If the ETF underperforms again while the index holds up, it would fit the historical script. If healthcare leads on the upside through the heart of the window, it would be a strong sign that this midterm election year is breaking from the usual seasonal pattern.