Dow Jones Industrial Average (DJI) Has Rallied in 10 Straight 264-Day Seasonal Windows
Dow Jones Industrial Average is about 7.6% below its record high as a historically powerful 264-day seasonal window opens, putting fresh focus on breadth and sector rotation through early 2027.
Key takeaways
- Dow Jones Industrial Average has posted gains in this 264-day window in 10 of the past 10 years, with a long trade direction.
- The window begins on Mar 13 and runs roughly through early December, with an average profit of 11.96% across those years.
- Percent Profitable is 100%, with 10 winners and 0 losers, and a cumulative return of 202% over the decade.
- Intraperiod swings have been meaningful: the worst year saw a drawdown of 21.44% from entry before finishing higher.
- The TradeWave Ratio of 1.71 and a Sharpe ratio of 1.17 point to strong upside travel relative to risk in prior cycles.
- DJI is currently about 7.6% below its 52-week high, so the new window opens with the index off peak levels but still elevated.
According to historical data from TradeWave.ai, this stretch of the calendar has behaved very differently from an average year for the Dow. The next section looks at how that pattern has played out across the past decade and what it implies for the new window.
Seasonal window
Dow Jones Industrial Average has risen in 10 of 10 years during this 264-day window, averaging 11.96% gains for a long stance. The latest iteration begins with the index at 46,677.85, down 1.6% on the day and about 7.6% below its 52-week high of 50,512.79.[4]
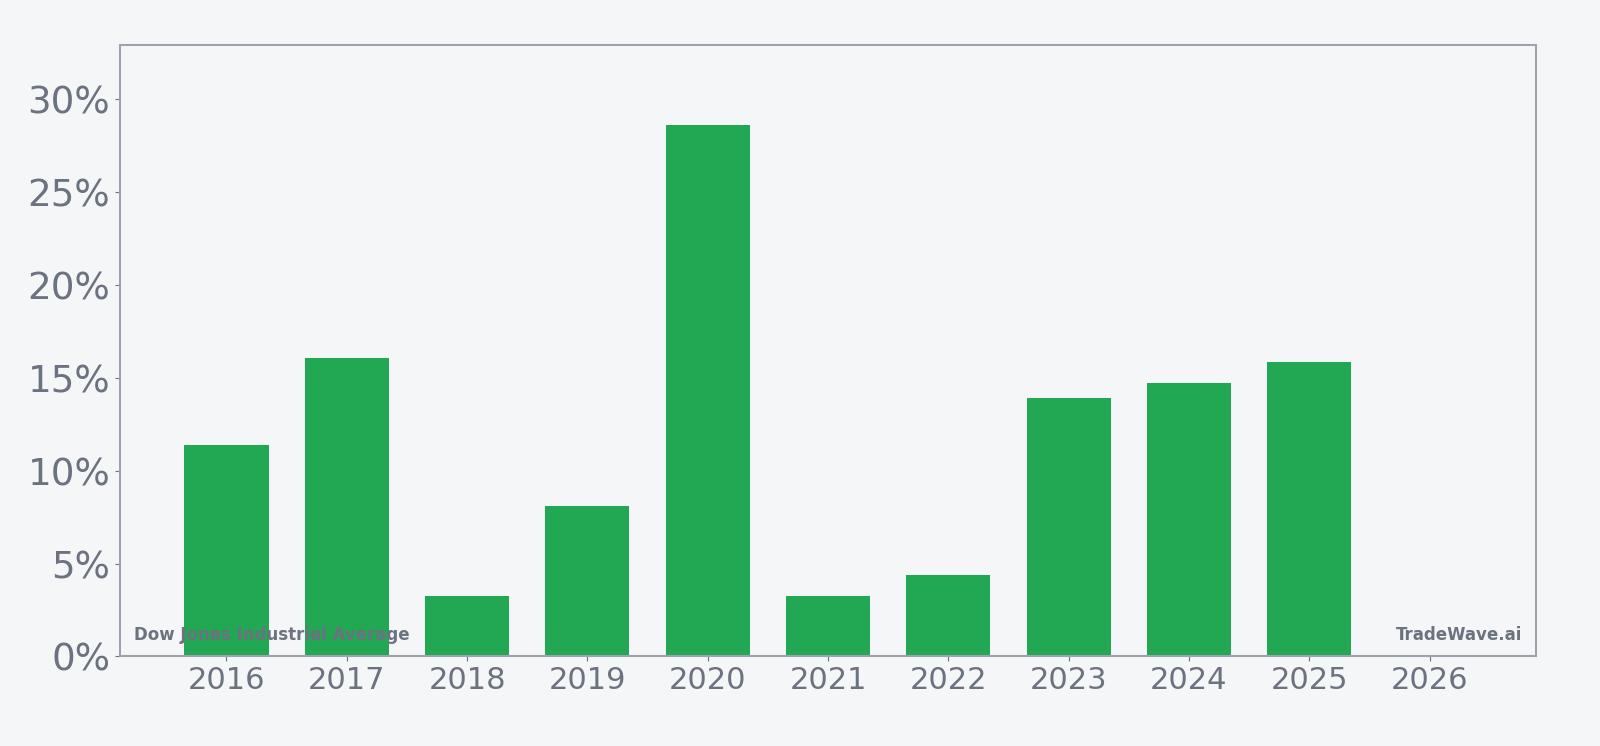
Historically this has been a long-biased regime for the Dow, with a cumulative 202% gain across the 10-year sample and a median profit of 12.65%. The strongest year in the set was 2020, when the index finished the window up 28.63% from its Mar 13 entry, while the softest outcome was 2018 with a still-positive 3.28% gain.
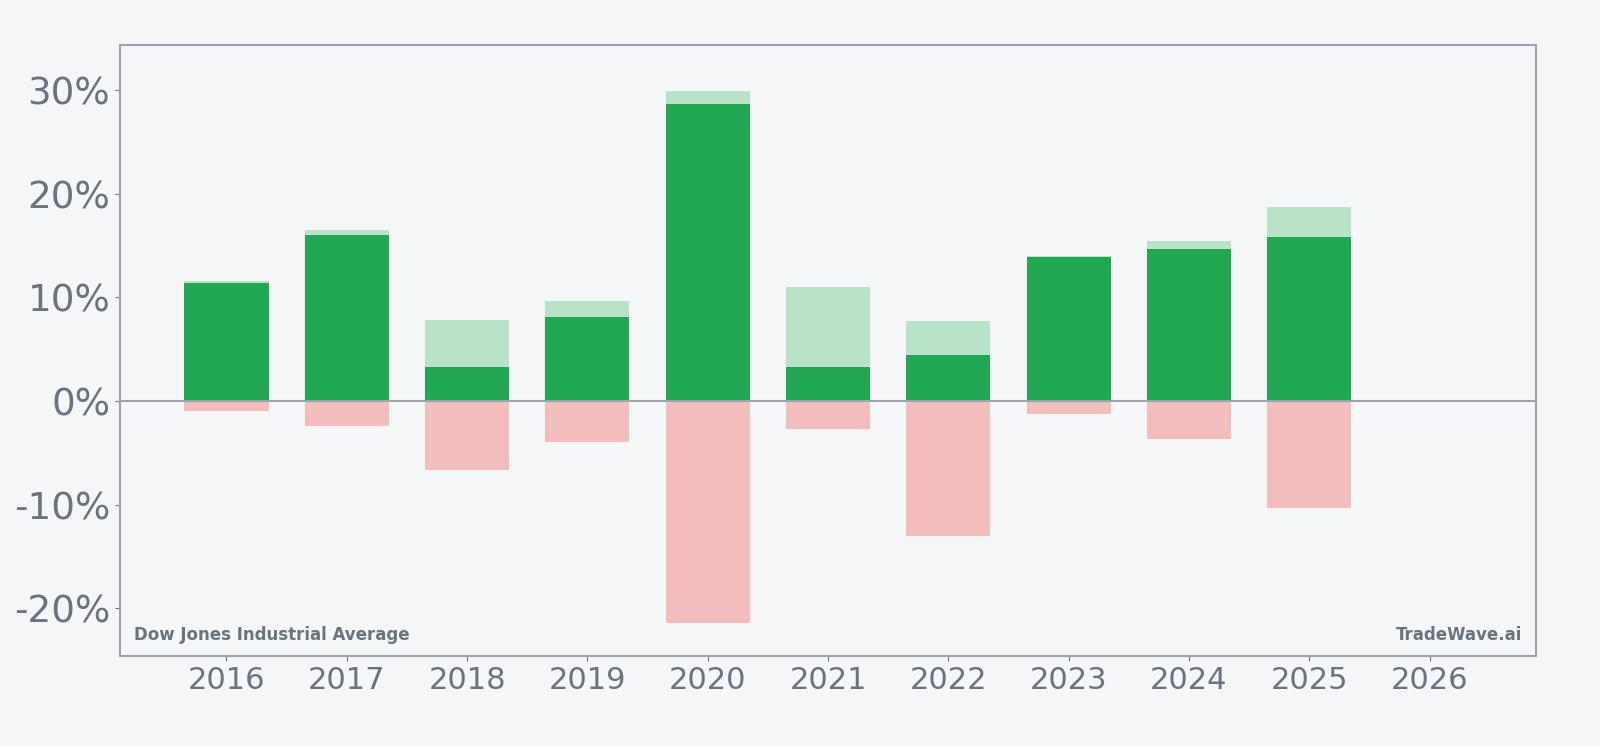
The intraperiod path has not been smooth. In 2020 the Dow suffered a maximum adverse move of 21.44% from the entry level before recovering to finish the window near its 29.89% maximum favorable excursion. In 2022 the index ultimately gained 4.4% across the window, but at one point it was down 13.0% from the starting level, underscoring how deep drawdowns can coexist with positive final outcomes.
On the upside, several years show the index spending much of the window near its best levels. In 2017 the Dow’s maximum favorable move reached 16.5%, and it closed the window with a 16.04% gain, a pattern echoed in 2023 and 2024 where net returns of 13.91% and 14.7% sat just below their respective peak run-ups. That behavior fits a profile where rallies tend to build and then consolidate rather than fully reverse.
The 10-year average seasonal trend suggests gains tend to build gradually rather than in a single burst. The typical pattern shows early choppiness, followed by a steadier climb through the middle of the window and a modest flattening toward the end, consistent with the idea that late-year consolidation often follows strong mid-year advances.
A combined view of yearly net returns and intraperiod swings shows how upside and downside have interacted in this window.
History does not guarantee future results; adverse excursions can be large even in winning windows, so traders should treat this pattern as context rather than a forecast.
Add it up: 10 for 10 winning years, double-digit average gains, and a track record of sharp but ultimately contained drawdowns make this one of the more striking long-biased seasonal regimes on the Dow’s calendar.
Price and near-term drivers
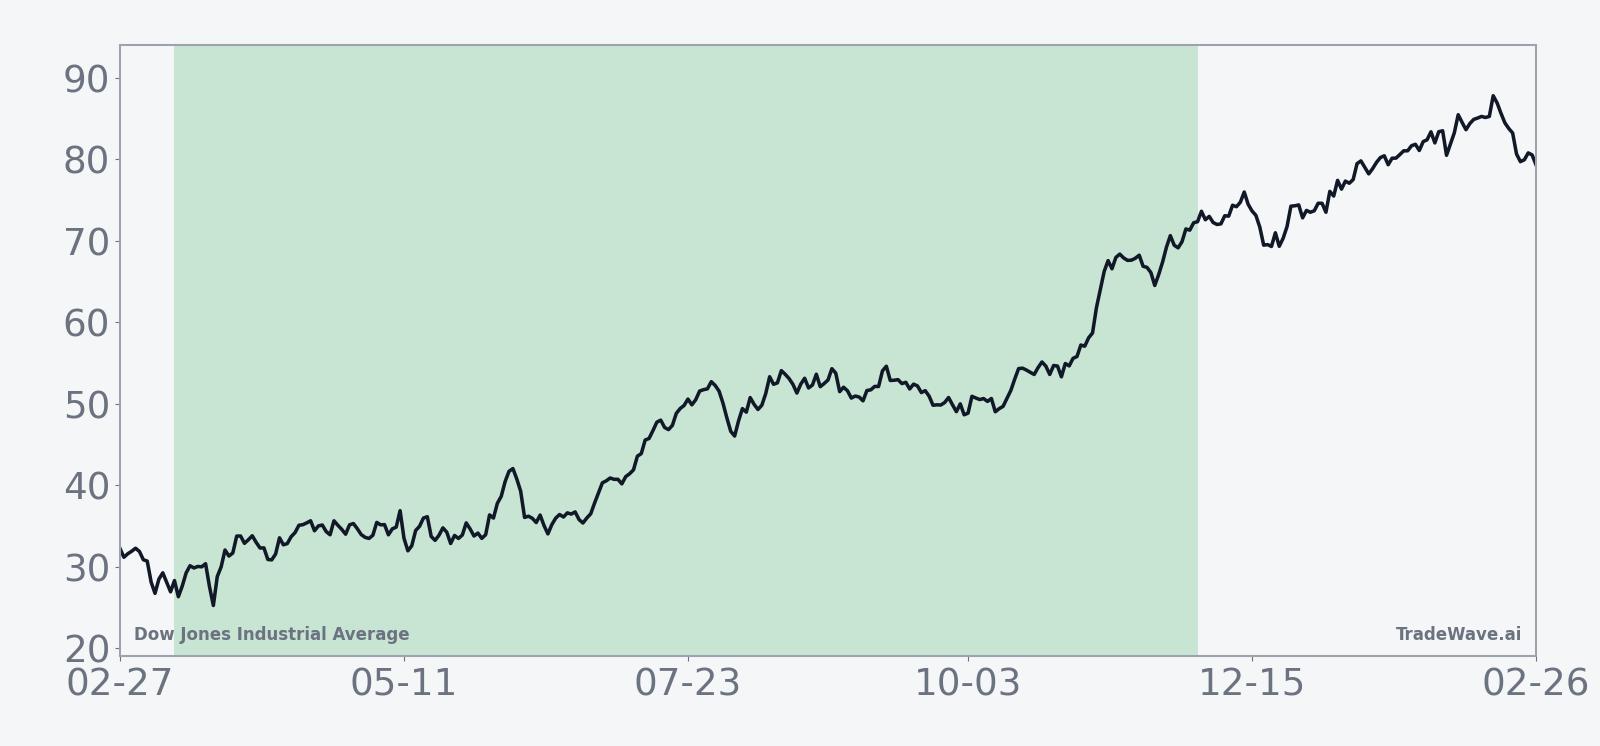
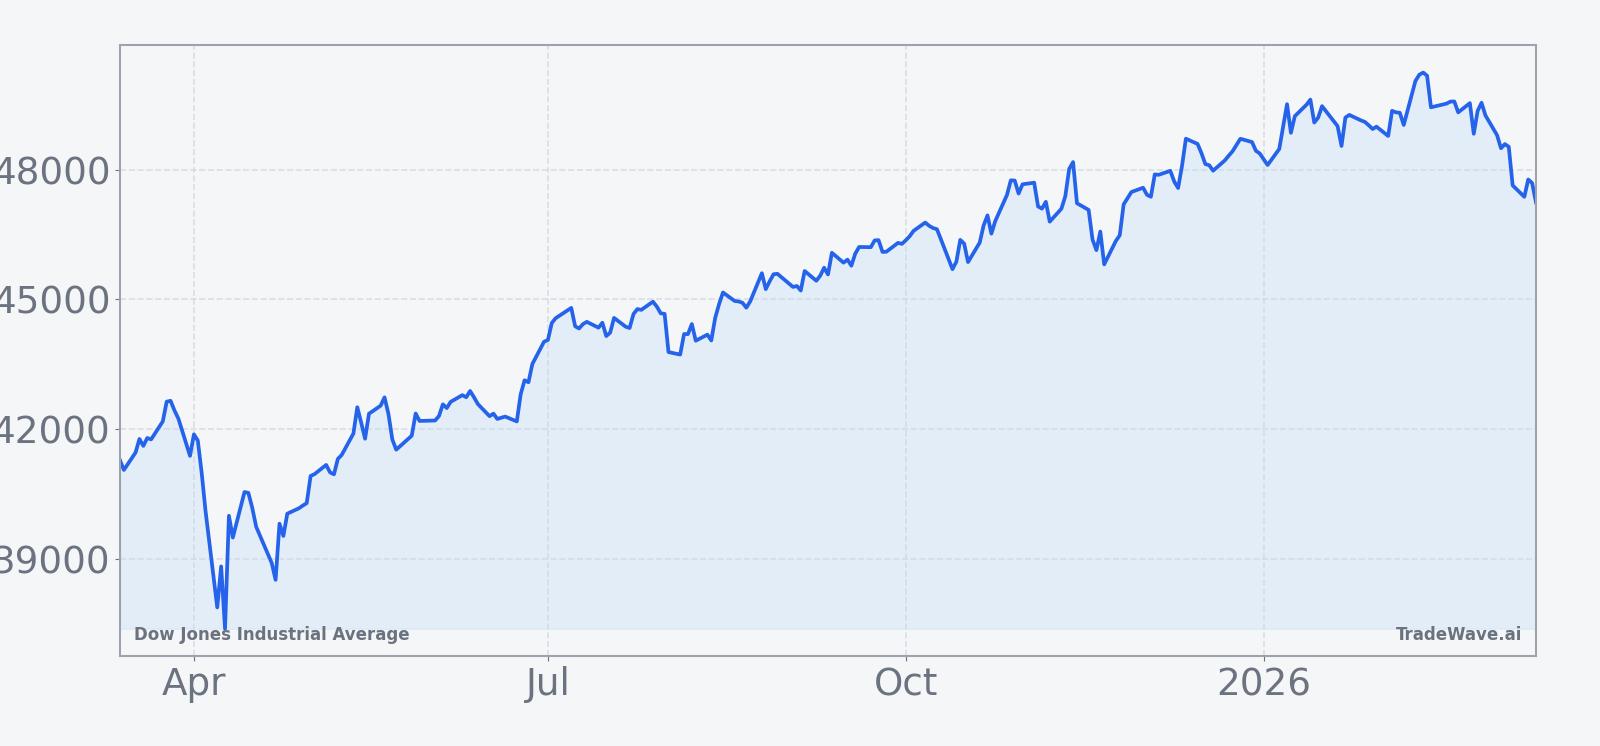
Dow Jones Industrial Average closed Friday at 46,677.85, down 739 points or 1.6% on the session, extending a roughly 6.87% slide over the past month and leaving the index about 7.6% below its 52-week high of 50,512.79.[4] The pullback comes after a stretch of record-setting levels, including a record close on Jan 5, 2026, when the Dow finished at a new high as investors continued to rotate away from the most crowded technology winners.[7]
That rotation theme has been building for months. In Nov 2025 the Dow logged a “banner day” as investors pivoted beyond the S&P 500’s top winners and into more traditional industrial, healthcare and consumer names that dominate the price-weighted index.[4] In Dec 2025 the Dow again outperformed during a holiday-shortened week, helped by broad gains across sectors rather than a narrow tech surge.[5] At the same time, the index has remained sensitive to single-stock moves in heavyweight components, as seen in Dec 2025 when a slide in JPMorgan’s stock weighed on the Dow even as the broader market tone stayed constructive.[6]
Earlier in the cycle, sentiment around the rally was more fragile. In Mar 2025, skepticism from firms such as Cantor Fitzgerald about the durability of Wall Street’s advance fed into bouts of volatility across major indices, including the Dow.[3] By late Sep 2025, renewed worries about technology stocks and the path of interest-rate cuts had triggered another round of selling, with the Dow caught in the crosscurrents between growth-sensitive tech and more defensive sectors.[1] Through that period, the index often benefited when investors sought shelter from high-multiple tech names, but it also struggled when macro concerns hit banks and cyclicals at the same time.
The chart below situates the latest move in its recent multi-month context.
Under the surface, sector leadership has been broadening compared with the tech-led surges of earlier years. Reports through late 2025 pointed to investors shifting toward healthcare, consumer and financial names, which tend to have heavier representation in the Dow than in growth-focused benchmarks.[4] Episodes like the Dec 2025 JPMorgan-driven dip also underline how financials can swing the index, especially when macro narratives around rates and credit quality are in flux.[6]
Macro headlines have reinforced that push and pull. In Aug 2025, retail earnings and Federal Reserve minutes combined to knock major averages lower as traders reassessed the timing and depth of potential rate cuts.[2] By early 2026, the story had shifted toward how far the rally had already run and whether the Dow’s record levels could be justified against a backdrop of moderating growth and still-evolving policy expectations.[7] That mix of stretched price levels, sector rotation and macro uncertainty is the backdrop against which the new 264-day seasonal window opens.
What to watch in this window
The historical pattern says this 264-day stretch has been unusually kind to long exposure in the Dow, but the path has rarely been straight. Traders will be watching whether the current pullback from record highs behaves like prior years, where early volatility gave way to a steadier climb, or whether macro shocks and single-stock hits in banks or industrials break that rhythm.
First, breadth and sector leadership will matter. If the window is going to rhyme with the past decade, gains are more likely to come from a broad mix of industrial, healthcare, consumer and financial names rather than a narrow tech surge. Continued rotation away from the most crowded growth stocks and into the Dow’s more value-oriented components would fit that script, while a renewed tech-only melt-up could leave the index lagging even if the broader market rallies.
Second, levels around the recent 52-week high near 50,512.79 are a natural waypoint. In prior strong years, the Dow not only reclaimed prior peaks but spent long stretches near its maximum favorable excursion before consolidating. A failure to retake that zone during the heart of the window would mark a clear departure from the typical pattern, especially given the 10-for-10 record of positive outcomes.
Third, intraperiod drawdowns deserve close attention. The 2020 and 2022 examples show that even in winning years, the index can trade 10% to 20% below the entry level at some point before finishing higher. If volatility spikes around macro events or earnings seasons, traders will want to distinguish between routine seasonal turbulence and something more structural that threatens the long-biased regime.
Finally, watch how the Dow reacts to stock-specific shocks in heavyweight components, particularly in financials and industrials. Episodes like the Dec 2025 JPMorgan slide show how quickly a single name can drag the index even when the broader tone is constructive.[6] If those hits are quickly absorbed and breadth stays healthy, the historical seasonal pattern has room to reassert itself. If they trigger sustained weakness across sectors, this could be the cycle that breaks a decade-long winning streak.
Sources
- [1] Seeking Alpha: U.S. stocks fall as tech sector struggles, rate-cut uncertainties rattle markets (Sep 24, 2025).
- [2] Seeking Alpha: Wall Street moves lower as investors digest retail earnings and Fed minutes (Aug 20, 2025).
- [3] Seeking Alpha: Cantor Fitzgerald doubts Wall Street rally (Mar 21, 2025).
- [4] MarketWatch: Dow’s banner day points to investor pivot beyond S&P 500’s top winners (Nov 11, 2025).
- [5] Seeking Alpha: Wall Street finished higher to kick off the holiday shortened trading week (Dec 22, 2025).
- [6] The Wall Street Journal: JPMorgan’s Stock Slide Weighs on Dow Industrials (Dec 9, 2025).
- [7] Seeking Alpha: Dow closes at record (Jan 5, 2026).