Tilman Fertitta’s $7B Bid for Caesars Entertainment (CZR) Runs Into a Bearish Midterm Stretch
Caesars Entertainment is heading toward a historically bearish midterm-year stretch just as takeover speculation lifts the stock toward the upper end of its 52-week range.

Key takeaways
- A 205-day midterm election year window for Caesars Entertainment starting Apr 5 has favored short positions in 7 of the last 8 cycles.
- The pattern is short-directed, with 88% profitable years for shorts, average winner gains of 28.42%, and a 25% average move when all years are included.
- Intraperiod swings have been large, with several years showing deep adverse moves before ultimately resolving in the trade direction.
- CZR closed at $28.41 on Friday, about 10.0% below its 52-week high of $31.58, after a sharp takeover-driven rally in recent weeks.[4][5]
- The setup lands in the early part of the midterm election year, a phase that often brings policy uncertainty and choppy trading for gaming and hospitality names.
- History suggests shorts have had the edge in this window, but the takeover backdrop could alter how the pattern plays out this time.
According to historical data from TradeWave.ai, this specific midterm-year stretch has behaved very differently from an average year for Caesars, and the next iteration begins in just a few weeks.
Seasonal window
Caesars Entertainment has delivered profitable short setups in 7 of the last 8 midterm election years during this 205-day window, with winning years averaging 28.42% moves in the trade direction. The next window begins on Apr 5 and will run deep into the heart of the midterm year, with the stock currently at $28.41, about 10.0% below its 52-week high of $31.58.[4][5]
The window sits in the early part of the midterm election year, a phase when Washington often debates spending, regulation and tax priorities that can directly affect travel, gaming and discretionary income. Grouping results by this presidential cycle phase matters because policy noise and rate expectations tend to cluster in midterm years, shaping how cyclical names like Caesars trade around the calendar.
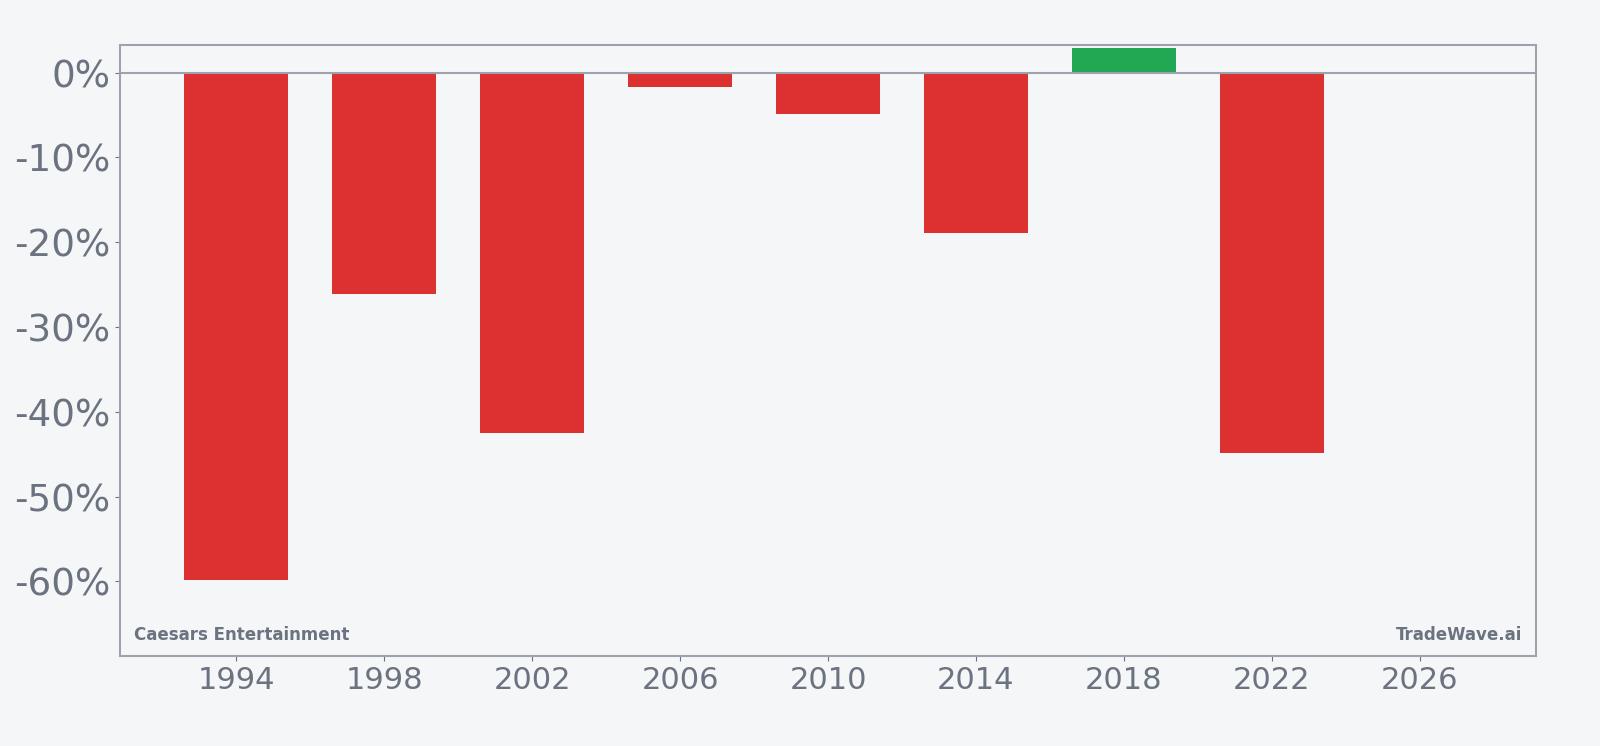
Across the last eight midterm election years in this pattern, shorts have been favored. Percent Profitable stands at 88%, with 7 winning years for the short direction and just 1 losing year. Average profit in the winning years is 28.42%, while the average move when every year is included, winners and losers together, is still a hefty 25%. That gap between the winners-only figure and the all-years average shows that the single losing year did not fully offset the strong downside stretches in the others.
The per-year table shows how extreme some of those moves have been. In 1994, a short held through the window would have captured a 59.88% decline, with the worst intraperiod drawdown from entry, or maximum adverse excursion, reaching 70.66% before the trade finished deep in the money. In 2022, the pattern again lined up with a brutal slide, with a 44.88% net drop and a maximum adverse excursion of 59.42% as the stock sank from $77.16 to $42.53 over the window.
Not every year has been that dramatic. The weakest winning year for shorts was 2006, when the net move was just 1.75% in the trade direction and the stock at one point moved 28.54% against the short before fading back toward flat. That kind of path is a reminder that even in a historically favorable window, timing and risk management have mattered as much as direction.
The historical seasonal trend line slopes steadily in favor of shorts, with most of the downside accruing over the middle of the window rather than in a single sharp break. Early days often show choppy action, followed by a more persistent drift lower that compounds into the double-digit average moves seen in the stats. By the end of the 205 days, the cumulative pattern has typically locked in a sizable decline from the entry point.
A second view that layers in best and worst intraperiod swings shows how much room the stock has historically given both sides before settling on a direction.
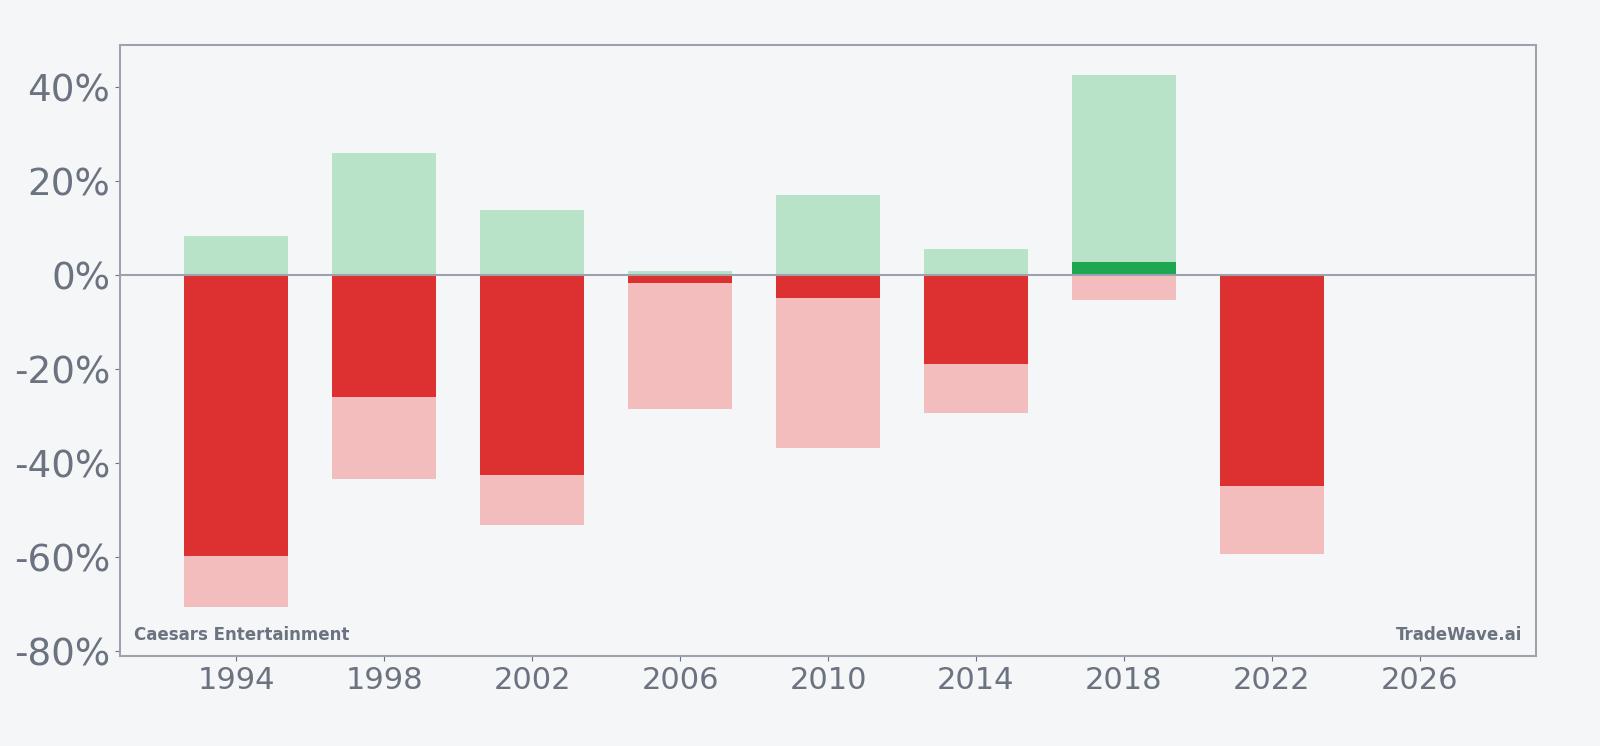
The stacked net, maximum favorable excursion and maximum adverse excursion bars show a high-variance environment. In several years, the stock first rallied sharply against the short before rolling over, while in others it dropped quickly and then bounced. Large maximum favorable excursions alongside large maximum adverse excursions mean this window has historically offered big opportunity for shorts but also big risk if entries were mistimed or stops were too tight.
History does not guarantee future results; adverse excursions can be large even in winning windows, and past midterm-year behavior may not repeat.
Price and near-term drivers
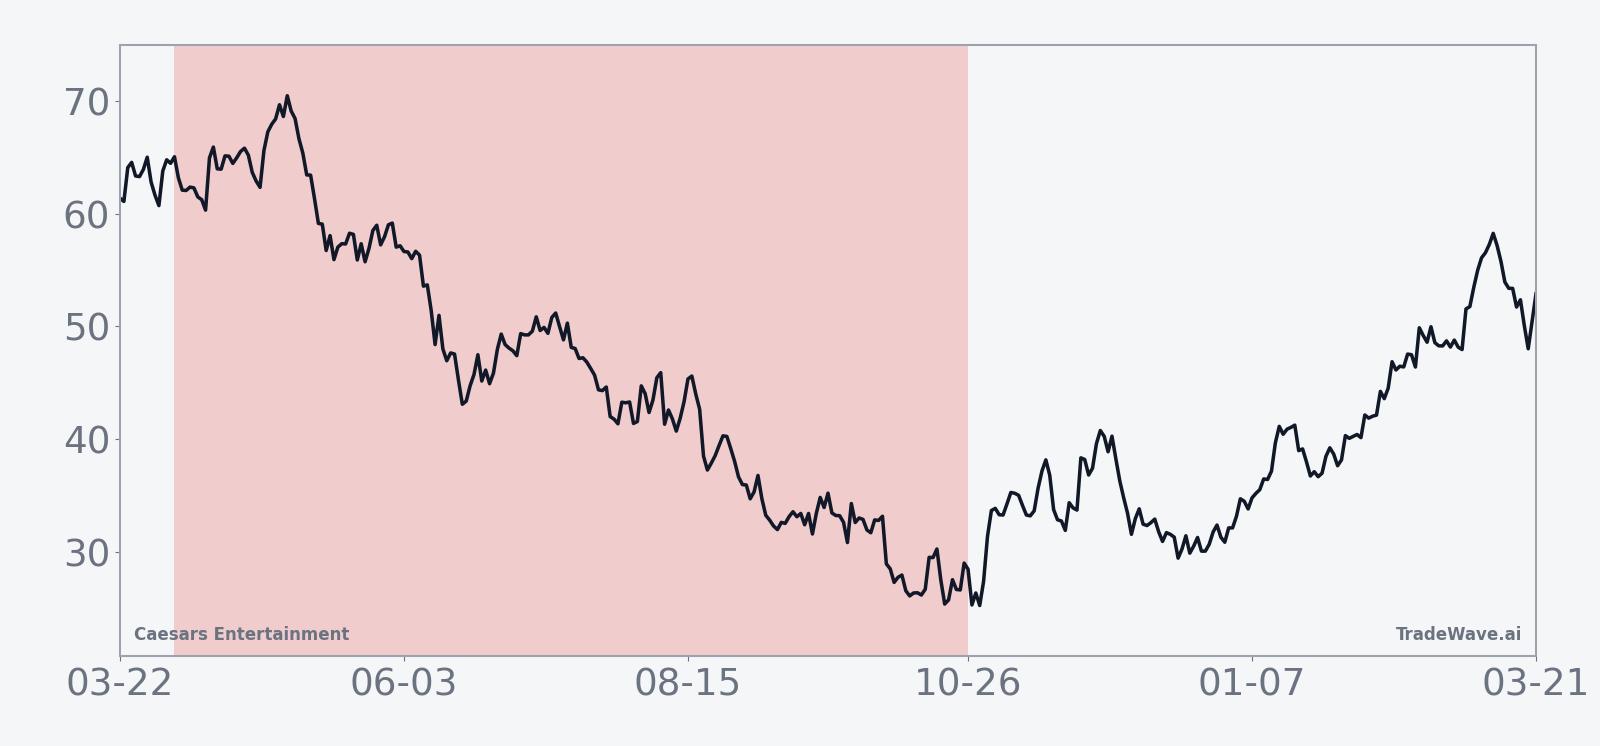
Caesars shares closed Friday at $28.41, down 2.3% on the day, after a volatile stretch that has left the stock about 10.0% below its 52-week high of $31.58 and well above its 52-week low of $17.86. The stock has surged roughly 43.2% over the past month, a move that has pulled it decisively above its 50-day moving average of $22.99 and come on volume that is running ahead of the 20-day average of about 8.1 million shares.[5]
The catalyst has been takeover interest. On Feb 26, Reuters reported that Caesars was weighing bids, including from billionaire Tilman Fertitta, and that the stock jumped about 19% on the day as investors reassessed the company’s standalone value and deal odds.[5] On Mar 11, The Wall Street Journal reported that Fertitta was in talks to buy Caesars for approximately $7 billion, offering around $34 per share, a level that sits above the current price and has effectively set a soft ceiling for near-term deal speculation.[4]
Those headlines land after a tough fundamental stretch. In Oct 2025, Caesars posted a third-quarter loss of 27 cents per share on $2.87 billion in revenue, missing estimates as visits to Las Vegas declined.[1] Earlier in Jul 2025, the company had reported a narrower second-quarter loss of 39 cents per share on $2.91 billion in revenue, helped by digital revenue gains but still in the red.[3] Analysts at Forbes in Oct 2025 framed the stock as trading in a support range with a history of rebounding from similar levels, a view that has been partially validated by the recent rally.[2]
Sector-wise, Caesars sits at the intersection of gaming and hospitality, a space that is sensitive to consumer discretionary spending, travel trends and credit conditions. The stock’s rebound from support has come as investors rotate back into cyclical names and look for laggards that could benefit from stable or lower interest rates and resilient leisure demand.[2] The added layer of a potential buyout has turned CZR into a tactical trading vehicle as much as a pure fundamental story.
The chart below situates the latest move in its recent multi-month context.
Macro and election-cycle backdrop
The upcoming window unfolds in the midterm election year, a phase that often brings heightened debate over fiscal policy, regulation and consumer-facing industries. For gaming and hospitality, that can mean scrutiny of tax regimes, responsible gaming rules and capital allocation, all of which feed into how investors price long-duration cash flows for companies like Caesars.
Midterm years also tend to be choppier for cyclical stocks as markets digest the first half of a presidential term and handicap how policy might shift ahead of the next election. For Caesars, that means the April-to-year-end stretch could be shaped as much by Washington headlines and rate expectations as by Las Vegas foot traffic or digital betting trends. The historical pattern that favors shorts in this window has developed against that backdrop across multiple cycles, from the 1990s through 2022.
What to watch as the window opens
For traders tracking this pattern, the first marker is timing. The seasonal window starts on Apr 5 and runs for 205 trading days, carrying CZR from early in the midterm year toward the doorstep of the pre-election year. Historically, the middle of the window has been where the bulk of the downside for shorts has accrued, so how the stock behaves through late spring and summer will be key.
Price levels matter. The $31.58 area, roughly the 52-week high, lines up near the reported $34 offer level and will be watched as a resistance band if deal talks drag on or stall.[4][5] On the downside, the 50-day moving average near $23 and the prior support zone highlighted in earlier analysis will be important tells on whether the recent rally has staying power or gives way to the kind of drift lower that has defined past midterm-year windows.[2]
On the news front, any update on Fertitta’s bid, competing offers or a management-led buyout could overwhelm seasonal tendencies in the short term. A firm deal at or above the rumored price would likely cap upside and compress volatility, while a breakdown in talks could reintroduce earnings and macro risk as the primary drivers.[4][5] In that scenario, the historical pattern of weakness in this window would take on more relevance.
Finally, watch how volatility behaves relative to the historical profile. In prior cycles, maximum adverse excursions have been large even in winning years for shorts, which means sharp rallies against the trade have been common before the trend reasserted. If CZR enters the window with continued high-volume swings and wide intraday ranges, that would rhyme with the past. A quiet, range-bound tape, especially if anchored by deal expectations, would be a clear break from the historical script.
Put together, the setup is unusual: a stock lifted by takeover speculation heading into a midterm-year window that has historically rewarded patience on the short side. The next few months will show whether the deal narrative or the calendar pattern has the louder voice this time.
Sources
- CNBC, "Stocks making the biggest moves after hours: Visa, Seagate, Caesars Entertainment, Mondelez and more" (Oct 28, 2025)
- Forbes, "Time To Buy Caesars Stock Now?" (Oct 09, 2025)
- The Wall Street Journal, "Caesars Entertainment Posts Narrower Loss on Digital Revenue Gains" (Jul 29, 2025)
- The Wall Street Journal, "Tilman Fertitta in Talks to Buy Caesars for $7 Billion After Topping Bid From Icahn" (Mar 11, 2026)
- Reuters, "Las Vegas casino group Caesars weighs takeover interest, FT reports" (Feb 26, 2026)