With NG Still 58% Below Its High, Natural Gas (CME) (NG) Approaches a Perfect Spring Window
Natural Gas (CME) is nearing a short midterm-year spring window that has never produced a loss in the past eight cycles, just as prices trade well off last year’s extremes and weather-driven volatility stays elevated.
Key takeaways
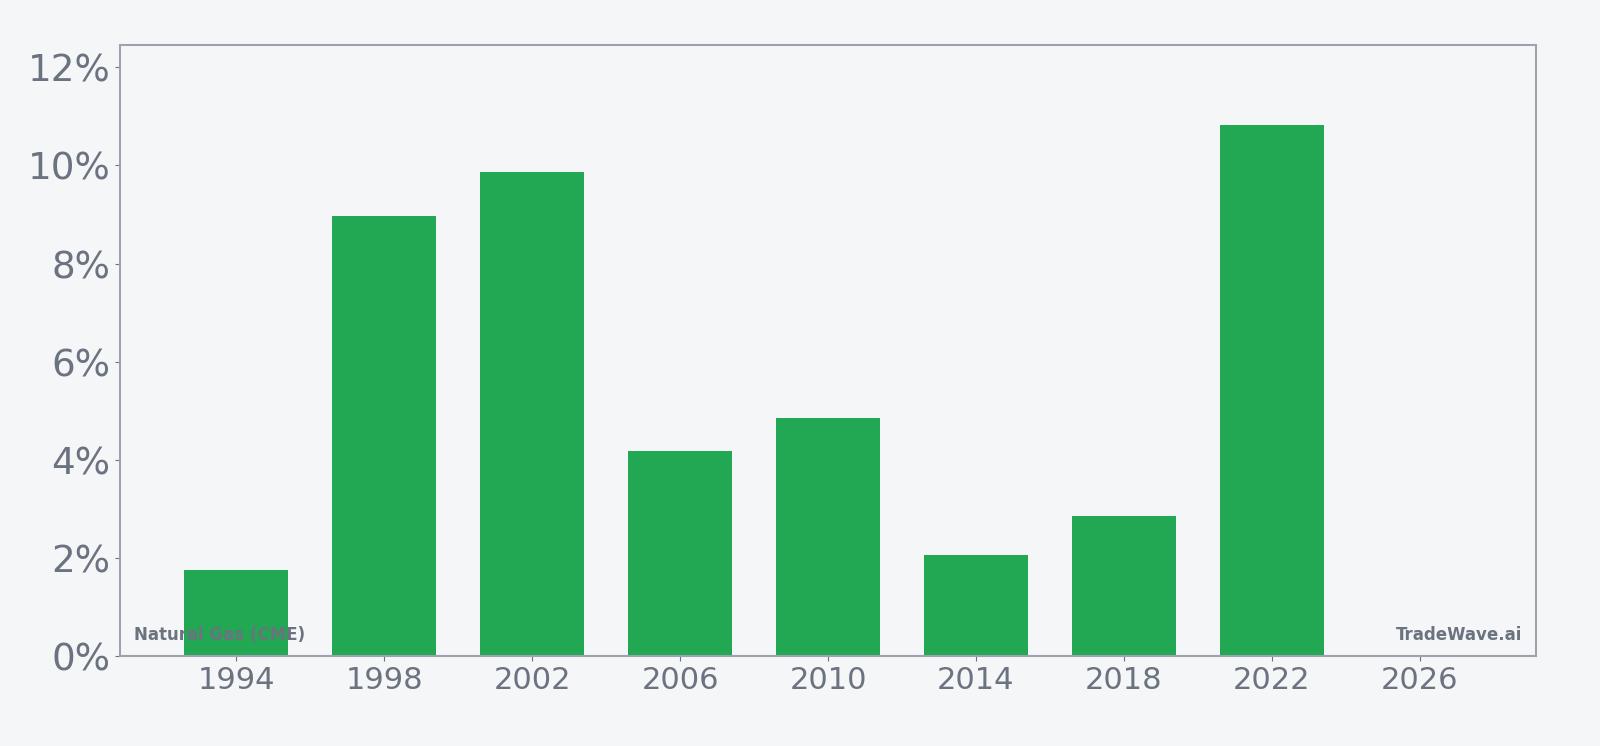
- A 12-day seasonal window for Natural Gas (CME) starting Mar 22 has been positive in all 8 midterm election years in the sample, with no losing cycles.
- The pattern is long-biased, with average gains of 5.67% across winners and a cumulative 54% return over the eight historical windows.
- Intraperiod swings have been meaningful: the strongest year saw a best point-to-peak move above 13%, while the worst drawdown in a winning year approached 8%.
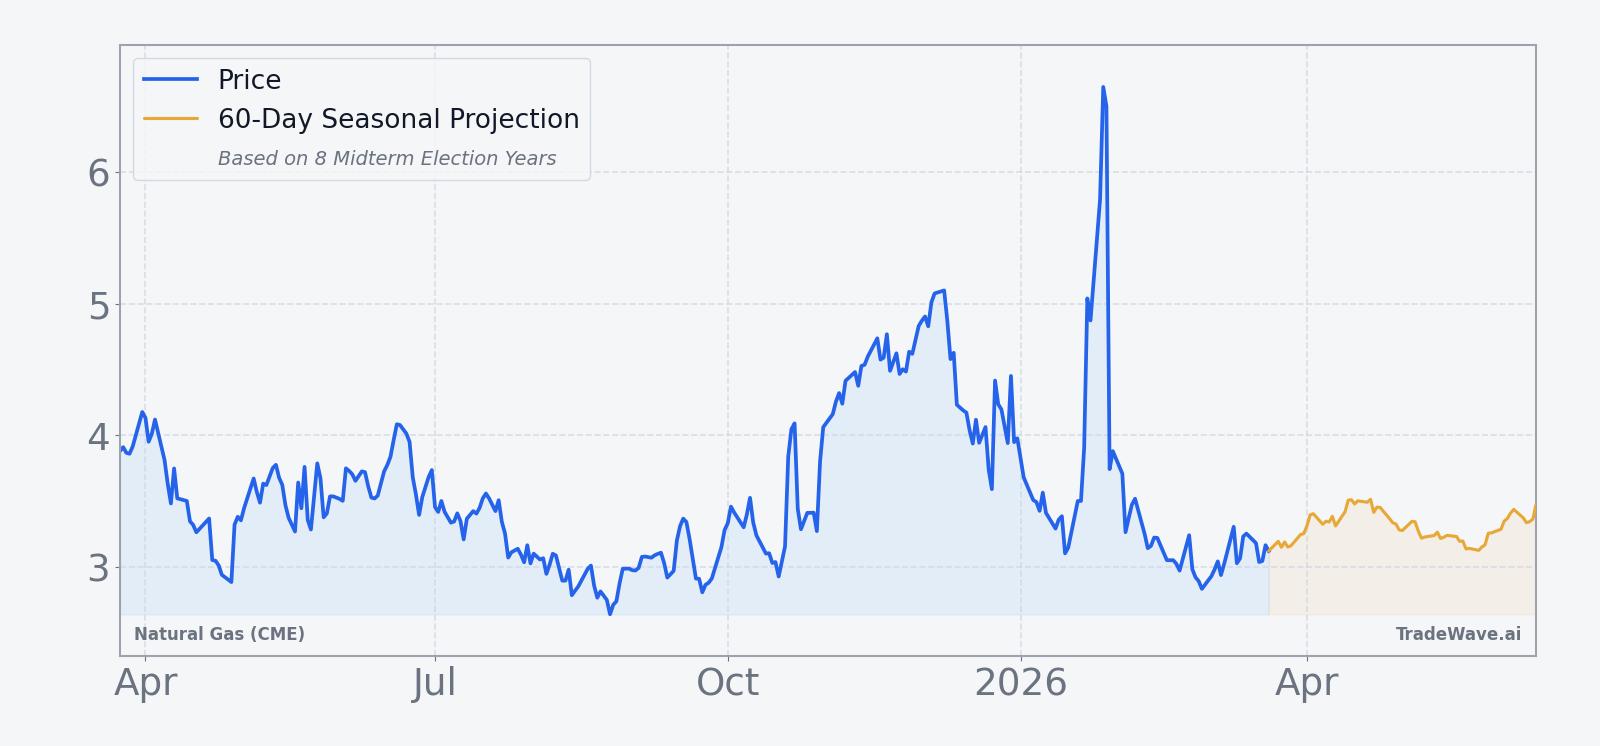
- Today NG trades at 3.251, up 1.3% on the day and well below last year’s 7.827 high, leaving room for volatility if the pattern rhymes with history.
- Weather and storage remain the dominant near-term drivers, with recent cold snaps and choppy trade underscoring how quickly sentiment can flip.[3]
According to historical data from TradeWave.ai, this late-March stretch in midterm election years has behaved very differently from an average month on the natural gas calendar, and the next iteration is about to open.
Seasonal window
Natural Gas (CME) has risen in all 8 midterm election years during this 12-day late-March window, averaging 5.67% gains for long positions. The next window begins on Mar 22, with NG currently trading at 3.251 and sitting far below last year’s 7.827 high, a reminder of how wide the recent range has been.[3]
Grouping the data by the presidential election cycle matters here because midterm years often bring a different policy and macro mix than election or pre-election years, with shifting regulation, fiscal debates and energy policy noise feeding directly into fuel demand expectations. In this case, the pattern phase covers the last eight midterm election years, while the calendar is currently in the early part of the midterm year, so the upcoming window lines up cleanly with that historical slice.
The trade direction for this pattern is explicitly long. Across the eight midterm-year windows, every single instance finished higher, delivering a cumulative 54% gain and a Sharpe ratio of 1.51 based on end-of-window outcomes. Average winners gained 5.67%, while the median outcome of 4.52% shows that the typical year still produced a solid move rather than relying on one outlier.
Intraperiod behavior has not been gentle. In 1994, NG finished the window up 1.76%, but at one point it was down 7.93% from the entry before recovering, illustrating how a winning window can still punish late or leveraged entries. At the other end of the spectrum, 2022 delivered a 10.83% net gain with a best point-to-peak move of 13.41% and only a 2.16% worst drawdown, a cleaner upside run that shows what a strong year in this pattern can look like.
The historical seasonal trend line for this window tilts higher rather than chopping sideways. The average path shows gains building through the middle of the 12-day stretch, with some years front-loading the move and others catching up late, but very few examples of persistent selling across the entire window.
Year-by-year net returns alongside best and worst excursions show how upside and downside have coexisted inside this otherwise consistent window.
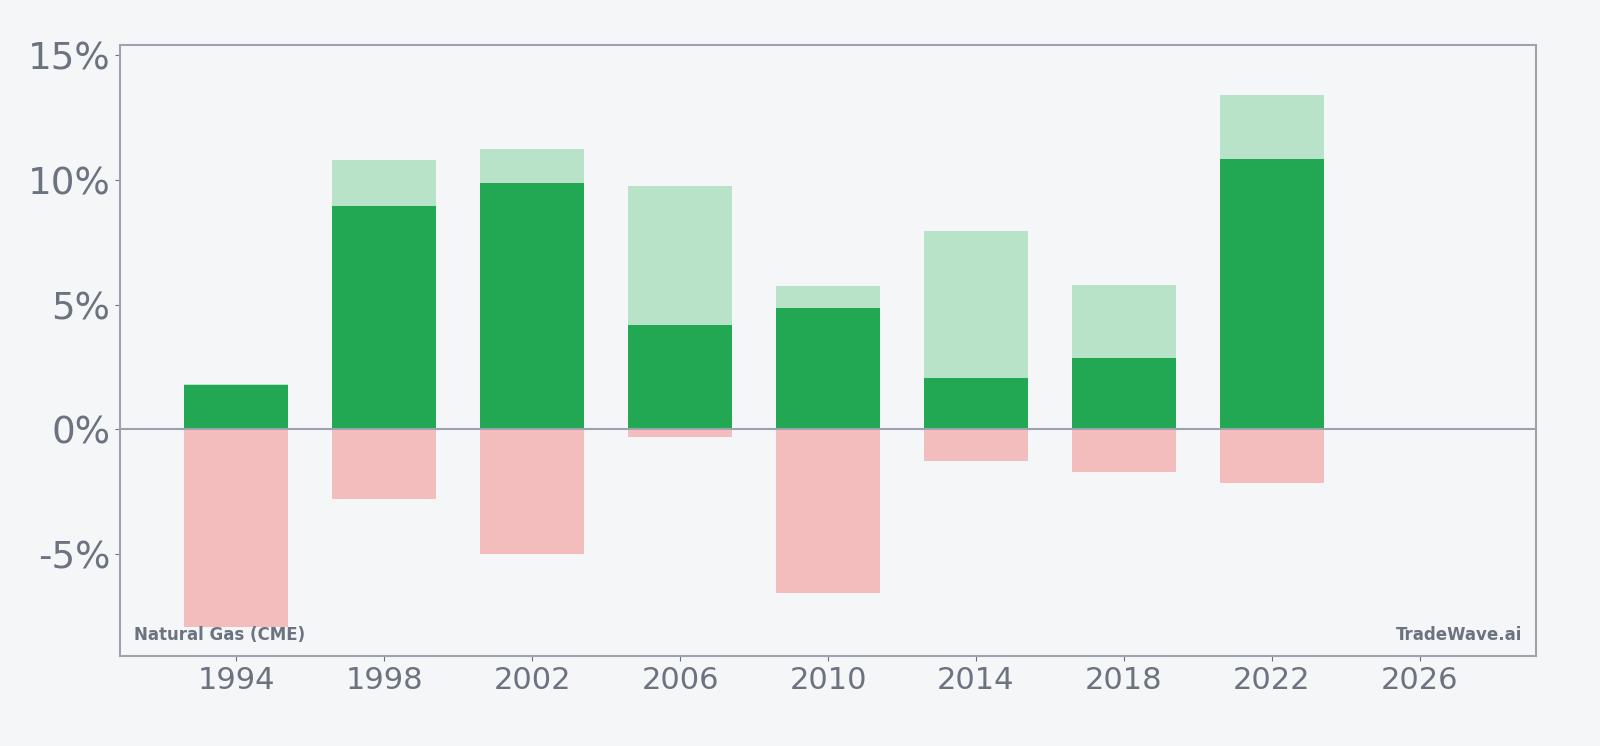
The combined net, maximum favorable excursion and maximum adverse excursion profile shows a window that has historically offered meaningful upside while still delivering sharp pullbacks along the way. Several years posted best point-to-peak moves near or above 10%, yet even the milder winners saw temporary drawdowns of 1% to 3%, and one year flirted with an 8% intraperiod loss before finishing higher. Add it up: eight for eight on final outcomes, but with enough volatility inside the window to matter for risk management.
History does not guarantee future results, and even in a window with no losing years so far, adverse excursions can be large enough to challenge tight stops or leveraged positions.
Price and near-term drivers
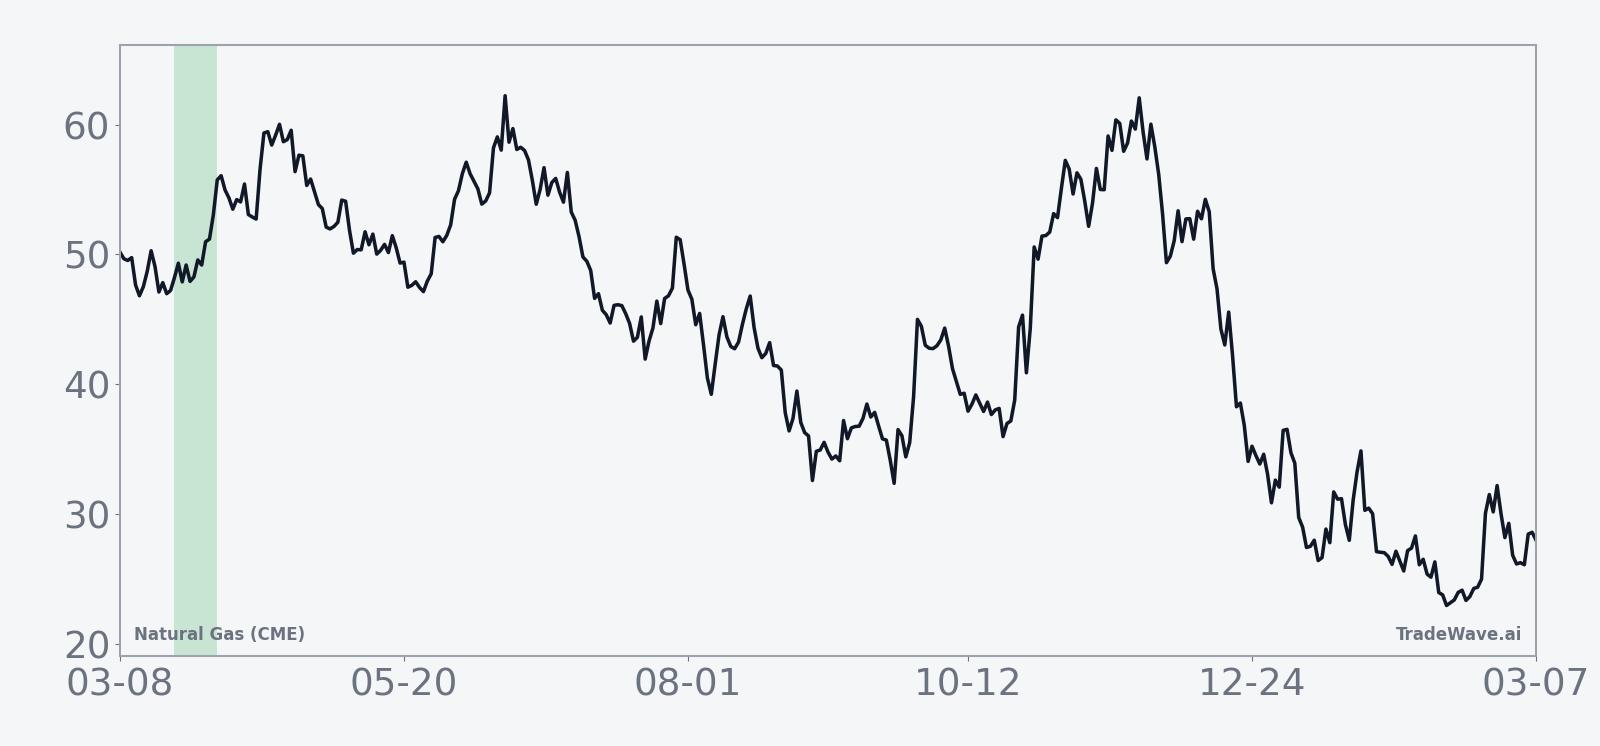
Natural gas futures settled at 3.251 on Thursday, up 1.3% on the day and roughly 58.5% below the 52-week high of 7.827, underscoring how far prices have retreated from last year’s weather-driven spike.[3] The contract has gained 2.15% over the past month, trading below its 50-day moving average of 3.594 on relatively light volume compared with the 20-day average of about 129,878 contracts, a sign that positioning is still cautious rather than euphoric.
Weather remains the dominant short-term story. On Jan 20, 2026, a bitter cold snap sent natural gas futures sharply higher as heating demand surged, with some analysts calling it the toughest test for the market in a decade.[3] By Feb 19, futures were slipping in choppy trade as the market tried to balance lingering cold with shifting forecasts, highlighting how quickly sentiment can swing when temperature models and storage expectations move around.[4]
Those swings sit on top of a familiar macro backdrop for gas: demand is highly sensitive to extreme cold in winter and heat waves in summer, while weekly storage data can flip the narrative from surplus to deficit in a single report.[2][5] In 2025, for example, U.S. natural gas futures rallied ahead of storage releases that were expected to show withdrawals, even when near-term weather looked milder, as traders focused on the possibility that inventories could tighten into the following year.[1][6]
Sector-wide, energy demand trends remain tied to both power generation and industrial usage, with hotter summers boosting gas burn for air conditioning and colder winters lifting heating loads.[1][7] That linkage means the upcoming seasonal window does not operate in a vacuum: if late March brings another bout of unseasonal cold or an early warm spell that shifts power demand, the same weather dynamics that have driven recent volatility could again intersect with the historical pattern.
The chart below situates the latest move in its recent multi-month context.
What to watch as the window opens
The upcoming 12-day midterm-year window for Natural Gas (CME) starts on Mar 22, and history says it has been a friendly stretch for longs, but not a quiet one. Traders will be watching four things in particular.
First, the weather models. Any shift toward late-season cold in key U.S. consuming regions could amplify the historical upside tendency by pulling forward heating demand, while an abrupt warm turn could blunt it. The January cold surge showed how quickly prices can respond when temperatures surprise to the downside.[3]
Second, weekly storage reports. If draws remain larger than expected or injections come in light, the market could start to reprice the balance heading into summer, especially with prices still far below last year’s peak.[2][5] Conversely, a run of comfortable storage numbers would give bears more confidence to fade rallies, even inside a historically strong window.
Third, price levels around the 50-day moving average near 3.594. A push back above that band during the window would signal that buyers are leaning into the seasonal tendency, while repeated failures there would suggest that macro headwinds are overpowering the historical pattern.
Finally, volatility itself. The past eight midterm-year windows all finished higher, but several did so only after sizable intraperiod drawdowns. If this year’s window again features wide intraday ranges and sharp reversals, it would be consistent with the historical MFE/MAE profile. A surprisingly calm, low-volatility stretch that drifts sideways instead would be the clearest sign that this cycle is breaking from the script.
Natural gas is a systemically important commodity for power, heating and industrial activity, so any sharp move in this window can ripple into energy equities and inflation expectations. The pattern’s track record is striking, but the real test starts when the calendar flips to Mar 22 and weather, storage and positioning collide with that history in real time.
Sources
- [1] Reuters, "US natgas prices gain over 2% on mid-July heat forecasts, more cooling demand," Jul 2, 2025.
- [2] The Wall Street Journal, "U.S. Natural Gas Picks Up Ahead of Storage Data," Dec 10, 2025.
- [3] MarketWatch, "Natural-gas prices soar as temperatures drop. It could be the toughest test for the markets in a decade.", Jan 20, 2026.
- [4] The Wall Street Journal, "U.S. Natural Gas Futures Slip in Choppy Trade," Feb 19, 2026.
- [5] The Wall Street Journal, "U.S. Natural Gas Futures Gain Ahead of Delayed Storage Data," Dec 29, 2025.
- [6] The Wall Street Journal, "U.S. Natural Gas Futures Extend Decline," Dec 12, 2025.
- [7] The Wall Street Journal, "U.S. Natural Gas Futures Extend Losing Streak," Dec 15, 2025.
- [8] The Wall Street Journal, "U.S. Natural Gas Futures Post Daily Gain, Weekly Loss," Dec 19, 2025.