After a 25% Run, S&P 500 Healthcare Sector SPDR (XLV) Near Highs Faces Seasonal Downside
S&P 500 Healthcare Sector SPDR is coming off a powerful run, but a midterm-year spring pattern that has historically favored downside in the ETF is already in play.

Key takeaways
- A 49-day midterm-year spring window that began Mar 18 has seen S&P 500 Healthcare Sector SPDR move lower in all 6 comparable cycles since 2002.
- The pattern is structured as a short setup, with 100% Percent Profitable, 6 winners and 0 losers for traders positioned for downside.
- Average profit for winning short trades in this window has been 3.9%, with a cumulative 25% gain across the six midterm years.
- Intraperiod swings have been meaningful, with historical best moves in the trade direction often paired with adverse excursions of roughly 4% to 7% before the trend reasserted.
- The window sits in the early part of the midterm election year, a phase that has often been choppy for risk assets before strength tends to emerge later in the cycle.
According to historical data from TradeWave.ai, this specific midterm-year stretch in healthcare has behaved very differently from an average spring. The next section walks through how that pattern has played out for S&P 500 Healthcare Sector SPDR in prior cycles, and what that backdrop means for the current window.
Seasonal window
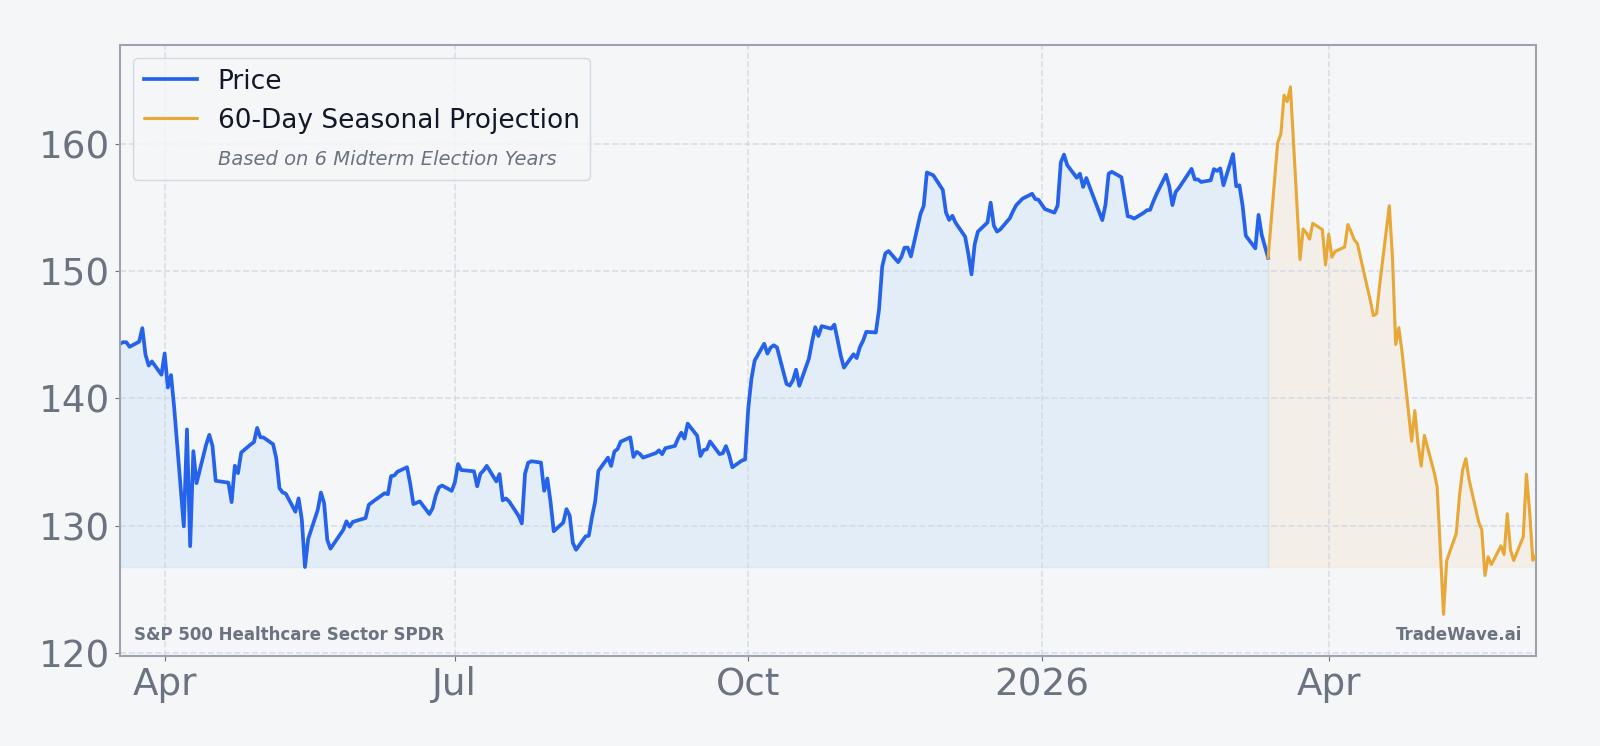
The seasonal window that began on Mar 18 and runs for 49 trading days has seen S&P 500 Healthcare Sector SPDR fall in all 6 midterm election years since 2002, with an average short-side gain of 3.9%. That pattern is unfolding as XLV trades near the upper end of its past-year range, roughly 1.6% below its 52-week high of 160.59, after a strong multi-month rally that has left healthcare leading the broader S&P 500 from its August low.[1] For traders, the combination of a stretched sector and a midterm-year window that has consistently rewarded downside positioning turns what might look like a routine consolidation into a calendar period worth watching closely.
Grouping the data by the presidential election cycle matters here because healthcare policy and reimbursement debates tend to flare in midterm years, when control of Congress is on the line and legislative risk is front of mind for investors. In this framework, the current stretch sits in the early part of the midterm election year, a phase that has often been more volatile and less forgiving for crowded sector trades than the pre-election year that follows.
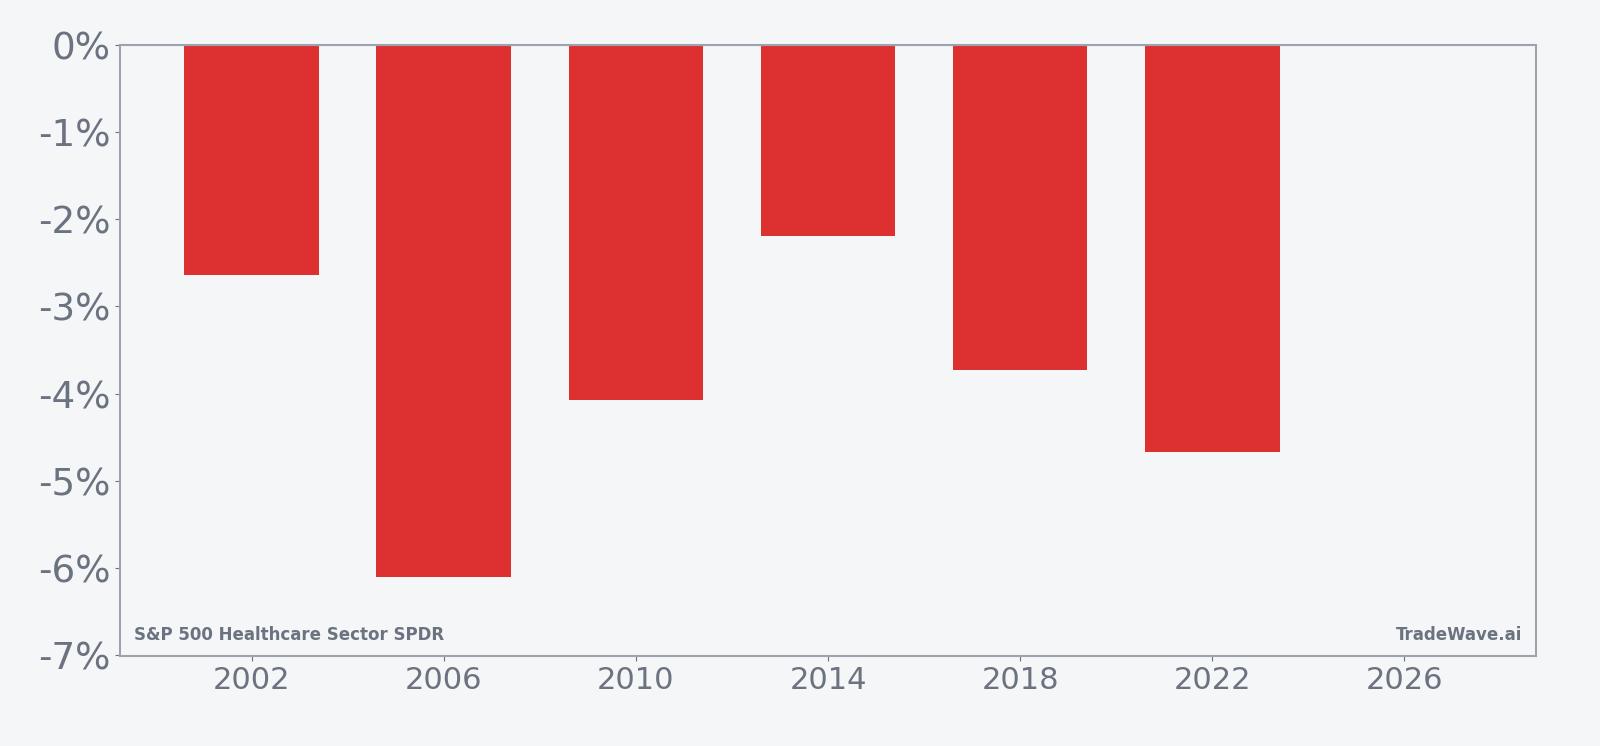
Across the last six midterm election years, the short-side pattern in this 49-day window has a 100% Percent Profitable record, with 6 winners and 0 losers. Average profit for those winning shorts is 3.9%, and the cumulative gain across all six cycles is 25%, which lines up with an annualized return of 3.89% for traders who only engage during this specific slice of the calendar. The median outcome is also 3.9%, suggesting the distribution of returns has been relatively tight around that central tendency rather than driven by a single outlier year.
The per-year breakdown shows how that has played out in practice. In 2006, a short entered at 23.34 and exited 49 days later at 21.92, a net move of about 6.1% in favor of the trade. In 2022, the ETF fell from 128.36 to 122.37 over the window, delivering a 4.67% gain for shorts even though the best intraperiod move in their favor reached 5.02% before some of that edge was given back. The “weakest” year for the pattern was 2014, when XLV still declined 2.19% from entry to exit, enough to keep the win streak intact.
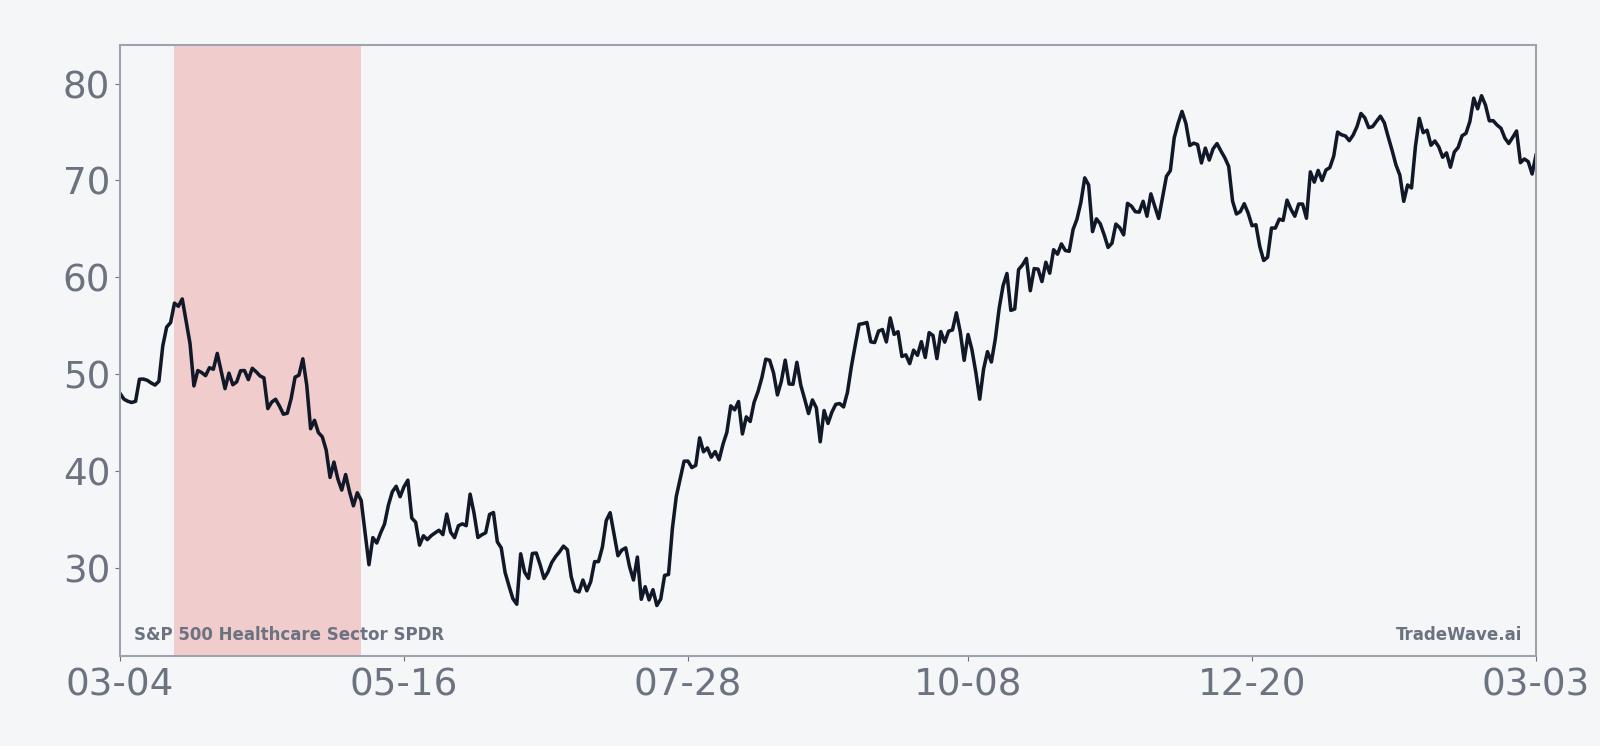
The historical seasonal trend chart shows that, on average, the bulk of the downside for XLV in this window has tended to accrue gradually rather than in a single air pocket. Returns often drift lower over the first half of the period, with occasional countertrend rallies, before the pattern typically stabilizes toward the end of the 49 days. That profile fits with a market that reprices policy risk and positioning over several weeks instead of reacting to a single headline.
A second view that layers in best and worst intraperiod swings helps clarify how much noise traders have had to sit through to capture those moves.
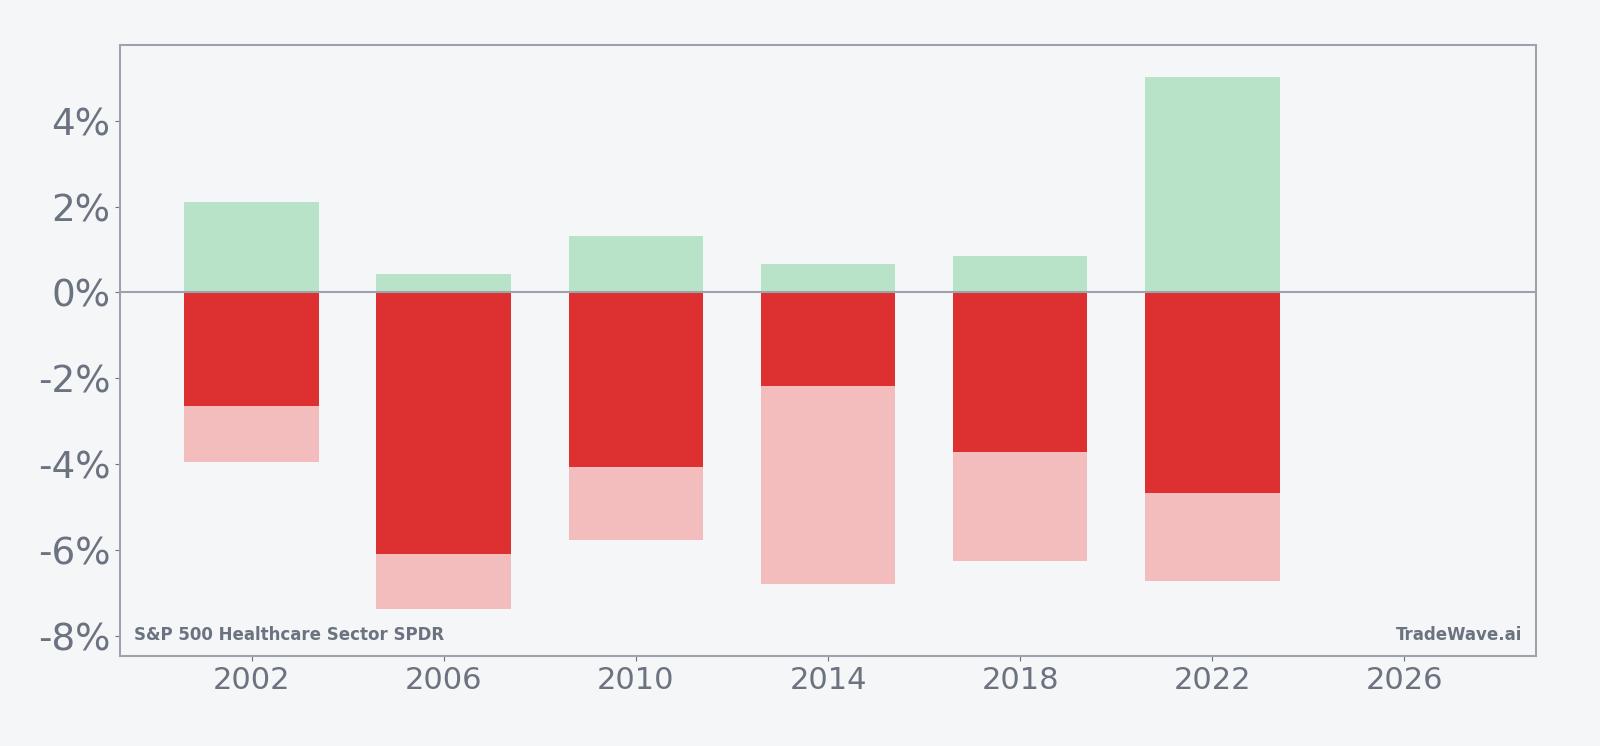
Across the six midterm years, maximum favorable moves in the trade direction have ranged from roughly 0.4% to just over 5%, while maximum adverse moves have often stretched between about 4% and 7% against the short before the trade finished in the green. That mix of solid net outcomes and sizable intraperiod reversals is captured in a TradeWave Ratio of 4.66 and a Sharpe ratio of 2.39, which together point to a window that has historically rewarded patience but has not been free of stress for anyone leaning into the seasonal edge.
History does not guarantee future results, and the worst intraperiod moves against the trade have been large enough that even winning windows have carried meaningful drawdown risk.
Price and near-term drivers
XLV has been one of the market’s quiet leaders over the past several months, climbing roughly 25% off its August low and outpacing the broader S&P 500 as investors rotated toward defensive growth and cash-generative balance sheets.[1] That strength has left the ETF trading close to its 52-week high of 160.59, with a one-month return of about -1.6% that looks more like a pause than a breakdown and a 20-day average volume near 15.4 million shares that signals steady institutional participation rather than a blow-off spike.
Part of the bid under healthcare has come from macro positioning. In a world where investors are still debating the path of interest rates and inflation, large-cap drugmakers, managed care and medical device names offer earnings visibility that many cyclical sectors lack.[1] At the same time, the sector is not immune to policy risk. Headlines around former President Trump’s renewed ultimatum to big pharma on drug pricing have reminded traders that regulatory overhang can reprice healthcare quickly, even when fundamentals look solid.[2]
That mix of strong trailing performance and policy noise is why the current seasonal window stands out. XLV is entering the early part of the midterm election year, historically a two-playbook phase for U.S. equities in which choppy, risk-heavy trading in the first half of the year often gives way to a powerful midterm-to-pre-election rally later on. For healthcare specifically, the last six midterm cycles show that this 49-day spring stretch has tended to be the part of the year when investors trim exposure or demand a higher risk premium for policy uncertainty, even if the longer-term trend remains constructive.
The chart below situates the latest pullback against XLV’s broader 12-month climb.
What to watch in this window
For traders tracking this pattern, the first sign that the historical script is playing out would be a continuation of the gentle drift lower that has characterized prior midterm-year springs, rather than an immediate sharp break. A move that takes XLV meaningfully below its recent consolidation band while volume stays near or above its 20-day average would fit the profile of past windows, where downside built over several weeks instead of in a single shock.
Policy and headlines will matter as much as charts. Any escalation in drug-pricing rhetoric, reimbursement debates or managed-care regulation could act as a catalyst that accelerates the kind of repricing seen in 2006 and 2022, when the ETF’s net declines in the window reached 6.1% and 4.67% respectively. Conversely, a quiet policy tape combined with continued sector leadership would be a clear departure from the last six midterm cycles and a sign that investors are willing to look through the usual election-year noise.
Levels also matter. On the upside, a sustained break to fresh 52-week highs with limited intraperiod downside would contradict the historical pattern and suggest that the current macro backdrop is overpowering the midterm-year template. On the downside, traders will be watching how XLV behaves if it approaches prior support zones carved out during the late-2025 rally; in past cycles, bounces from those areas have often been shallow during this window, with sellers using strength to reduce exposure rather than chase new highs.
Put together, the message from the seasonal data is not a prediction but a heads-up. XLV has been a standout performer, yet the calendar has flipped into a 49-day stretch in midterm election years that has never produced a losing outcome for short-side positioning in the last six cycles. If the ETF starts to roll over while policy noise picks up, that would look like history rhyming. If instead healthcare shrugs off the window and powers to new highs, it will be one of the clearest signs yet that this midterm year is breaking from the usual playbook.
Sources
- Health care sector rally analysis (source_id 1, date not provided).
- Trump's ultimatum to big pharma (source_id 2, date not provided).