Overbought S&P 500 Healthcare Sector SPDR (XLV) Confronts Its Historically Soft Midterm Spring Run
S&P 500 Healthcare Sector SPDR is approaching a 49-day midterm-year stretch that has consistently leaned lower, just as the ETF comes off a powerful rally and faces a busy policy calendar.

Key takeaways
- A 49-day seasonal window for S&P 500 Healthcare Sector SPDR (XLV) begins on Mar 18 and covers the early part of midterm election years.
- Across the last 6 midterm election years, XLV has moved lower in this window every time, aligning with a short trade direction.
- Average profit for the short setup has been 3.9%, with a cumulative 25% gain across all six historical windows.
- Intraperiod swings have been meaningful, with several years showing adverse moves of roughly 6% against the short before finishing lower.
- The pattern clusters in a policy-heavy part of the cycle, when drug pricing and reimbursement headlines have often driven healthcare volatility.
- History points to a consistently negative bias for XLV in this slice of the calendar, but the path has rarely been smooth.
According to historical data from TradeWave.ai, this specific midterm-year stretch has behaved very differently from an average spring for XLV. The next section walks through what that pattern has looked like in prior cycles and how it frames the upcoming window.
Seasonal window
S&P 500 Healthcare Sector SPDR has declined in all 6 of the last midterm election years during this 49-day window, with an average short-side gain of 3.9%. The new iteration begins on Mar 18, with XLV coming off a strong multi-month advance and trading not far from its 52-week high after a roughly 25% rebound from an August low in the prior rally phase.[1][2] That combination of a stretched tape and a historically weak midterm slice gives this window more weight than a typical seasonal quirk.
The presidential election cycle matters here because the pattern is built only from midterm election years, a phase that has often featured tougher rhetoric on drug prices and reimbursement as politicians test messages ahead of the next presidential race. Pattern phase equals the midterm election year, while the calendar phase today is also the midterm election year in its early part, so the historical and current backdrops are aligned.
This seasonal window begins on Mar 18 and spans 49 trading days. Historically, during this period, S&P 500 Healthcare Sector SPDR has tended to drift lower, which is favorable for a short setup and unfavorable for long-only holders.
The trade direction in the dataset is short, and every one of the six historical windows finished in the money for that stance. Percent Profitable is 100%, with 6 winners and 0 losers, meaning there has not yet been a year in this sample where a short entered on the start date and exited on the end date lost money.
Average profit for those winning shorts has been 3.9%, and because there are no losing years in the sample, the all-years average lines up with that same 3.9% figure. Add it up and the cumulative return across the six midterm windows is 25% for the short side, which is a meaningful edge for a sector ETF over a relatively tight slice of the calendar.
The TradeWave Ratio (TWR) for this pattern is 4.66. TradeWave Ratio (TWR) reflects how far price typically travels in the trade direction within the window regardless of the final close. A reading above 4 suggests that, in many years, XLV has not just closed lower but has also spent a good portion of the window moving in favor of the short before any countertrend bounces.
Risk-adjusted performance has also been strong. The Sharpe ratio for the pattern is 2.39, which is high for a 49-day window and signals that the average outcome has been meaningfully negative for XLV with relatively contained variability in end-of-window results.
Looking at individual years shows how that plays out in practice. In 2006, for example, XLV fell about 6.1% from entry to exit, with the best intraperiod move in favor of the short only about 0.43% but the worst drawdown against the position roughly 7.38% before the ETF rolled over again. In 2022, the short gained about 4.67% by the end of the window, but the path included a favorable swing of roughly 5.02% at one point and an adverse move of about 6.73% at another, underscoring that even “winning” years have not been one-way trades.
Those best and worst intraperiod moves are captured by maximum favorable excursion and maximum adverse excursion. Maximum favorable excursion is the peak run-up in the trade direction during the window, while maximum adverse excursion is the deepest drawdown from the entry price before the position recovers. Across the six midterm years, both numbers have often been sizable, which points to a choppy, headline-sensitive environment rather than a smooth grind lower.
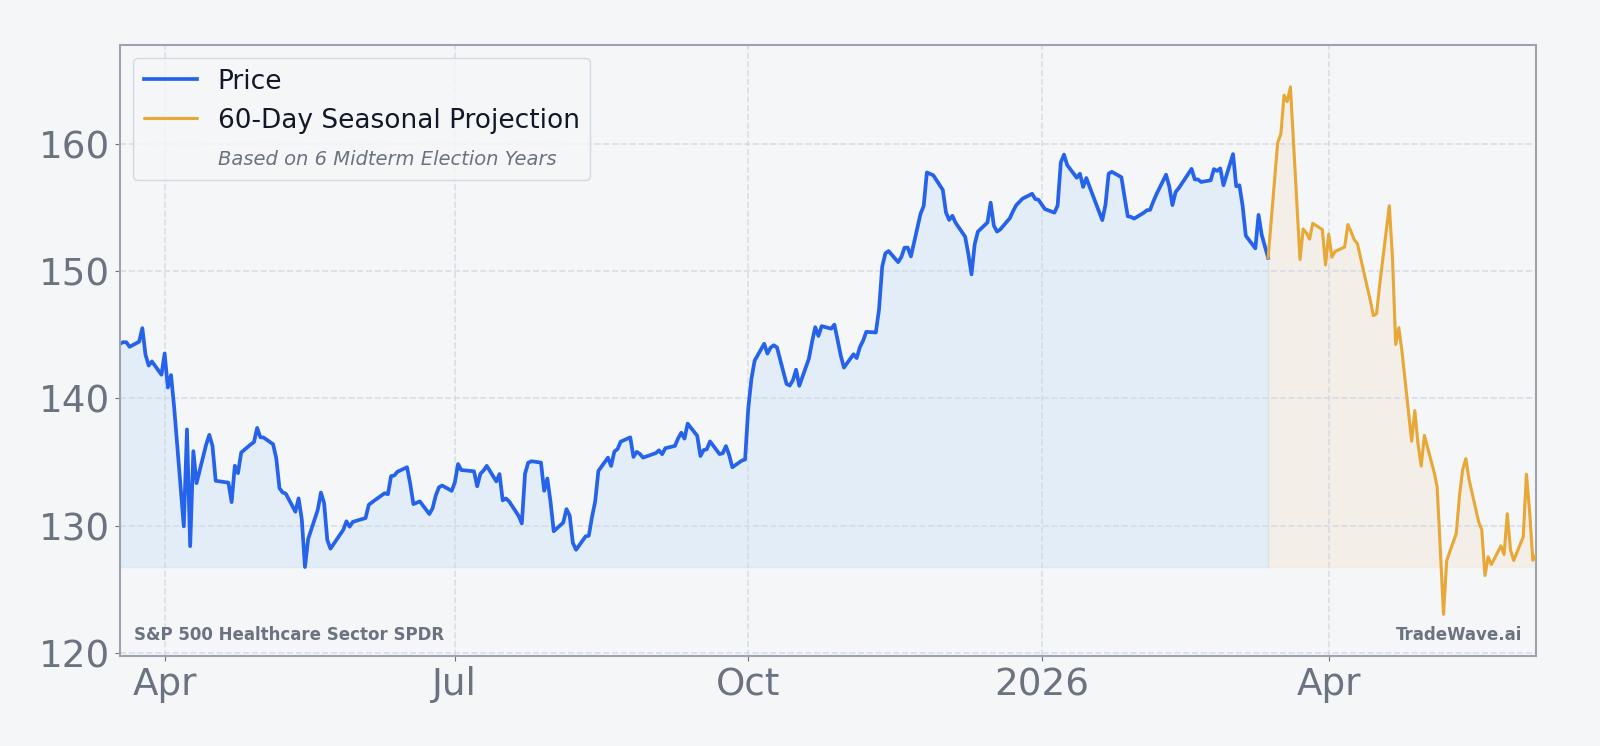
The historical seasonal trend chart for this window shows that, on average, the short side has tended to gain traction relatively early in the period, with much of the net move accruing in the first half of the 49 days. Later in the window, the average path flattens, suggesting that bounces and countertrend rallies have been more common as the calendar approaches late spring.
The cumulative return profile across cycles reinforces that picture. When you stack the six midterm years together, the line slopes steadily in favor of the short, with no major reversals that erase prior gains by the end of the window. The pattern is not explosive, but it is consistent.
Year-by-year bars with maximum favorable and adverse moves show how often XLV has swung sharply before finishing lower.
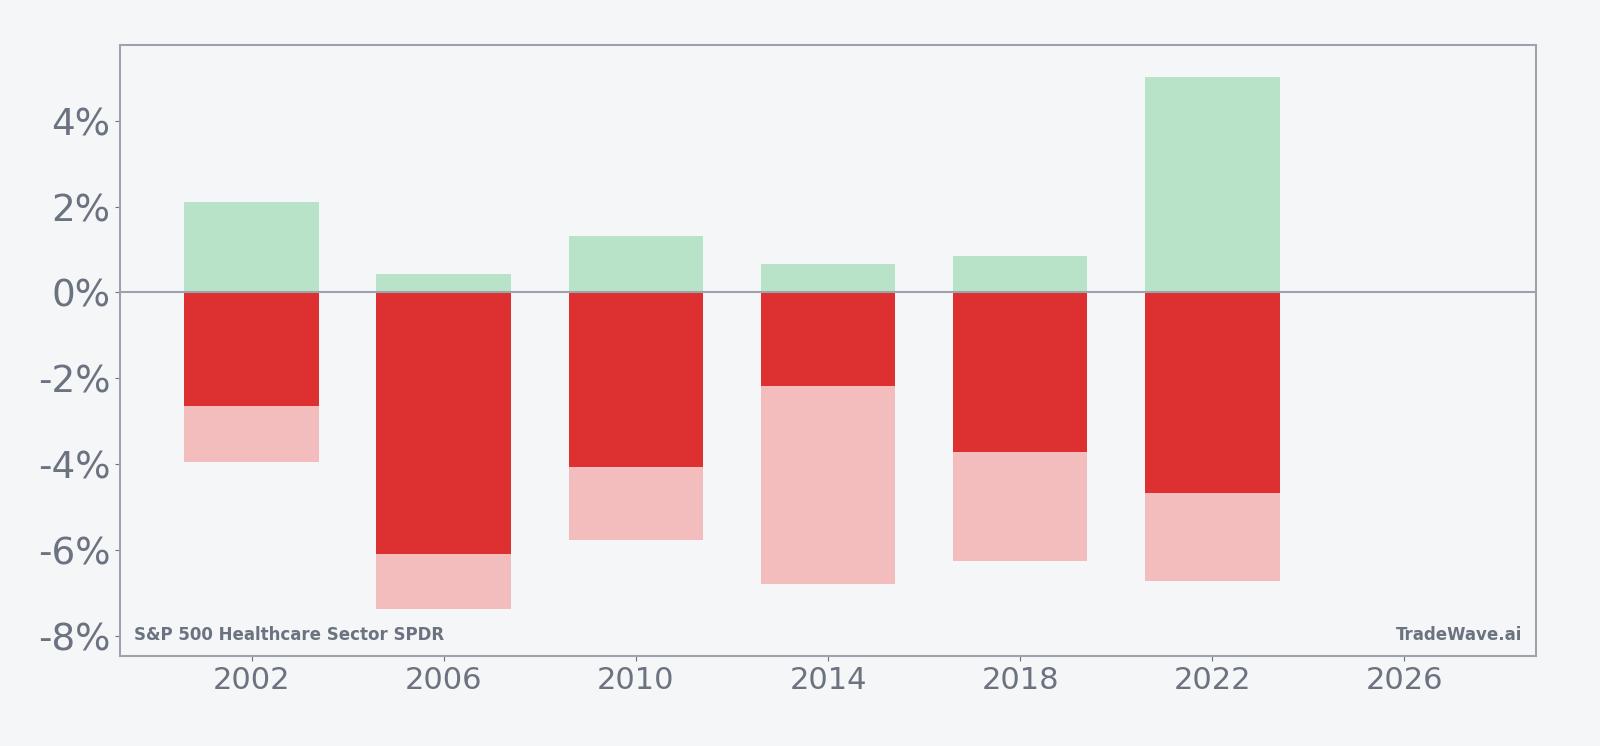
History does not guarantee future results, and the worst intraperiod drawdowns have approached 7% even in years that ultimately rewarded the short side.
Put together, the message from the seasonal data is straightforward: in the last six midterm election years, this 49-day stretch has been a clean six-for-six for shorts in XLV, with enough intraperiod noise to keep both bulls and bears on their toes.
Price and near-term drivers
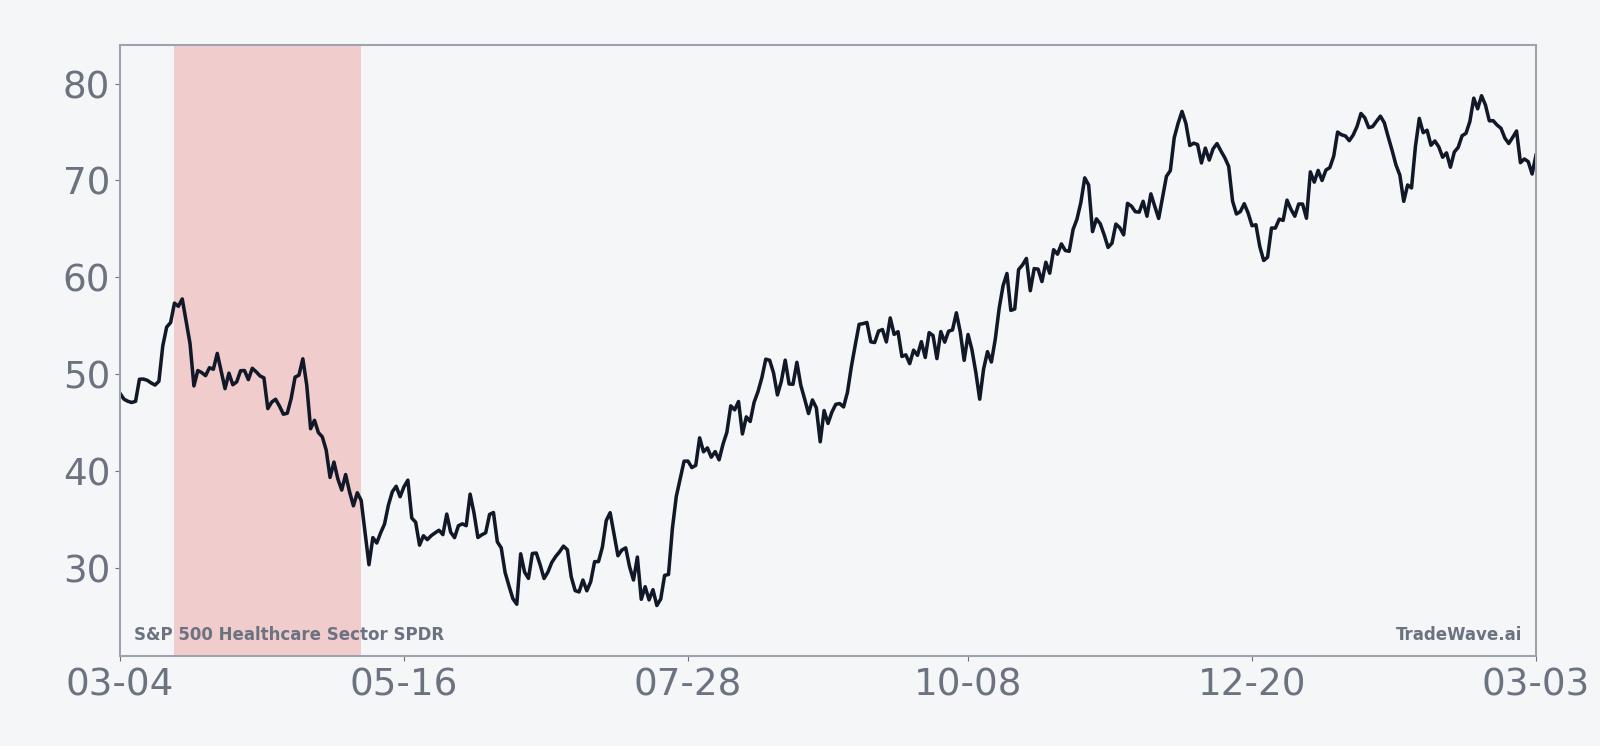
XLV does not trade on a single story, but the recent backdrop has been dominated by a powerful rebound and renewed focus on policy risk. In earlier cycles, healthcare stocks, including XLV, led gains even as broader U.S. equities struggled with tariff headlines and softer jobs data, underscoring the sector’s defensive appeal when macro volatility picks up.[1] In a separate rally phase, XLV climbed roughly 25% off an August low and moved into overbought territory, raising questions about how much good news was already priced into the ETF.[2]
Those episodes frame the current setup as the calendar approaches the new midterm-year window. Healthcare has shown it can outperform when investors seek safety, but it has also been sensitive to drug pricing ultimatums and reimbursement debates that tend to flare in the middle of the election cycle.[1] If similar headlines emerge this spring, they would land right inside a stretch that has historically leaned against XLV’s price.
The chart below situates XLV’s latest moves in its recent 12‑month context.
Macro and policy backdrop
The midterm election year often brings a different tone to healthcare policy. Lawmakers test tougher language on drug costs, insurers face scrutiny over premiums, and hospital systems sit in the crosshairs of budget debates. Earlier coverage of “Trump’s ultimatum to big pharma” illustrated how quickly that kind of rhetoric can ripple through the sector, with XLV and its components reacting as investors reassessed regulatory risk.[1]
At the same time, the sector has shown an ability to stage strong breakouts when macro fears ease. Analysis of prior cycles highlighted how XLV’s uptrend resumed after pauses, with the ETF leading S&P 500 sectors during certain rebounds and flashing classic breakout behavior.[2] That push-and-pull between policy overhangs and defensive demand is exactly what makes a consistent midterm-year seasonal pattern worth watching.
What to watch as the window opens
For this upcoming 49-day stretch, the first thing to watch is how XLV behaves around the Mar 18 start date relative to its recent range. A quick rejection from recent highs or a shift toward heavier intraday selling would rhyme with prior midterm windows, where the short side often gained traction early. Conversely, a clean breakout to fresh highs that holds would mark a clear departure from the six-for-six historical record.
Policy and headline risk are the second key axis. Any renewed focus on drug pricing, Medicare reimbursement or tariff-linked supply chain costs for healthcare equipment would land in a part of the calendar that has previously coincided with downside pressure on XLV.[1] Traders will be watching whether such stories trigger the kind of sharp intraperiod swings that showed up in the maximum favorable and adverse excursions in years like 2006 and 2022.
Finally, volatility inside the window will matter as much as the end result. If XLV chops sideways with smaller swings than the roughly 6% intraperiod drawdowns seen in several past cycles, it would suggest that the sector’s risk profile is changing even if the ETF finishes modestly lower. On the other hand, a repeat of wide, two-way moves followed by a lower close would reinforce the idea that this midterm-year slice remains a uniquely tricky period for healthcare exposure.