CBOE Volatility Index (VIX) Has Fallen in 10 of 11 Years During This 125-Day Seasonal Run
The CBOE Volatility Index is sitting near the middle of its 52-week range just as a historically bearish 125-day seasonal window for volatility moves into its first week.

Key takeaways
- CBOE Volatility Index is trading at 27.19, about 54.8% below its 52-week high of 60.13 and roughly 103.1% above its 52-week low of 13.38.
- The current 125-day seasonal window, which began on Mar 11, has historically favored lower VIX levels, aligning with a short volatility trade direction.
- Across the past 11 iterations, the pattern has been profitable for shorts in 91% of years, with 10 winners and 1 loser.
- Winning years in this window have seen average VIX declines of 24.16%, while the all-years average, including the lone losing year, is a still-strong 21% move in the short direction.
- Intraperiod swings have been large, with some years showing maximum favorable drops above 60% but also adverse spikes above 50%, underscoring the risk of sharp volatility shocks.
- A flat VIX futures curve points to expectations of short-lived volatility bursts rather than a sustained regime shift, which fits the historical pattern of big swings that ultimately resolve lower.
According to historical data from TradeWave.ai, this stretch of the calendar has behaved very differently from an average month for volatility traders. The next section walks through how that pattern has played out in prior years and what it means for the current window.
Seasonal window
CBOE Volatility Index has fallen in 10 of the past 11 years during this 125-day window, with winning short trades averaging 24.16% gains. The latest iteration started on Mar 11 and finds VIX at 27.19, roughly mid-range between a 52-week high of 60.13 and a low of 13.38, after a 31.99% jump over the past month.
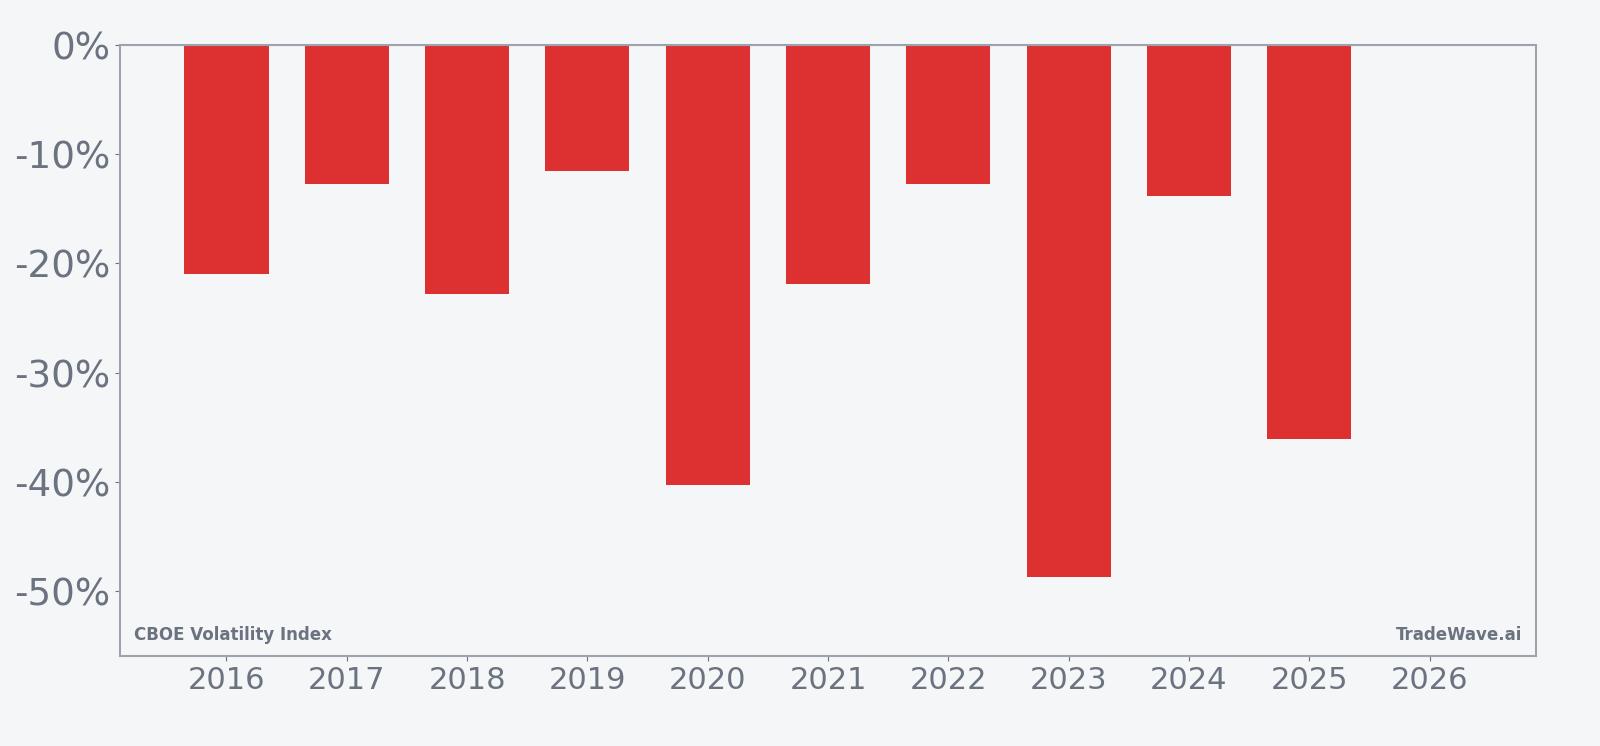
Historically, this has been a short-volatility regime. The trade direction is explicitly short, and in 91% of years the VIX finished the window lower than it started, delivering 10 winners against just 1 losing year. Average winner performance of 24.16% means that in the typical successful iteration, VIX has dropped by roughly a quarter from its entry level, while the all-years average of 21% shows that even after including the one losing year, the bias toward lower volatility has been strong.
The per-year table shows how that has looked in practice. In 2023, for example, VIX entered the window at 26.52 and exited at 13.61, a 48.68% decline that lined up with a powerful equity rally and fading demand for protection. At the other end of the spectrum, 2022 was the lone losing year for shorts, with VIX slipping only 12.78% from 30.75 to 26.82 as macro shocks kept implied volatility elevated into the summer.
Intraperiod swings have been anything but quiet. Maximum favorable excursions, the best point-to-trough moves in VIX during the window, have reached as high as 123.37% in 2025, when VIX more than doubled at one point before ultimately closing the window 36.11% lower. On the flip side, maximum adverse excursions, the worst drawdowns against the short, have run as deep as 56.33% in 2020, when volatility spiked sharply before easing back.
That combination of large maximum favorable and large maximum adverse moves paints this as a high-variance window. The TradeWave Ratio of 1.82 indicates that VIX has typically traveled meaningfully in the short direction within the window, even when the final close did not capture the full swing. For traders, the message is that the path has often been rough, even when the destination has favored lower volatility.
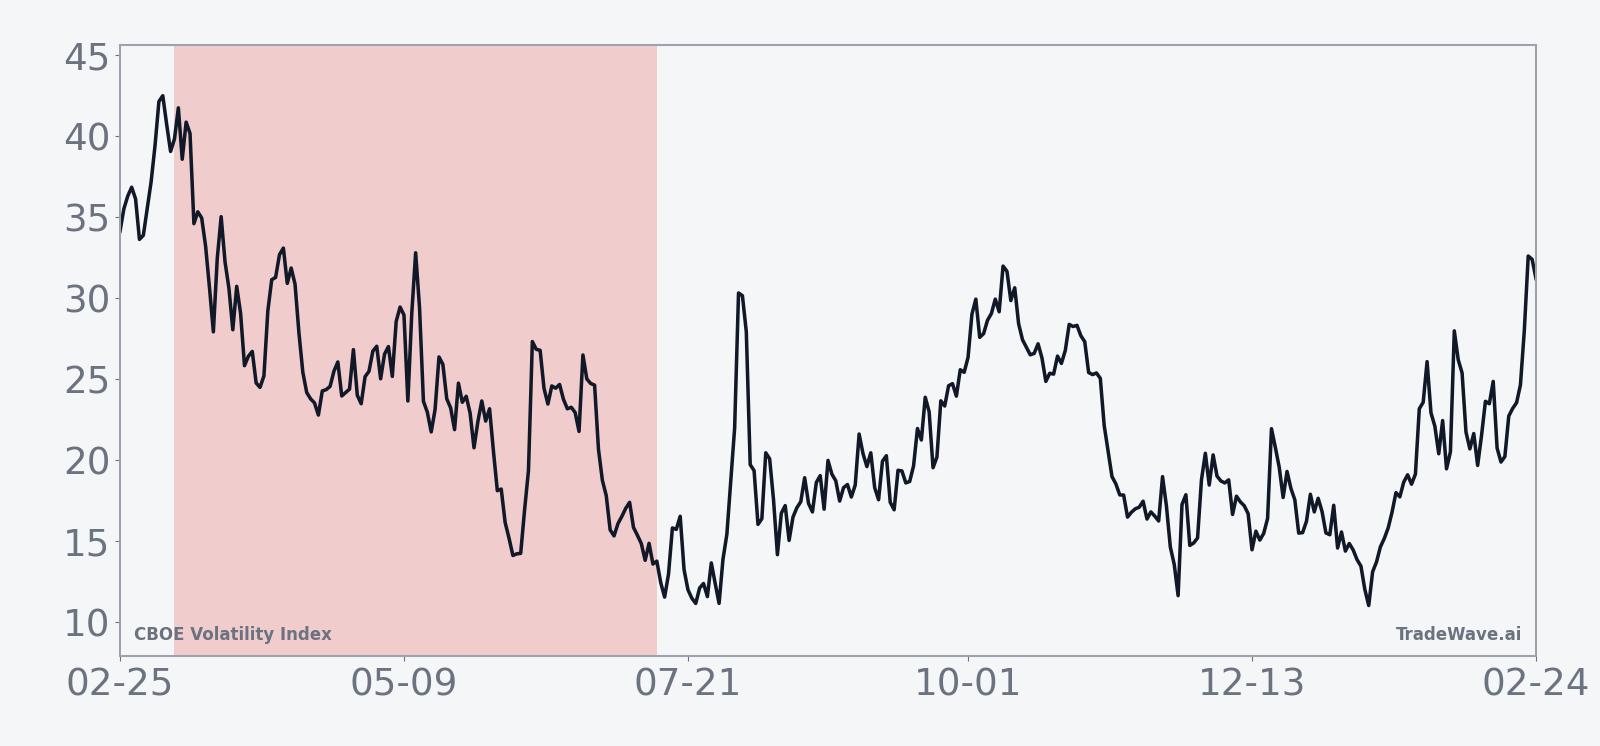
The 10-year seasonal trend chart smooths those individual years into an average path. It shows VIX often holding firm or even popping early in the window, then grinding lower over the following weeks as equity markets stabilize and demand for hedges fades. The typical pattern is not a straight line down but a series of spikes that fail, with lower highs in volatility as the window progresses.
A second view that layers net returns with best and worst intraperiod swings highlights how much room VIX has historically had to move before settling lower.
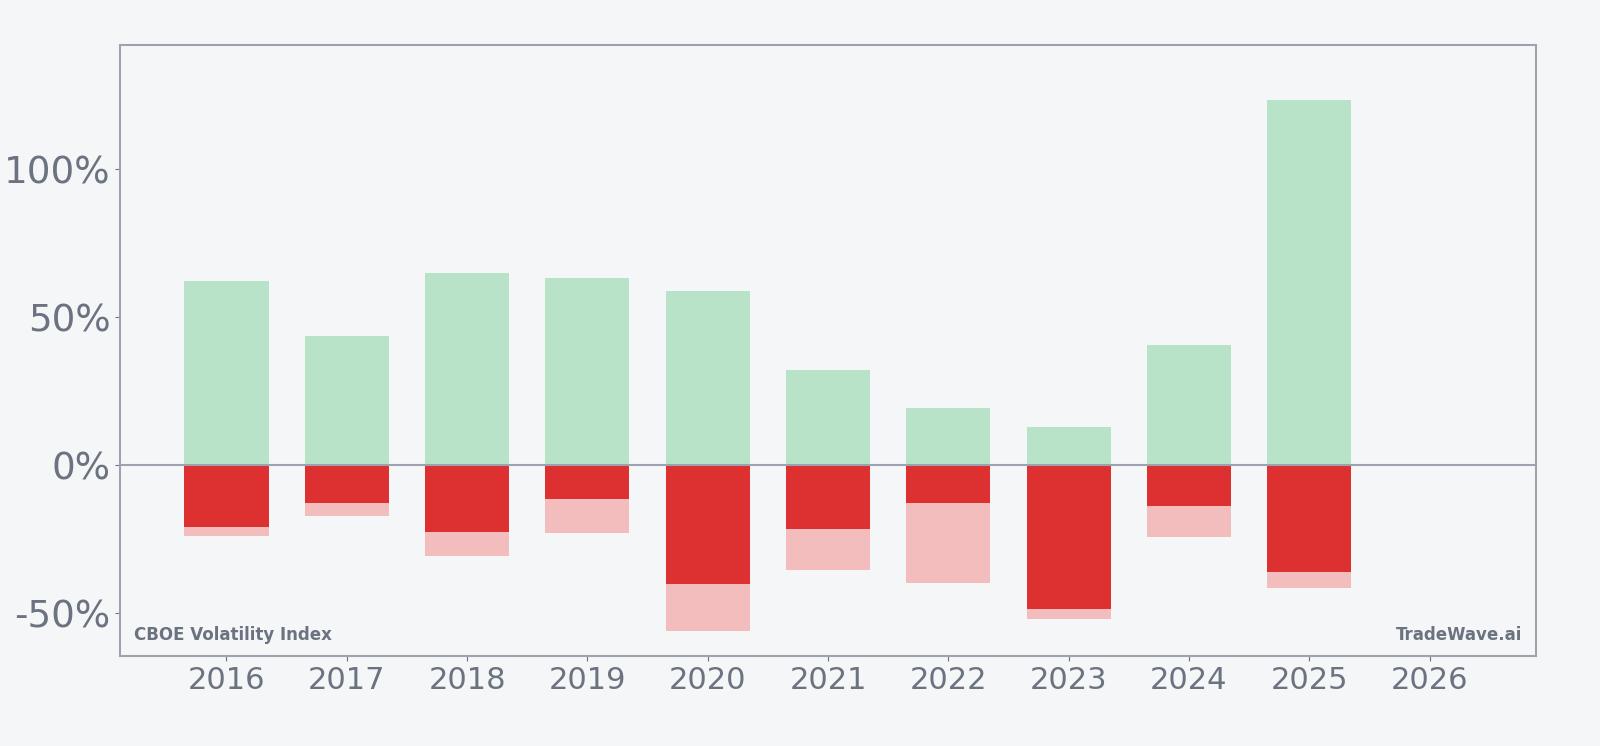
Viewed through that lens, the pattern is clear: most years ultimately reward short-volatility positioning, but many also feature one or more sharp volatility shocks along the way. Some of the biggest winning years for shorts, such as 2020 and 2025, also carried some of the deepest adverse spikes before VIX rolled over. Add it up: 10 for 11 in favor of lower VIX into this window, but with a history of big swings that can punish poor timing.
History does not guarantee future results; adverse excursions can be large even in winning windows, and volatility spikes have repeatedly tested short positions before the seasonal pattern has played out.
Price and near-term drivers
CBOE Volatility Index closed at 27.19 on Mar 13, down 0.37% on the day, after trading between 24.67 and 28.47. That leaves VIX about 54.8% below its 52-week high of 60.13 and roughly 103.1% above its 52-week low of 13.38, with a 31.99% gain over the past month as investors have rebuilt hedges. The current level sits in a zone where volatility is elevated relative to last year’s troughs but still far from the crisis readings seen during tariff scares and policy shocks in 2025.[1]
The chart below situates the latest move in its recent multi-month context.
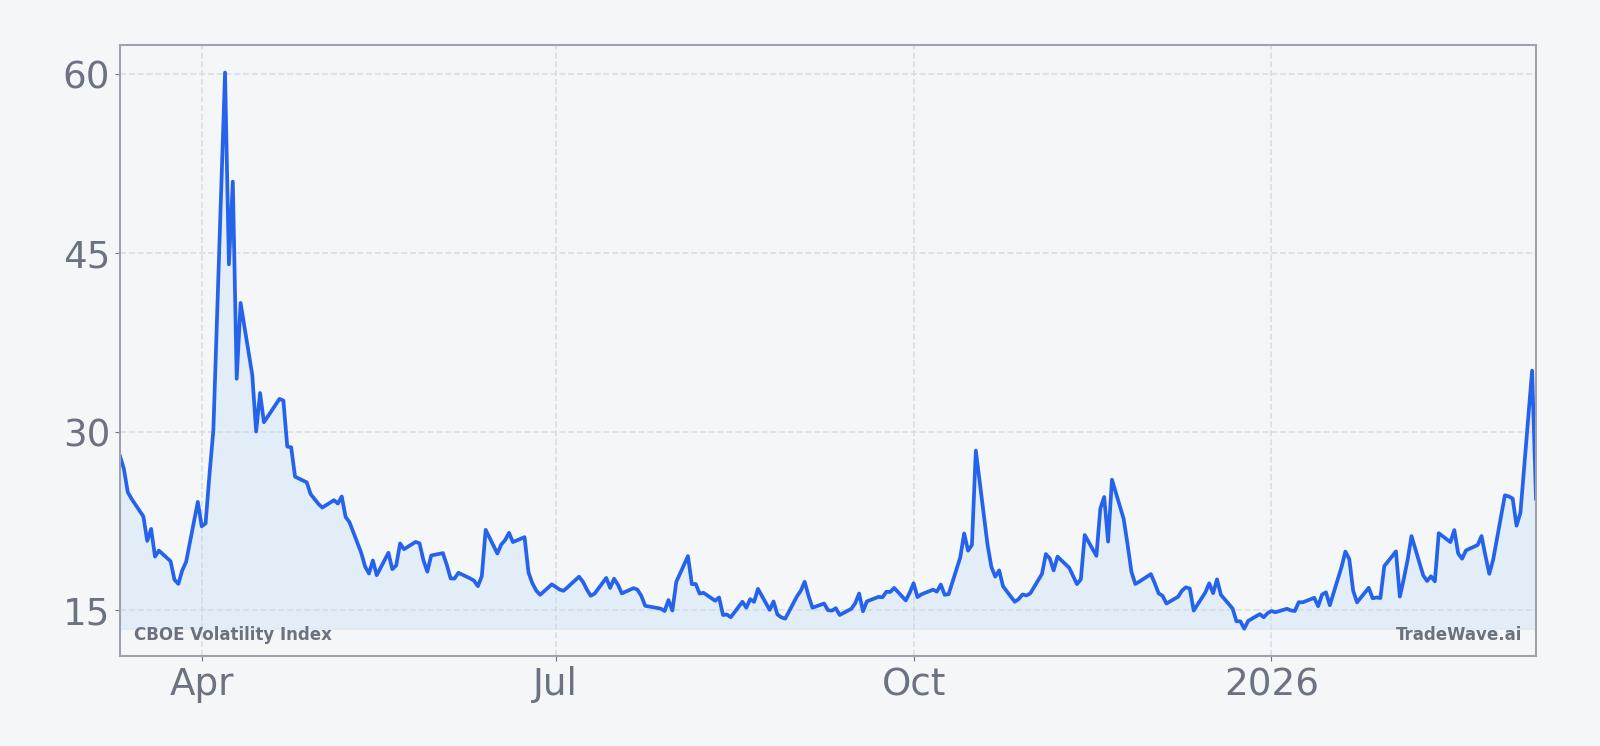
In 2025, episodes of tariff turmoil and policy uncertainty pushed VIX above 40 on several occasions, including a surge of more than 50 points in early April that briefly took the index to crisis-like territory before it cooled off.[1] Those spikes were driven by investors rushing into S&P 500 and Nasdaq protection, with put spreads and outright VIX calls used as insurance against deeper equity drawdowns.[1] The pattern in those episodes was familiar: a fast, news-driven jump in implied volatility followed by a relatively quick retracement once the immediate shock passed.
That behavior lines up with the current futures backdrop. The VIX futures curve is described as flat, a structure that typically signals expectations for short-lived volatility bursts rather than a sustained regime of stress. In practice, a flat curve has often coincided with markets that are nervous but not yet in full risk-off mode, where volatility spikes on headlines but mean-reverts as macro data and policy signals stabilize.
Because VIX tends to move inversely to equities, a seasonal window that historically favors lower volatility has often overlapped with periods of steadier or rising stock prices. For equity traders, the key question is not whether volatility can spike, but whether those spikes stick. The historical record for this window suggests that even when shocks hit, they have more often than not faded over the subsequent weeks, leaving short-volatility positions ahead by the time the 125 days are up.
What to watch in this VIX window
The first thing to watch is how VIX behaves around the 30 level. In prior years, readings in the high 20s and low 30s have often marked the transition from panic to normalization, with volatility either breaking higher into a more serious stress episode or rolling over as equity markets regain their footing. A sustained move back toward the mid-teens during this window would be consistent with the historical pattern of lower VIX by the end of the period.
Second, monitor the shape of the VIX futures curve. A shift from today’s flat profile into a pronounced contango, where longer-dated futures trade well above the spot index, would signal that markets expect volatility to decay over time, which has historically aligned with the short-volatility bias in this window. By contrast, a move into backwardation, with front-month futures above later contracts, would indicate more persistent stress and would run against the typical seasonal script.
Third, keep an eye on options activity in major equity benchmarks. In 2025, heavy demand for S&P 500 and Nasdaq protection via put spreads and VIX calls accompanied some of the biggest volatility spikes, but those flows eventually faded as policy headlines cooled.[1] If a similar pattern of intense but short-lived hedging emerges in the coming weeks, it would fit the historical template of sharp intraperiod spikes that ultimately give way to lower VIX by the end of the window.
Finally, watch how equity breadth responds to any volatility shocks. A VIX spike that coincides with only modest damage to broader stock indexes and quick stabilization in sector leaders would lean toward the historical outcome of fading volatility. A spike that comes with persistent weakness across sectors and little sign of dip-buying would raise the odds that this year looks more like the lone losing iteration in the sample, where volatility stayed stubbornly high.
Put together, the message from history is straightforward: this 125-day stretch has usually rewarded patience on the short-volatility side, but the path has rarely been smooth. Traders watching VIX over the next few months will need to respect both sides of that record.