CBOE Volatility Index (VIX) Has Dropped in This 79-Day Window 10 Years Straight
The CBOE Volatility Index is trading well below its 52-week peak just as a historically bearish seasonal window for volatility approaches in late April.

Key takeaways
- A 79-day seasonal window for the CBOE Volatility Index starting Apr 26 has favored lower volatility in every one of the past 10 years.
- The pattern is short-directed, with 100% Percent Profitable, 10 winners and 0 losers, and an average profit of 13.91% for volatility sellers.
- Across the decade, the cumulative return for the short setup in this window totals 251%, with a Sharpe ratio of 1.15 and a TradeWave Ratio of 2.05.
- Intraperiod swings have been large: in 2016 VIX spiked as much as 91.4% from entry before ultimately finishing lower, while 2018 saw a worst drawdown of 32.82% against the short.
- Today VIX sits at 27.44, about 52.7% below its 52-week high of 57.96 and roughly 105.1% above its 52-week low of 13.38, leaving plenty of room for either renewed stress or a grind lower.
- History suggests this window often starts with sharp volatility bursts before mean-reverting, a profile that rewards patience but punishes poor risk control.
According to historical data from TradeWave.ai, this late-spring stretch in volatility has behaved very differently from an average month on the calendar, and the next iteration is now less than a month away.
Seasonal window
CBOE Volatility Index has declined in this 79-day late-April window in all 10 of the past years, averaging 13.91% gains for traders positioned short. Today VIX trades at 27.44, about 52.7% below its 52-week high of 57.96 and roughly 105.1% above its 52-week low of 13.38, a mid-range level that leaves room for either another scare or a seasonal fade.
Historically, this window has been a clean short-volatility regime. Percent Profitable sits at 100%, with 10 winners and 0 losers across the decade, and the average profit of 13.91% reflects how often VIX has drifted lower after late April. The median profit of 10.74% shows that even the middle-of-the-pack years have delivered meaningful downside in implied volatility rather than relying on a single outlier.
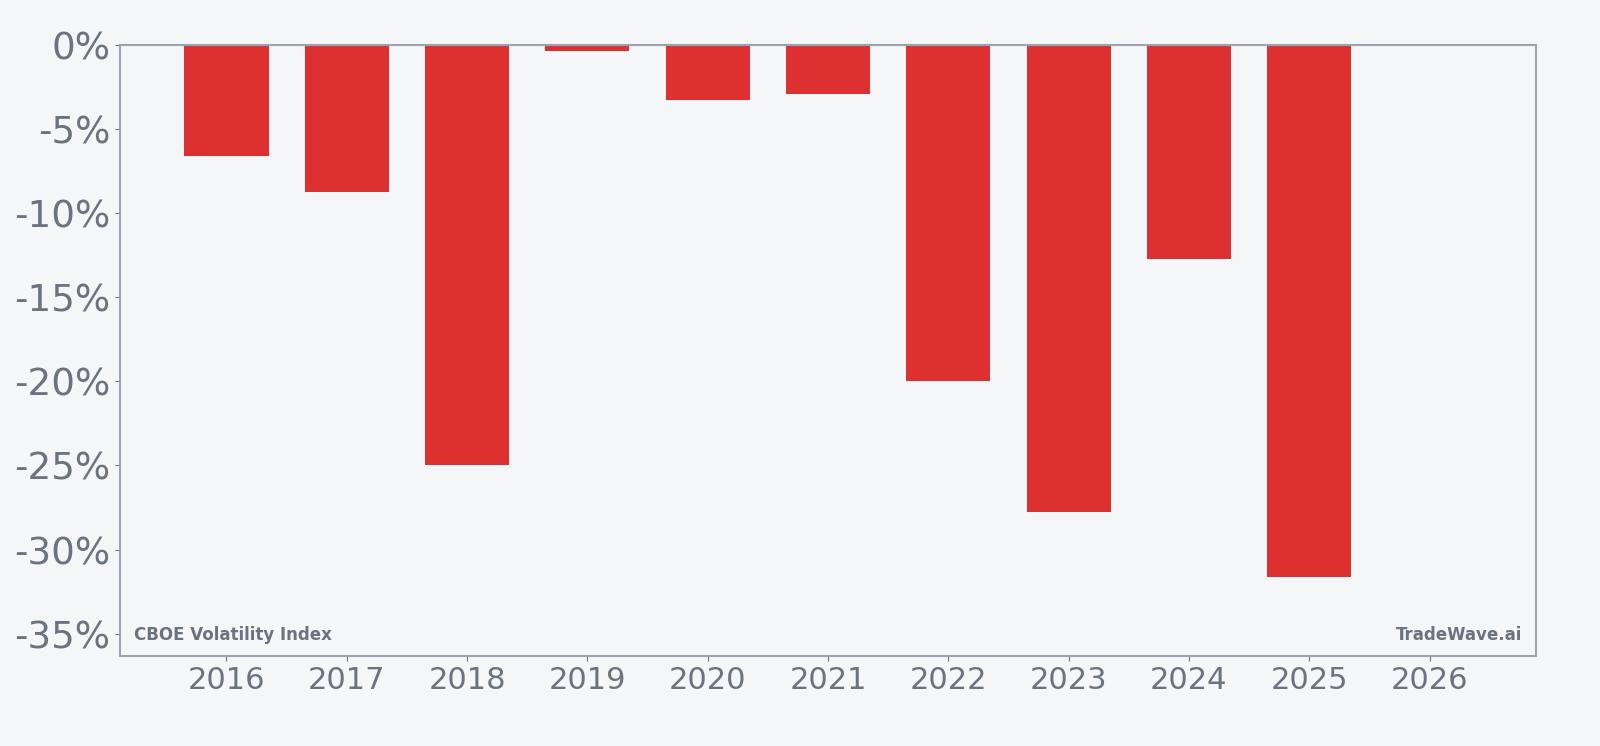
The per-year table shows how that consistency has played out. In 2018, for example, VIX fell 25.0% from entry to exit, while 2025 delivered a 31.61% decline as volatility bled off from a high starting point. Even the softest year in the sample, 2019, still finished with a small 0.39% gain for the short, underscoring how rarely this window has punished traders fading volatility spikes once the calendar flips past late April.
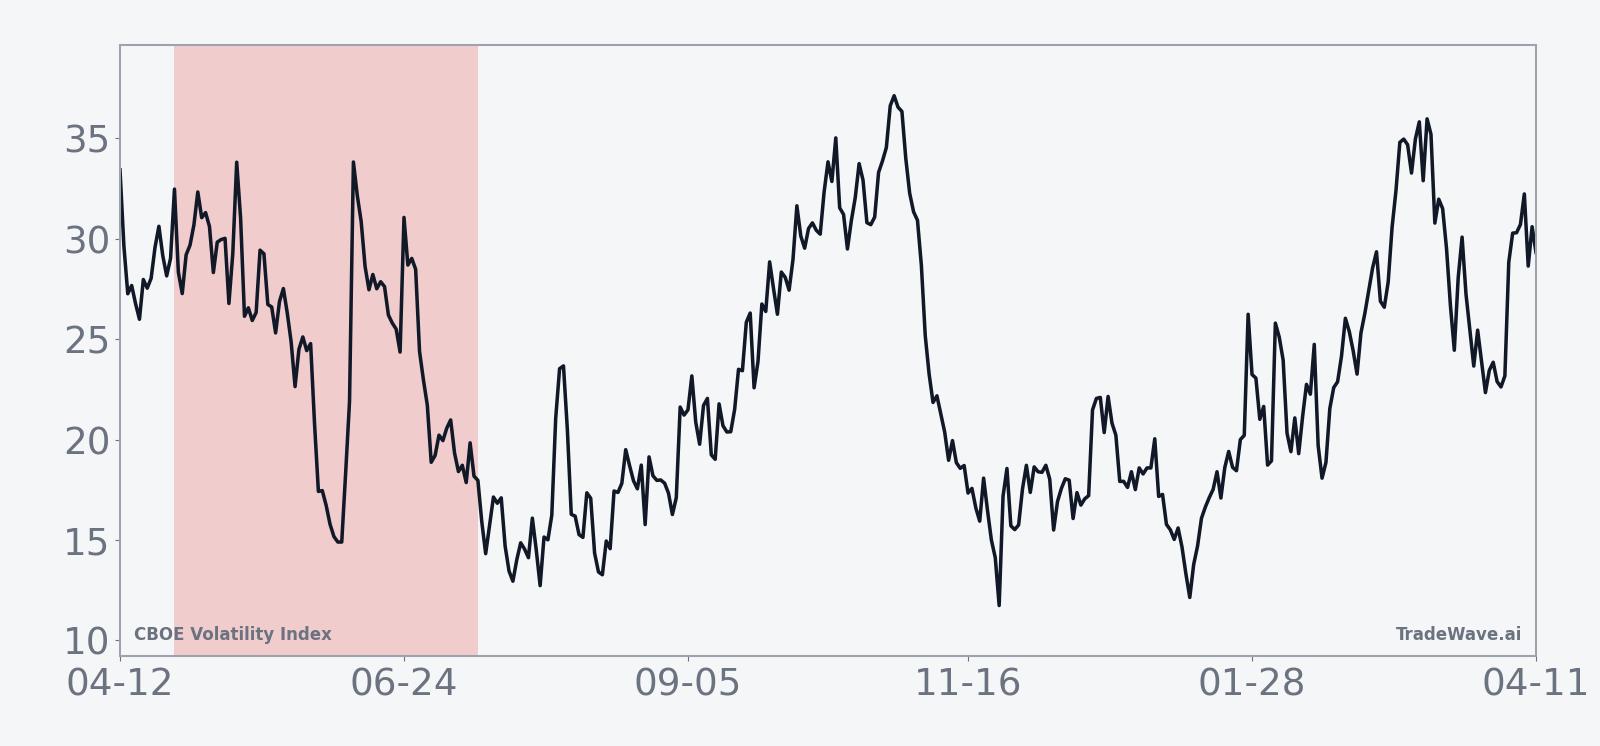
The 10-year seasonal trend chart shows a familiar pattern: VIX often holds up or even pops early in the window, then grinds lower into the back half. That shape fits the idea that equity markets can still wobble around spring macro headlines before settling into calmer summer trading, with implied volatility compressing as realized swings fade.
A second view that layers net returns with peak run-ups and worst drawdowns highlights how bumpy the ride has been inside an otherwise consistent pattern.
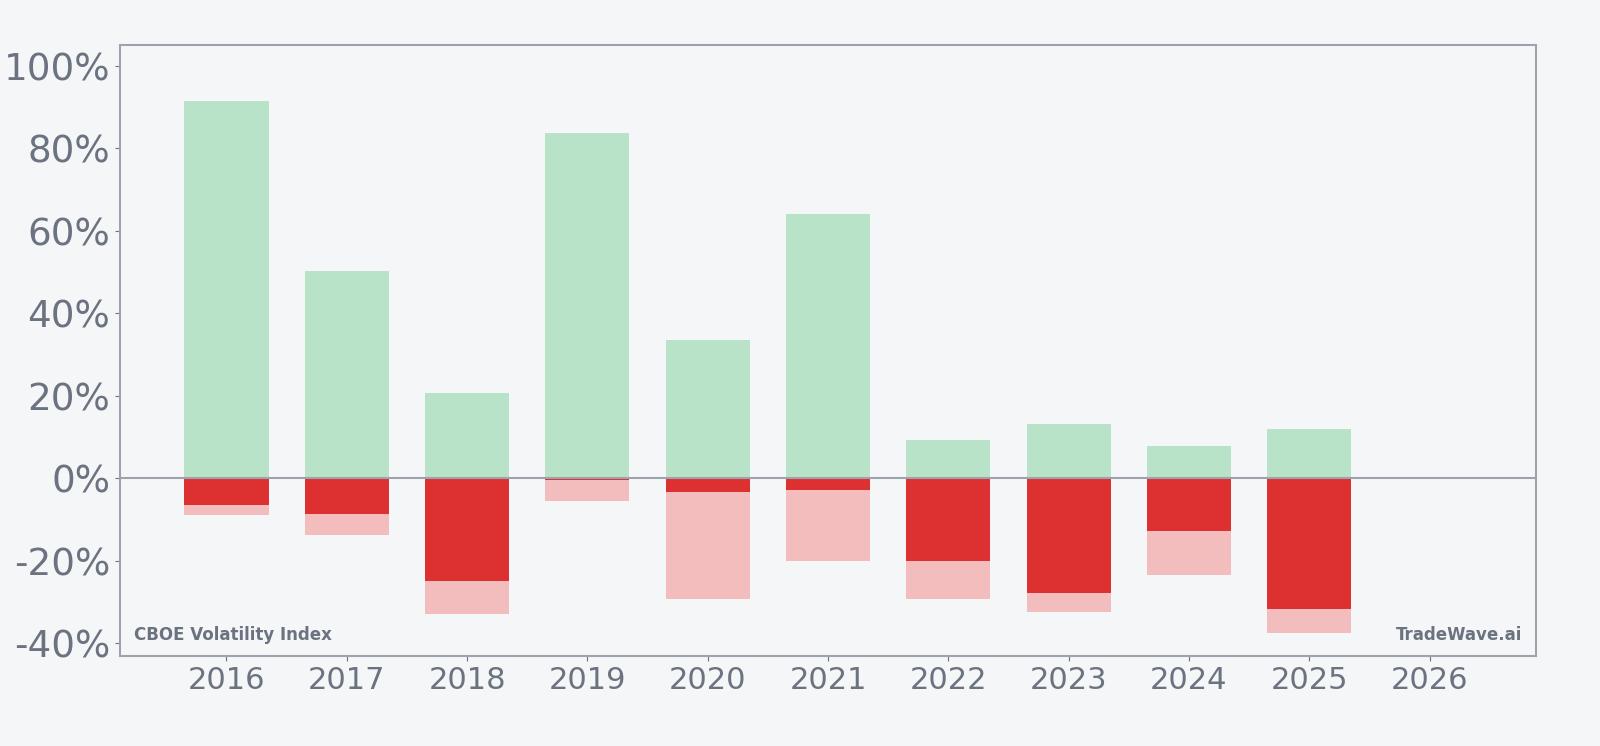
The bars with maximum favorable and adverse excursions tell the risk story. In 2016, VIX rallied as much as 91.4% from entry before ultimately finishing 6.59% lower, a reminder that short-volatility trades can be right on direction but painful on the path. In 2018 and 2022, worst drawdowns of 32.82% and 29.18% against the short show how quickly volatility spikes can hit before mean reversion kicks in. Add it up: the window has been 10 for 10 for shorts, but the MFE/MAE profile says traders have needed strong stomachs and tight risk rules.
History does not guarantee future results, and adverse excursions can be large even in winning windows, so position sizing and risk limits matter as much as the seasonal edge.
Price and near-term drivers
VIX closed at 27.44 on Mar 26, up 8.33% on the day and roughly 47.29% higher over the past month, a sharp rebound from the low-teens levels seen earlier in the year. That still leaves the index about 52.7% below its 52-week high of 57.96 and roughly 105.1% above its 52-week low of 13.38, a middle-of-the-range reading that reflects elevated but not crisis-level fear.
Recent spikes have been tied to geopolitical and policy shocks rather than a single macro theme. On Mar 18, 2026, VIX jumped to 23.42 as Middle East conflict rattled global markets, even as U.S. equities found support from a rebound in large-cap technology shares.[1] In 2025, similar bursts of volatility followed renewed U.S.-China trade tensions and tariff threats, with the index repeatedly surging into the 40s and 50s during episodes of market stress.[2] Those episodes underline a familiar pattern: implied volatility tends to explode higher when policy risk or geopolitical uncertainty hits, then bleed lower as investors recalibrate and equity markets stabilize.
Options activity has often amplified those swings. In Apr 2025, one widely discussed strategy involved buying VIX put options to monetize a volatility spike tied to trade-war headlines, alongside short-term hedges via October put spreads.[3] That kind of positioning shows how quickly traders can pivot from using VIX calls as protection to using puts as a way to capture the decay once the panic phase passes. Volume has tended to surge during these episodes, including days when VIX jumped to 60 and above 50 amid tariff turmoil, signaling intense demand for both hedges and speculative trades.[4]
For equity investors, the current setup is a familiar tension. VIX is elevated enough to reflect real concern but far below the crisis peaks seen in 2025, when the index repeatedly traded above 40 and even 60 during tariff and rate-shock scares.[4] If equities can hold their footing into April, the historical pattern suggests volatility sellers may again find a tailwind from the calendar. If fresh macro shocks hit, the same seasonal window has shown that VIX can still stage large intraperiod spikes before reverting lower, which is why many institutional desks pair short-volatility exposure with tactical hedges rather than running naked shorts.
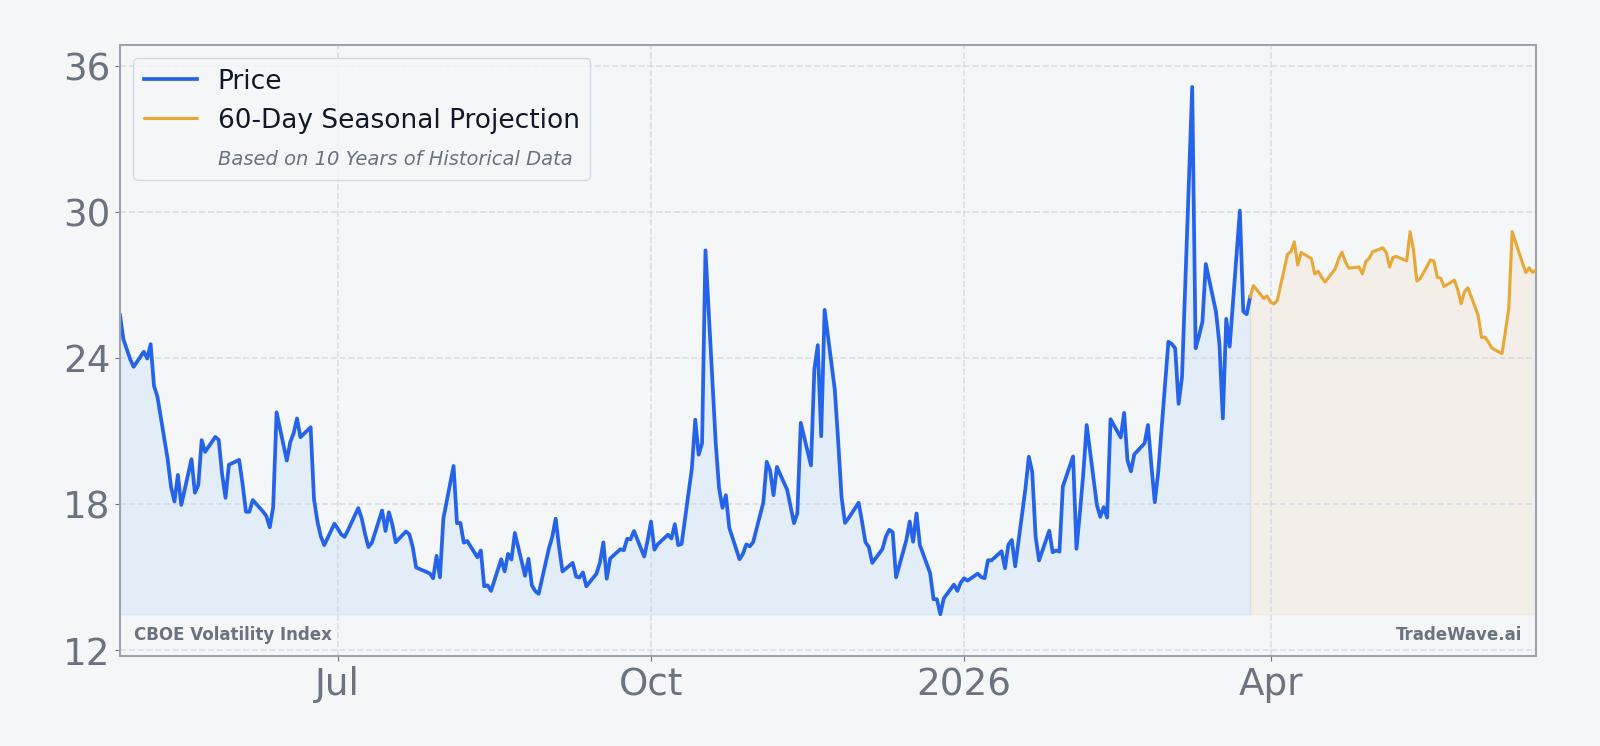
The chart below situates the latest move in its recent multi-month context and overlays the near-term seasonal projection.
What to watch as the window opens
The next test of this 10-for-10 seasonal record begins on Apr 26 and runs for 79 trading days into mid-summer. For traders, the key question is not whether the pattern repeats perfectly, but how VIX behaves relative to its own history once the window is live.
First, watch how VIX trades around macro headlines in late April and May. In prior years, the index has often seen its maximum favorable move for shorts later in the window, after early spikes tied to policy or geopolitical news faded. A similar sequence this year, with sharp but short-lived jumps followed by a steady grind lower, would fit the historical script.
Second, monitor options positioning and volume. When volatility has surged in the past, traders have quickly rotated into VIX puts and spread structures to capture the subsequent decay, as seen in the trade-war episode in Apr 2025.[3] If another shock pushes VIX higher into the start of this window, a rapid build-up in put open interest and heavy volume in short-dated structures would signal that the market is again leaning into the seasonal tendency for volatility to compress.
Third, keep an eye on the relationship between VIX and equity breadth. Calm, well-supported stock markets typically coincide with lower implied volatility, while broad-based equity drawdowns tend to push VIX sharply higher. If breadth improves into early summer and major indices hold their ground, that backdrop would align with the historical pattern of lower VIX by the end of the window. If breadth deteriorates and stress migrates across sectors, the path could look more like 2016 or 2018, when VIX shorts ultimately worked but endured deep intraperiod drawdowns.
Finally, risk management will matter as much as the seasonal edge. The last decade shows that this window has been friendly to volatility sellers on final outcomes, but the MFE/MAE profile is a reminder that the ride can be rough. Traders who respect those historical swings, size positions accordingly, and stay alert to macro catalysts will be best placed to decide whether this 79-day stretch is another opportunity to lean into the calendar or a year when the pattern breaks.