Blackstone Inc. (BX) Has Rallied in 10 of 10 Years in This 153-Day Window, Averaging 20.56%
Blackstone Inc. is stepping into a historically powerful 153-day stretch just as the stock trades deep below its 52-week high and investors weigh a strong deal pipeline and earnings beat.

Seasonal window
Blackstone Inc. has posted gains in this 153-day window in 10 of the past 10 years, averaging a 20.56% profit for long positions. The latest iteration begins with BX at $106.78, up 4.6% on the day and about 41.5% below its 52-week high of $182.49.[1] That combination of a strong historical tailwind and a stock trading well off its highs is the backdrop investors are walking into as this new seasonal regime opens.
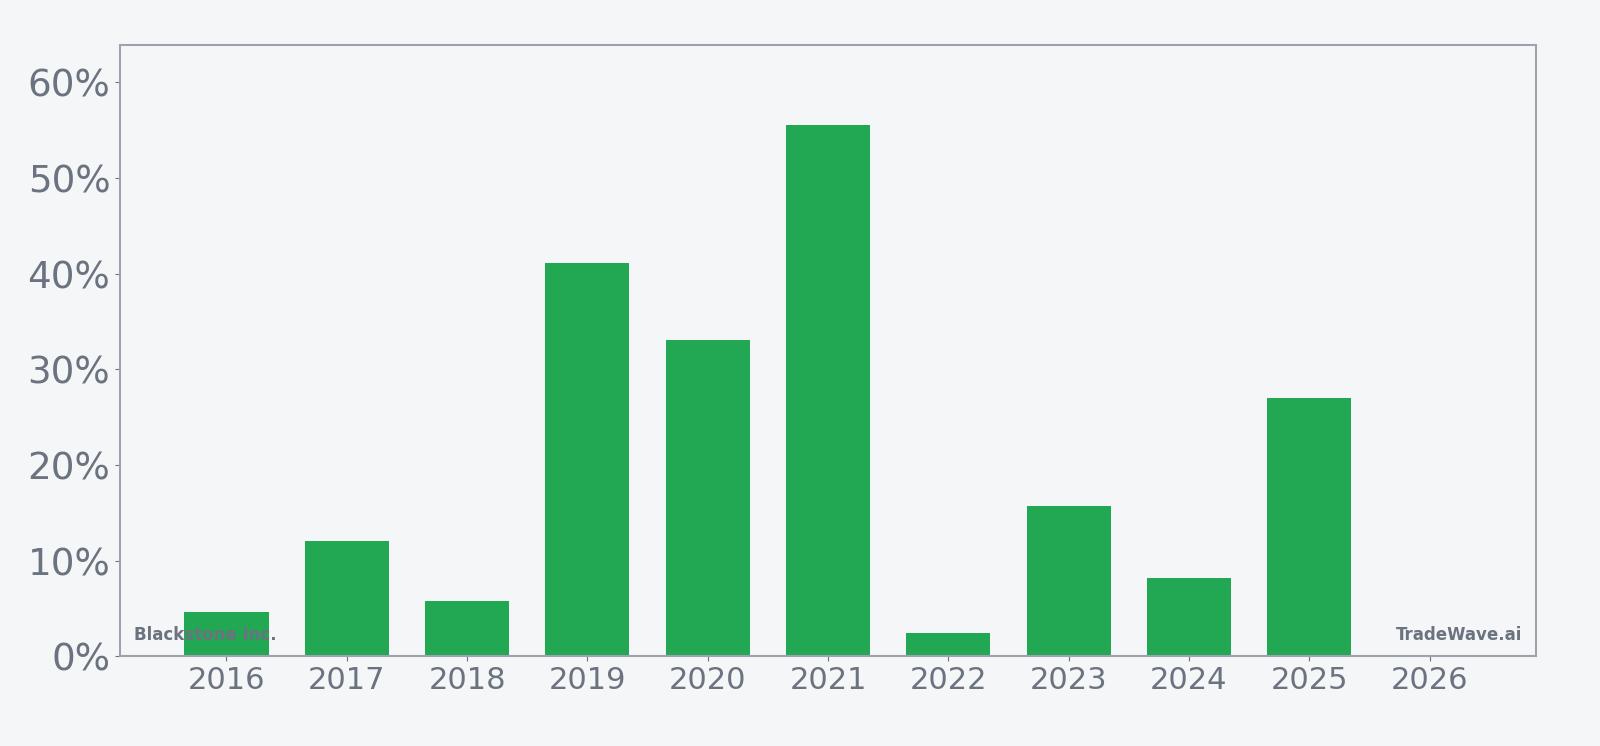
Across the last decade, every single iteration of this window has been profitable for a long stance in Blackstone, with the median gain at 13.88% and cumulative return across all ten windows at 490%. The strongest year in the sample was 2021, when BX rallied 55.56% between the March 14 start and the end of the 153 trading days, while the softest outcome was 2016 with a still-positive 4.68% gain.
The average winner’s 20.56% gain sits alongside a standard deviation of 17.92%, which means outcomes have been wide but skewed to the upside. The Sharpe ratio of 1.05 for this pattern points to a historically favorable risk-adjusted profile based on end-of-window results, even though the path inside the window has often been bumpy.
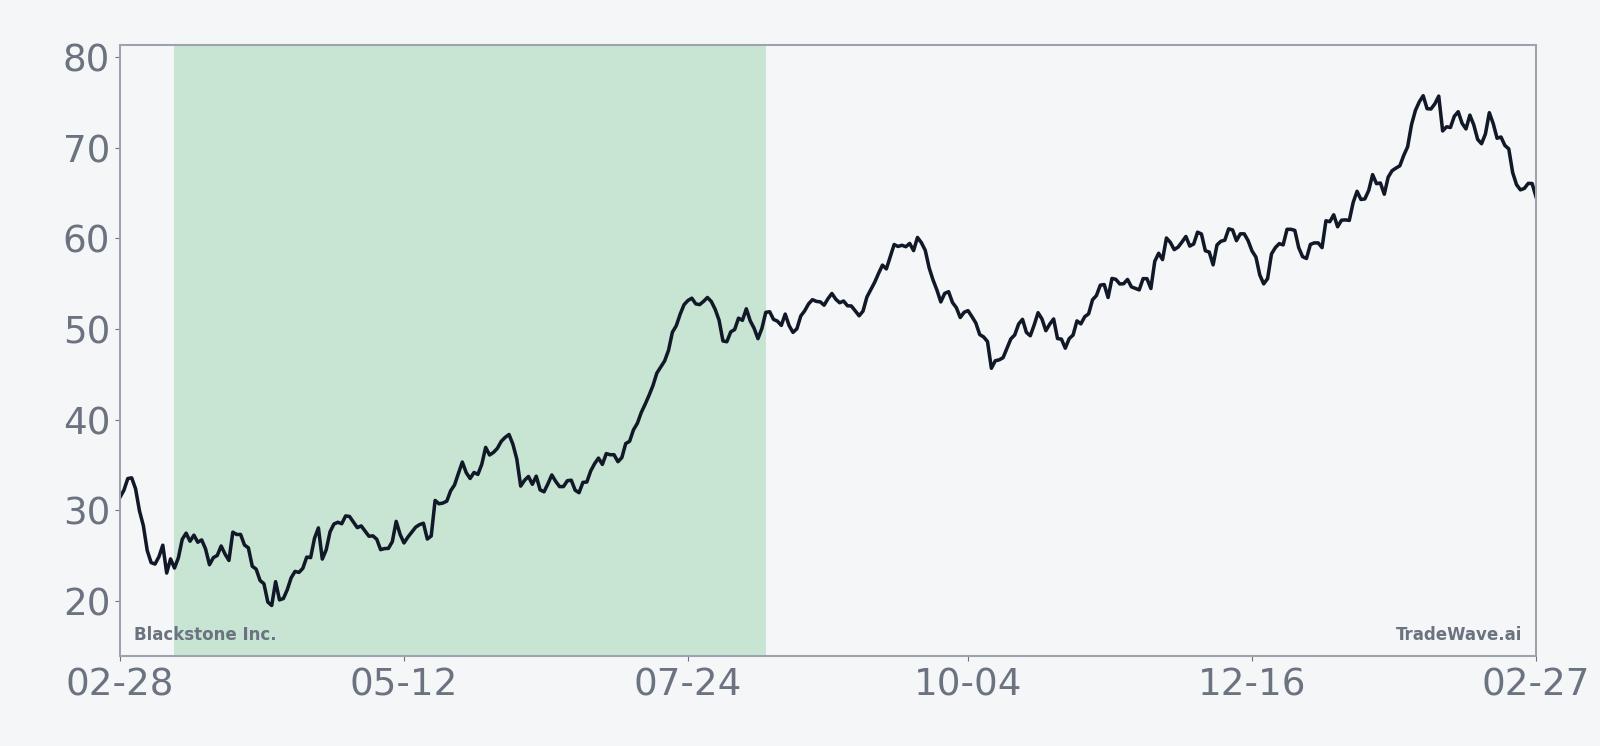
The historical seasonal trend chart shows gains tending to build in stages rather than in a straight line. In several years, the pattern has featured an early push higher, a mid-window consolidation, and then a second leg of strength into the back half of the regime.
Intraperiod peaks and drawdowns show how far BX has tended to run in both directions before the window closes.
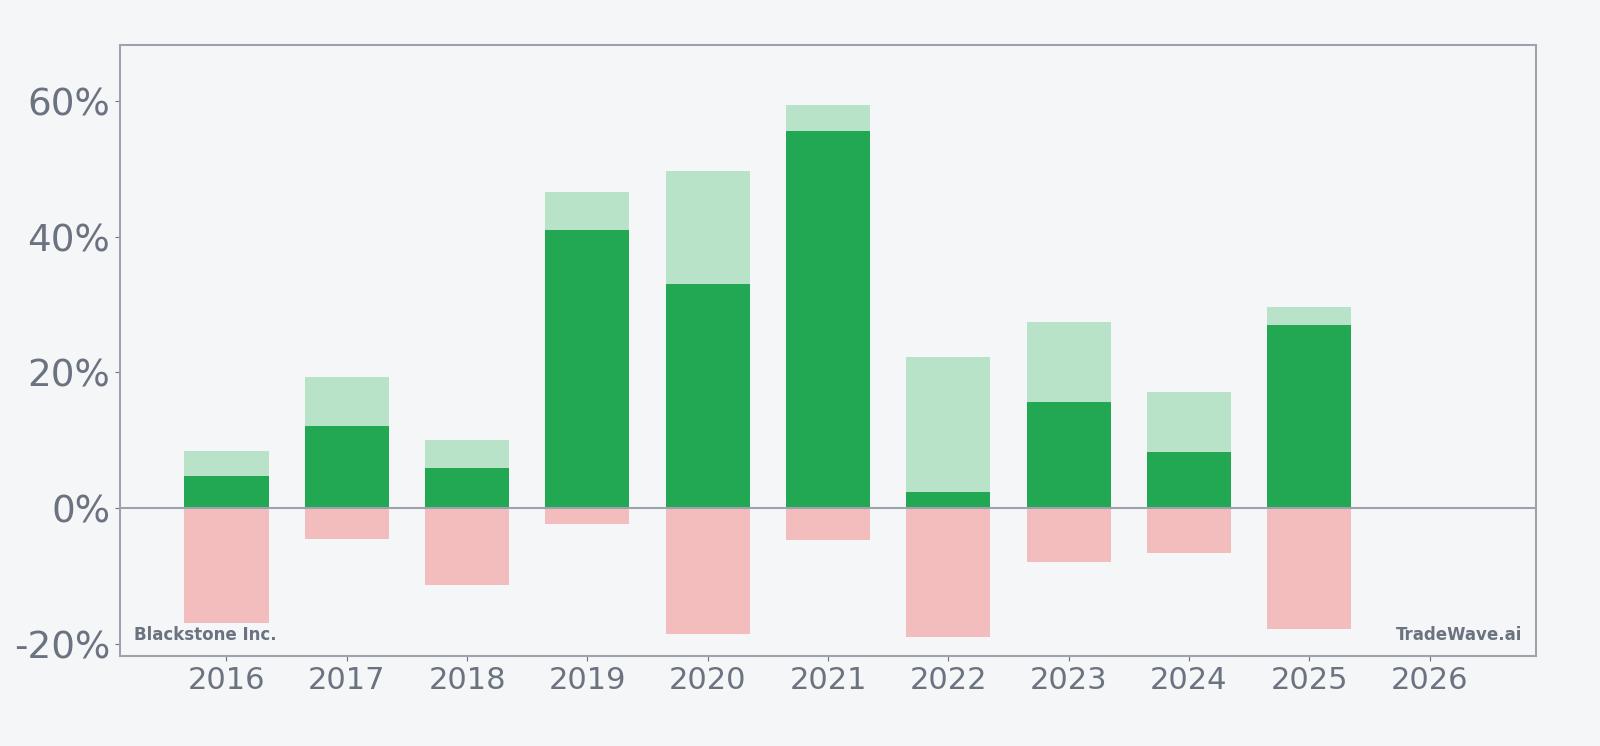
The maximum favorable move has been large in several years, with 2020 showing a 49.65% peak run-up and 2019 and 2021 also posting maximum favorable excursions above 40%. At the same time, the worst intraperiod drawdowns have been meaningful, with maximum adverse moves of -18.58% in 2020, -19.05% in 2022, and -17.91% in 2025, underscoring that even winning years have included sharp pullbacks.
History does not guarantee future results; adverse excursions can be large even in windows that ultimately finish higher.
Add it up: ten for ten winning years, double-digit average gains, and a track record of sizable swings both up and down inside the window. For traders and investors watching BX from here, this slice of the calendar has been one of the most consistently favorable stretches on the tape.
Price and near-term drivers
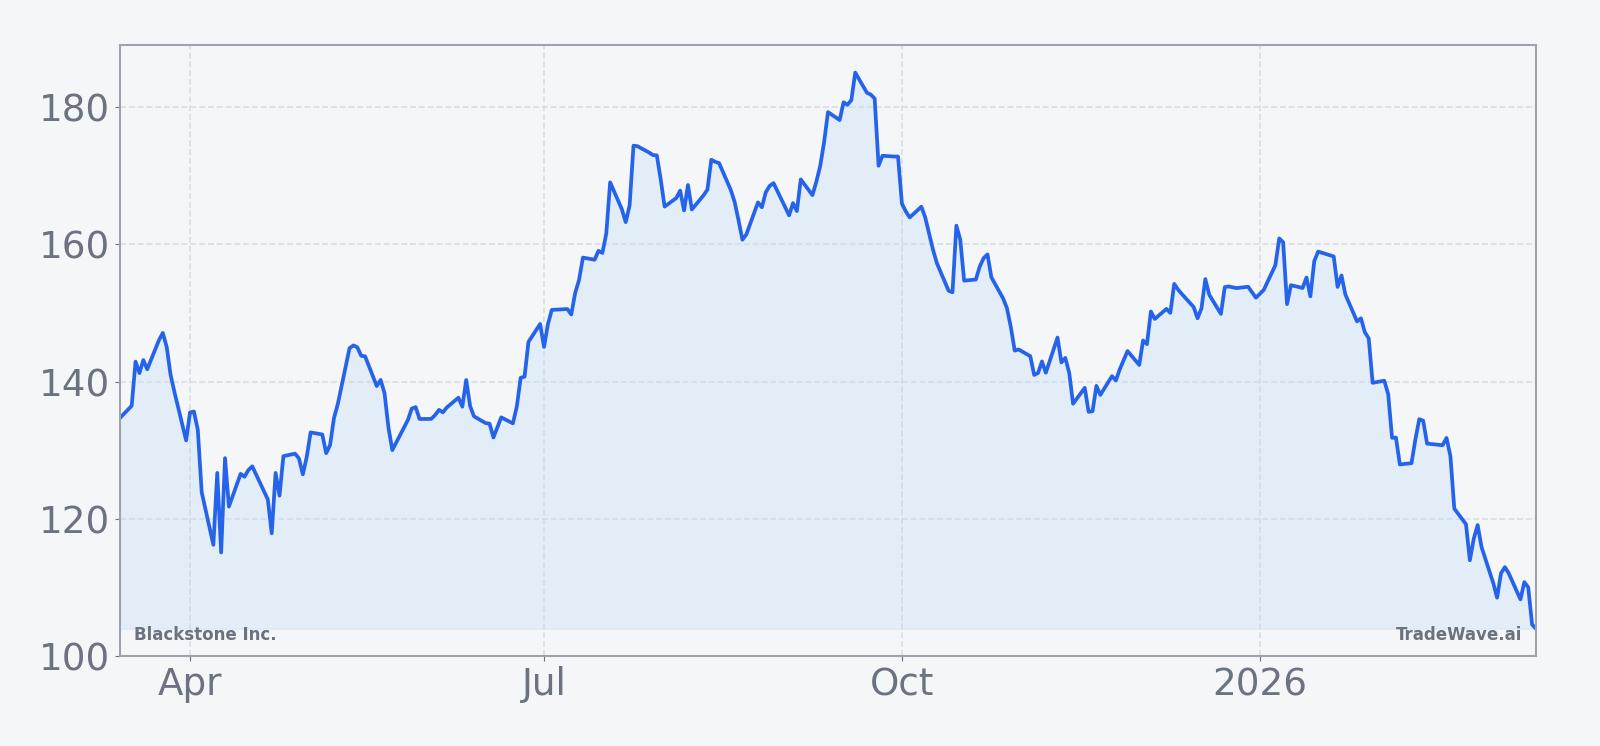
Blackstone shares closed Friday at $106.78, up 4.6% on the day, after a rough month that has left the stock down 17.72% over the past 30 days and sitting just above a 52-week low of $101.73.[1] The stock’s 20-day average volume sits around 10.2 million shares, and BX is trading well below its 50-day moving average near $133.49, a sign that the recent slide has broken through short-term trend support.[1]
The latest leg of the story came on Jan 29, 2026, when Blackstone reported distributable earnings of $1.75 per share, topping the $1.54 analyst expectation as strong dealmaking and realizations offset market volatility.[1] Management pointed to a robust pipeline and continued strength in credit and insurance strategies, building on a 2025 run in which distributable earnings repeatedly beat forecasts and assets under management climbed to record levels.[1][6]
In Q4 2025, distributable earnings of $1.75 per share followed earlier beats in Q2 and Q3, where profit growth was driven by credit strength, fee gains, and rising inflows into flagship funds.[1][2][4][5][6] CEO Stephen Schwarzman has been preparing portfolio companies for potential IPOs and has flagged 2026 as a year that could see a pickup in public listings if markets stabilize, which would give Blackstone more opportunities to crystallize gains.[1][2][6][13]
Sector-wide, Blackstone sits at the center of a private equity and real estate complex that has swelled to $1.24 trillion in assets under management, including a $611 billion real estate portfolio and growing credit and insurance platforms.[6] That scale means BX often trades as a proxy for institutional risk appetite in alternatives, with flows into its funds and realizations from exits feeding directly into distributable earnings and, ultimately, distributions to shareholders.
Macro conditions remain a swing factor. In prior tariff cycles, higher trade barriers and uncertainty around global growth have complicated real estate and dealmaking, yet Blackstone has historically managed to keep inflows resilient by leaning into credit and fee-based strategies.[4] If 2026 brings a more stable rate backdrop and a thaw in IPO markets, the firm’s pipeline could convert into higher realizations, but a renewed macro shock would test that resilience.
On the sell-side, the stock carries a Neutral consensus rating from analysts tracked by Piper Sandler and LSEG, reflecting a market that recognizes Blackstone’s earnings power but is also weighing valuation, rate sensitivity, and the hit to sentiment from last year’s roughly 11% share-price decline during a period of market scrutiny.[1] With BX now far below its 52-week high and trading under key moving averages, the next few months will show whether fundamentals and seasonality can pull the stock back into a stronger trend.
The chart below situates the latest move in its recent multi-month context.
Earnings and deal pipeline
Blackstone’s recent earnings beats have come with a consistent message: the deal pipeline is strong and diversified. In Q2 2025, distributable earnings grew 25% to $1.6 billion, or $1.21 per share, beating the $1.10 expectation as credit strategies and fee-related performance revenue did the heavy lifting.[2] By Q4 2025, that momentum had accelerated, with quarterly profit jumping 48% year-on-year to $1.89 billion, or $1.52 per share, on the back of higher realizations and record assets.[6]
Management has highlighted digital and energy infrastructure as key growth lanes, pointing to transactions like the agreement to acquire energy data and analytics firm Enverus in a deal valued at more than $6 billion.[7][12] Those moves fit a broader strategy of leaning into data-rich, recurring-revenue businesses that can compound through cycles and support higher fee streams.
Looking ahead, Blackstone expects 2026 to be a potentially big year for IPO activity, with several portfolio companies being readied for public markets.[1][13] Street expectations for the coming quarters center on whether that pipeline actually converts into exits at attractive valuations, which would support distributable earnings and, by extension, distributions to shareholders.
Macro and sector backdrop
Blackstone’s scale makes it sensitive to macro currents that hit real estate, credit, and private equity all at once. In prior tariff and trade flare-ups, such as those tied to U.S. policy shifts on imports, higher costs and uncertainty have weighed on real estate valuations and cross-border dealmaking, even as Blackstone’s diversified platform helped cushion the blow.[4] The firm’s credit and insurance arms, in particular, have benefited from higher yields and demand for private credit solutions when banks pull back.
Within alternatives, Blackstone’s $611 billion real estate portfolio and $1.24 trillion in total assets under management give it outsized influence on sentiment.[6] When BX rallies, it often signals confidence in the durability of fee streams and the health of institutional demand for private markets; when it sells off, investors tend to question valuations in everything from commercial property to leveraged buyouts.
Valuation and positioning into the window
With BX trading about 41.5% below its 52-week high and well under its 50-day moving average, the stock is no longer priced like a momentum favorite.[1] The Neutral consensus rating from Piper Sandler and LSEG suggests analysts see a balance between upside from a strong pipeline and risks tied to rates, regulation, and the broader cycle in private markets.[1]
For investors who track both fundamentals and flows, the setup is unusual. Blackstone has delivered repeated earnings beats, record assets, and a growing footprint in credit and insurance, yet the share price has been hit hard over the past month and remains close to its 52-week low.[1][2][4][5][6] That disconnect is the context in which the historically strong 153-day seasonal window is opening.
According to historical data from TradeWave.ai, this specific 153-day stretch has behaved very differently from an average half-year for Blackstone, with a clear long-side bias that most investors do not have on their radar.
What to watch as this window unfolds
First, watch how BX trades around the $100 to $105 band that sits just above the 52-week low.[1] In prior years, the seasonal window has tolerated sizable drawdowns before recovering, but a decisive break below that zone would signal that macro or firm-specific pressures are overwhelming the historical pattern.
Second, keep an eye on deal announcements and exit activity. Follow-through on the Enverus acquisition and any new digital or energy infrastructure deals will shape how investors handicap Blackstone’s ability to keep growing fee-related earnings through 2026 and beyond.[6][7][12] A pickup in IPOs from the firm’s portfolio companies would be another sign that the earnings engine is converting pipeline into realized gains.[1][13]
Third, monitor how quickly BX can reclaim its 50-day moving average near $133.49 if the seasonal tailwind kicks in.[1] A move back toward that level during the window would line up with the historical pattern of strong average gains, while a failure to bounce meaningfully from current levels would mark a clear break from the last decade’s behavior.
Finally, watch sentiment around private equity and real estate more broadly. Headlines on tariffs, rates, and credit conditions have a direct line into Blackstone’s business mix, and sharp swings in those narratives have historically coincided with the deeper intraperiod drawdowns seen in this window.[4][6] If macro noise stays contained and the firm continues to execute on its deal pipeline, this 153-day stretch has, historically, been when that strength shows up most clearly in the stock price.
Key takeaways
- Blackstone Inc. has finished higher in this 153-day window in 10 of the past 10 years, with an average gain of 20.56% for long positions.
- The 2026 window starts with BX at $106.78, about 41.5% below its 52-week high and just above its 52-week low, after a 17.72% one-month slide.[1]
- All ten historical years were winners, but intraperiod drawdowns have been sharp at times, with maximum adverse moves reaching roughly -19% in several iterations.
- The pattern’s TradeWave Ratio of 1.57 and Sharpe ratio of 1.05 point to historically strong upside travel and favorable risk-adjusted returns over the window.
- Recent earnings beats, record assets under management, and a strong deal and IPO pipeline give fundamental backing to a stock that is currently trading well below recent highs.[1][2][6][7][12][13]
Sources
- Reuters: Blackstone beats estimates on strong dealmaking activity (Jan 29, 2026)
- Reuters: Blackstone says deal pipeline strongest since 2021 peak as profit beats estimates (Jul 24, 2025)
- Reuters: Blackstone says deal pipeline stronger than 2021 peak as profit beats estimates (Jul 24, 2025)
- Reuters: Blackstone's profit tops estimate on credit strength, fee gains (Jul 24, 2025)
- Reuters: Blackstone's profit tops estimate on private equity, credit strength (Jul 24, 2025)
- Reuters: Blackstone teases deal flow, record assets as profit beats estimates (Oct 23, 2025)
- Bloomberg: Blackstone Is Said to Agree on $6 Billion-Plus Deal for Enverus (Aug 6, 2025)
- Reuters: Blackstone signs $6.5 billion deal for data analytics firm Enverus (Aug 6, 2025)
- Reuters: Blackstone CEO says preparing portfolio companies for IPOs (Jul 24, 2025)