Oil Tariffs and Soft Demand Pressure Energy, but Coterra (CTRA) Leans on a 7-of-8 Spring Streak
Coterra is trading just below a 52-week high as a historically strong 23-day midterm-year spring window approaches, putting a bullish seasonal tailwind on traders’ radar.

Key takeaways
- A 23-day seasonal window for Coterra tied to midterm election years begins on Mar 26, 2026.
- Across the last 8 midterm election years, the pattern has been long-biased with 7 winners and 1 loser, or 88% profitable seasons.
- Average gain in winning years is 5.73%, while the all-years average including the lone loss is still a solid 5%.
- Historical paths show sizable upside bursts, with several years posting double-digit peak run-ups inside the window.
- Drawdowns have varied, including one year with a double-digit intraperiod drop, so the window has carried real downside risk even when it finished higher.
- CTRA is trading at 32.15, about 1.6% below its 52-week high, which makes the upcoming seasonal stretch especially relevant for investors already sitting on gains.
According to historical data from TradeWave.ai, this specific midterm-year spring stretch has behaved differently from an average month for Coterra. The next section walks through what that pattern has looked like in prior cycles and how it frames the upcoming window.
Seasonal window
Coterra has risen in 7 of the last 8 midterm election years during this 23-day spring window, averaging 5.73% gains in the winning seasons. The next iteration begins on Mar 26, 2026, with the stock currently at 32.15, about 1.6% below its 52-week high of 32.67 and already extended after a steady climb.
Grouping the data by presidential election cycle matters here because midterm years often bring a different policy and volatility mix for energy names than election years or the year before the election. Capital spending plans, drilling permits and pipeline approvals tend to be more sensitive to Washington headlines in the middle of the cycle, and that backdrop can shape how a stock like Coterra trades around the spring shoulder season for natural gas and oil demand.
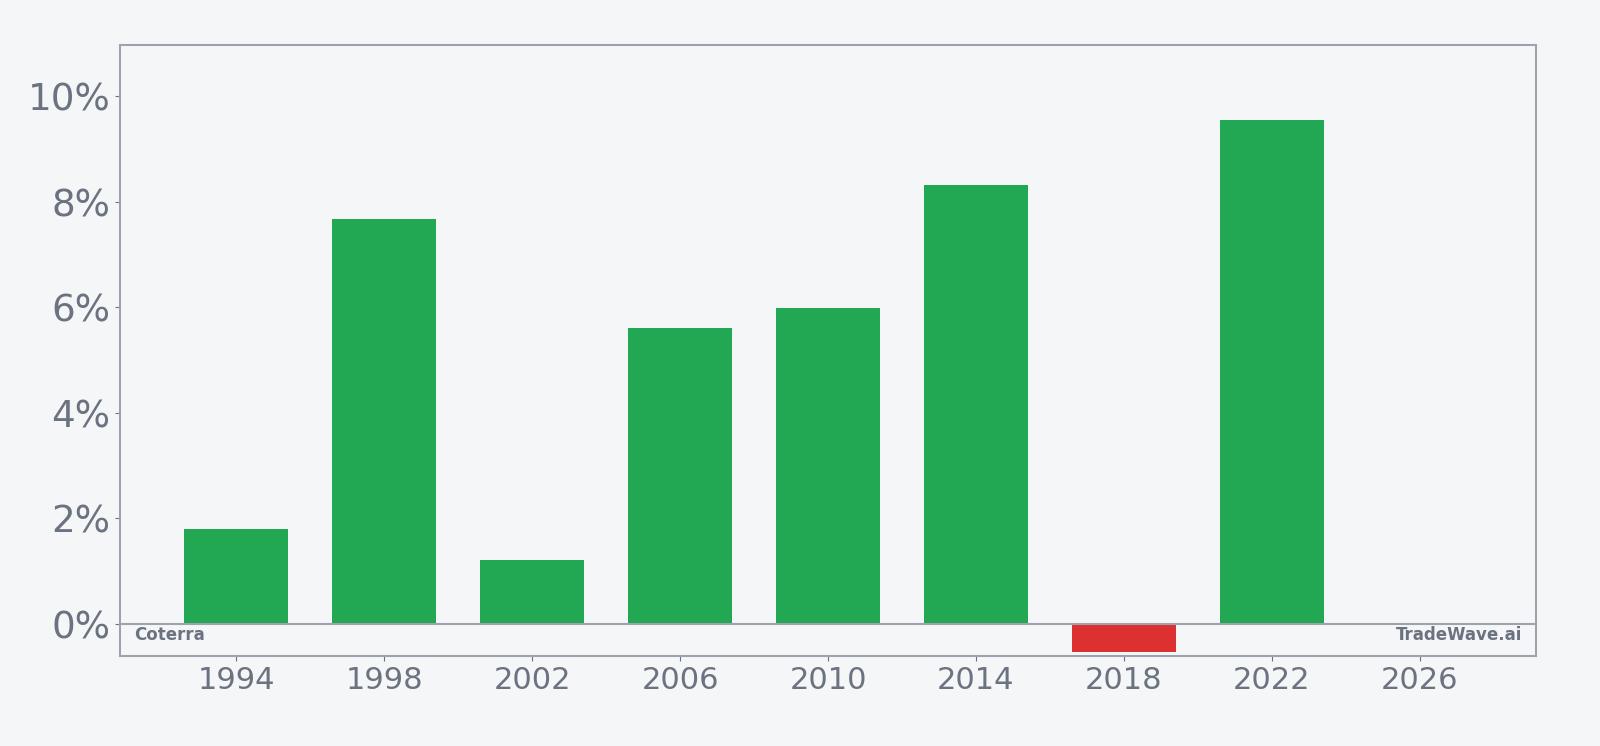
This seasonal window begins on Mar 26 and spans 23 trading days. Historically, during this period in midterm election years, Coterra has shown a clear long-biased tendency, with 7 winning seasons against just 1 losing year and an all-years average gain of 5%.
The strongest year in the sample came in 2022, when Coterra logged a 9.54% net gain during the window, with a best intraperiod run-up of 11.85% from the entry level before giving back some ground by the close. At the other end of the spectrum, 2018 was the lone losing season, finishing down 0.54% after a maximum adverse move of 5.09% from the starting price.
Across the full set of midterm years, the average winner gained 5.73%, while the median outcome was a 5.8% rise, which points to a fairly consistent upside skew rather than a pattern driven by a single outlier. The trade direction for this setup is long, so those positive years represent favorable outcomes for the pattern, while the 2018 decline is the one unfavorable season in the lookback.
The intraperiod path has not been a straight line. In 1994, for example, the window finished with a modest 1.79% gain but saw a worst drawdown of 10.72% from the entry level before recovering into the close. By contrast, 2010 delivered a 5.99% net gain with a 12.56% peak run-up and almost no downside excursion, with the worst move against the position barely negative at 0.06%.
That mix of outcomes shows why the maximum favorable move and maximum adverse move matter as much as the final net result. Several years, including 1998, 2010, 2014 and 2022, saw double-digit peak rallies inside the window, while the worst drawdowns in those same years stayed relatively contained compared with 1994’s deep dip.
A stacked view of net results alongside peak rallies and worst drawdowns shows how much the stock has typically moved inside the window.
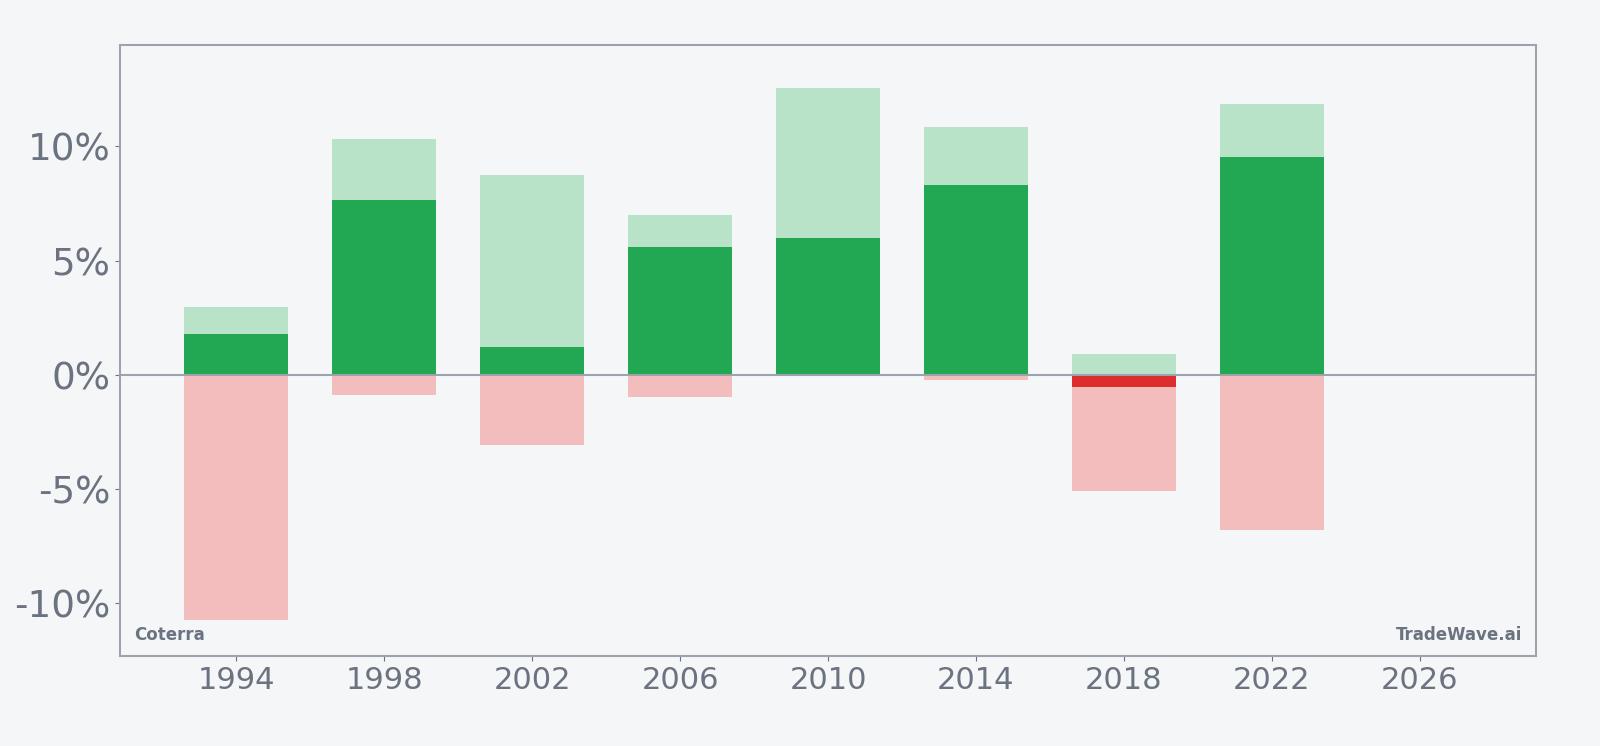
The stacked bars highlight a key point for traders: even in years that finished higher, Coterra has often swung several percentage points both up and down inside the window. Large maximum favorable moves paired with non-trivial adverse excursions fit with a high-energy stock that can trend but still whipsaw around macro headlines and commodity price shifts.
History does not guarantee future results; adverse excursions (MAE) can be large even in winning windows.
Price and near-term drivers
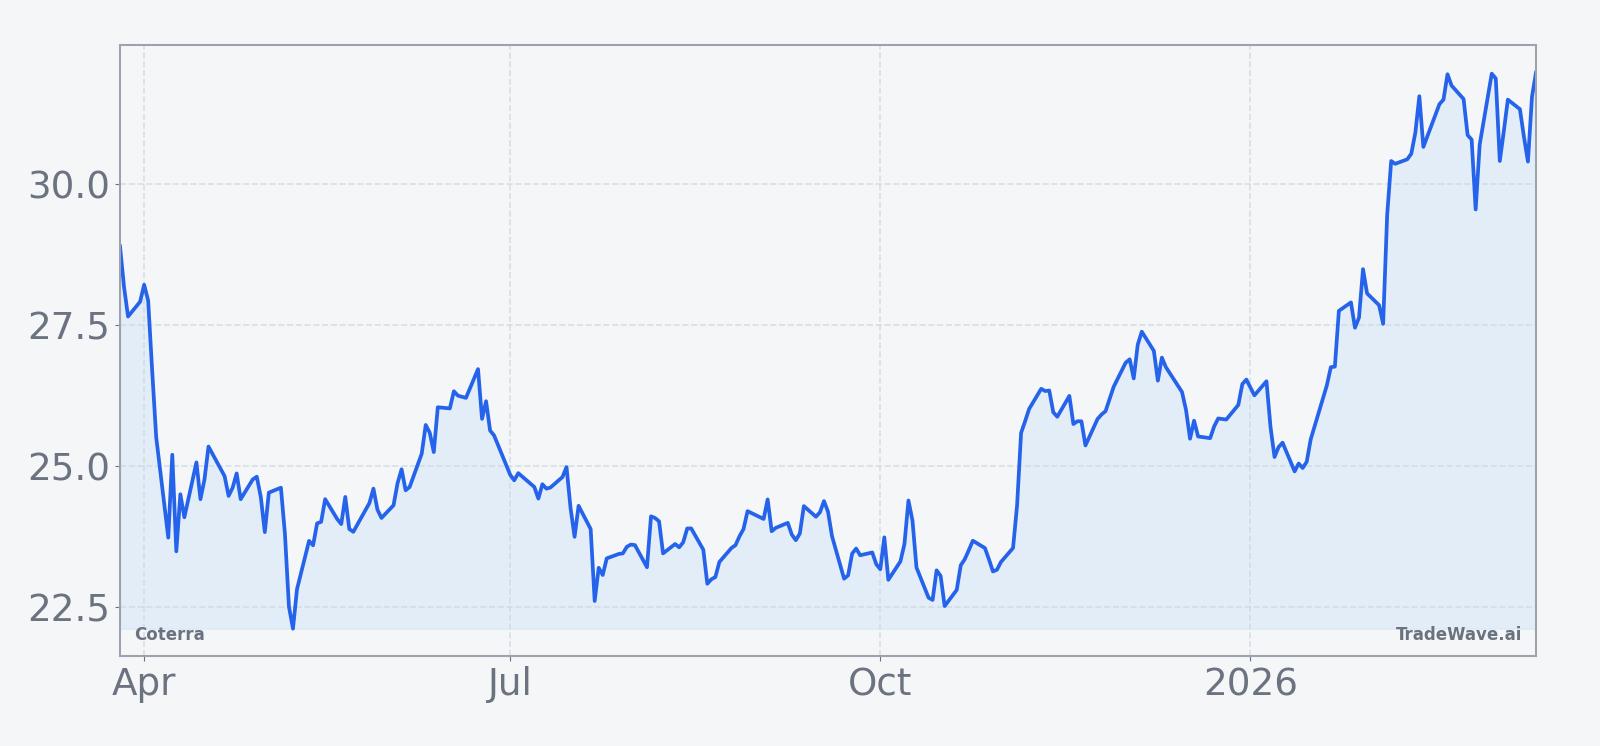
Coterra closed Friday at 32.15, up 0.53% on the day, after trading between 31.64 and 32.27 on volume of about 10.7 million shares. The stock has gained 4.45% over the past month and sits above its 50-day moving average of 28.92, with 20-day average volume near 9.9 million shares, underscoring a firm uptrend into the back half of March.
The chart below situates the latest move in its recent multi-month context.
Macro and policy backdrop
The upcoming window lands in the early part of the midterm election year, a phase that often brings more noise around energy policy, drilling regulations and export rules. For producers like Coterra, that can intersect with commodity fundamentals in ways that amplify price swings.
In Aug 2025, Coterra reported that higher natural gas prices and strong output helped it beat profit estimates, with adjusted earnings of 48 cents per share versus expectations of 45 cents and production up 17% to 783,900 barrels of oil equivalent per day.[1] That report came against a backdrop of weaker crude prices tied to soft global demand, U.S. tariffs and increased supply from OPEC+ producers, which partially offset the benefit of higher volumes.[1]
Those dynamics illustrate the cross-currents that can shape the next midterm-year spring window. On one side, Coterra has shown it can grow production in key basins like the Permian and Anadarko, which supported the 2025 beat.[1] On the other, macro forces such as tariffs, OPEC+ decisions and global demand trends can pressure realized prices even when volumes are rising.
What to watch as the window opens
With Coterra already trading near a 52-week high, the historical pattern of 7 wins out of 8 midterm-year spring windows gives investors a clear seasonal backdrop heading into late March. The key question is how the stock behaves once the window starts on Mar 26: does it follow the typical path of grinding higher with occasional sharp pullbacks, or does it look more like 2018’s choppier, slightly negative season.
Three things stand out for this iteration. First, watch how CTRA trades around its recent high near 32.67; sustained strength above that level during the window would be consistent with prior strong years, while repeated failures there would look more like the weaker outcomes. Second, monitor volume relative to the 20-day average of about 9.9 million shares: spikes on up days would fit the historical pattern of strong maximum favorable moves, while heavy volume on down days would hint at a deeper adverse excursion.
Third, keep an eye on macro headlines that touch both energy policy and global demand. Any shift in U.S. tariffs, OPEC+ production guidance or signs of demand softness similar to what weighed on crude in 2025 could influence how much of the historical upside Coterra can realize in this window.[1] If the stock can absorb those shocks and still trend higher, it would reinforce the long-biased seasonal record. If not, this could be one of the rarer years when the midterm spring pattern underdelivers.