ExxonMobil (XOM) Rides Middle East Oil Spike Into a 26-Day Midterm-Year Rally Window
ExxonMobil is heading into a historically strong 26-day midterm-election-year stretch just as shares trade near record highs and oil-sensitive geopolitics keep the stock in play.

Key takeaways
- ExxonMobil’s upcoming 26-day window starting Mar 24 in midterm election years has been positive in 6 of 7 cycles, or 86% of the time.
- The pattern is long-biased, with winning years averaging a 5.51% gain and all years averaging 5% across the window.
- Historical maximum favorable moves inside the window have often run between about 4% and 8%, showing meaningful upside bursts.
- Adverse moves have still reached roughly 4% intraperiod drawdowns in some years, underscoring real downside risk even when the window finishes higher.
- Today’s $151.58 close leaves XOM about 4.9% below its 52-week high of $159.35, after a 2.3% gain on the day.
- The window sits in the early part of the midterm election year, when policy uncertainty and oil-sensitive geopolitics can amplify seasonal tendencies.
According to historical data from TradeWave.ai, this specific midterm-year stretch has behaved differently from a typical month for ExxonMobil, with a clear directional bias that traders rarely see discussed.
Seasonal window
ExxonMobil has risen in 6 of the last 7 midterm-election-year windows that begin on Mar 24 and run for 26 trading days, averaging a 5.51% gain in winning years. Shares finished Thursday at $151.58, up 2.3% on the day and about 4.9% below the 52-week high of $159.35, after another session shaped by oil-sensitive headlines and heavy trading volume.
Grouping the data by the presidential election cycle matters here because energy policy, regulation and geopolitical risk often shift meaningfully between the midterm year and the year before the presidential election. This window sits in the early part of the midterm election year, a phase that has historically featured more policy uncertainty around drilling, emissions rules and strategic reserves, which can translate into sharper short bursts in integrated oil majors like ExxonMobil.
This seasonal window begins on Mar 24, 2026 and spans 26 trading days. Historically, during this period in midterm election years, ExxonMobil has shown a strong upside tendency for long positions, with 86% of the sampled years finishing higher and only 1 losing year in the set.
The trade direction for this pattern is explicitly long. Across the last 7 midterm-election-year iterations, there have been 6 winners and 1 loser, for a Percent Profitable reading of 86%. Average profit in the winning years clocks in at 5.51%, while the average across all years, including the single down year, is still a solid 5%.
Avg Profit reflects winners only, while Avg Profit - All includes every year in the sample. That gap between 5.51% and 5% shows that the lone losing year was relatively modest compared with the typical upside outcome, which helps keep the all-years average close to the winners-only figure.
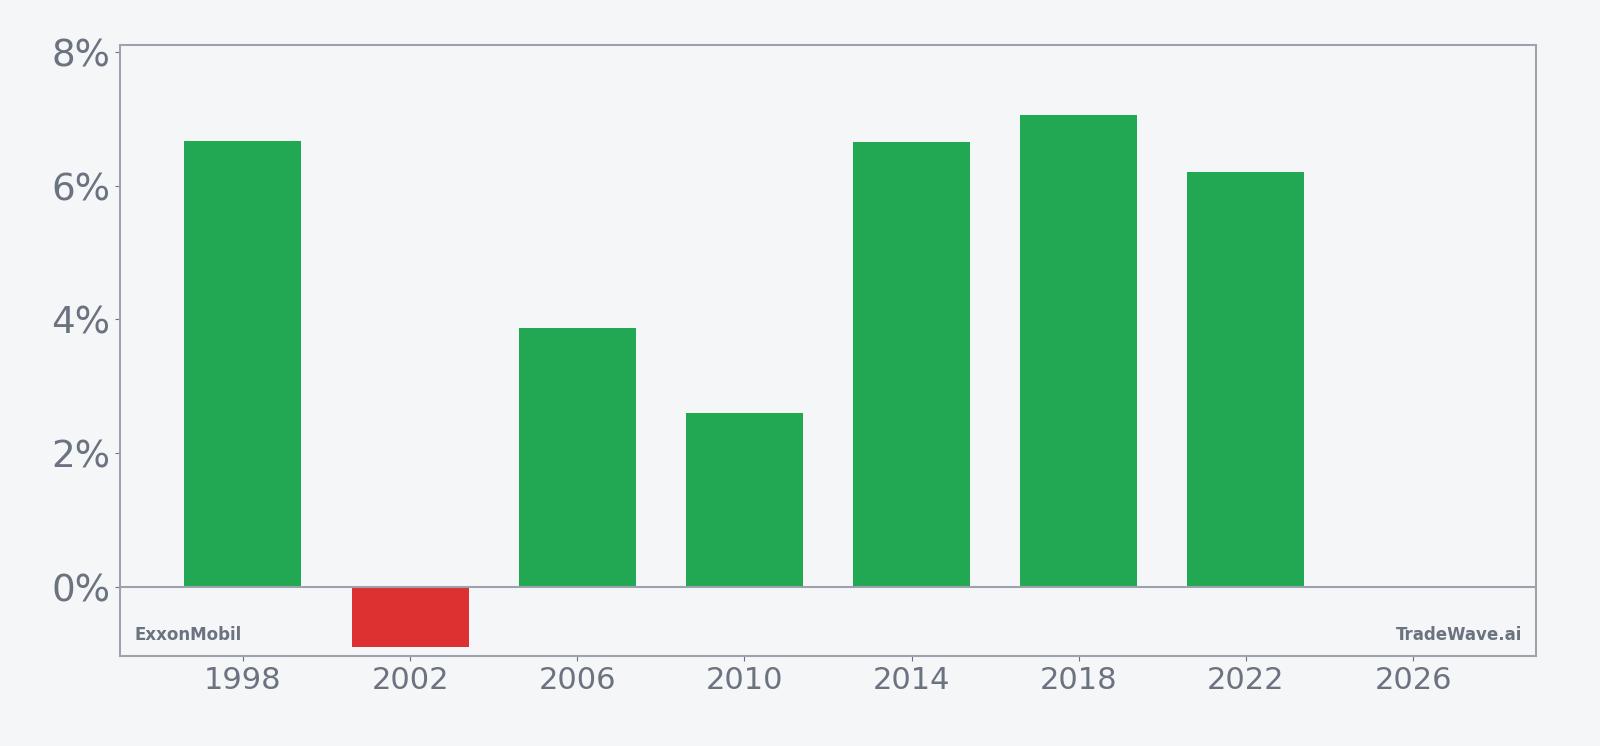
Looking at individual years, the strongest net gains in this window came in 2018, when ExxonMobil advanced 7.05% from entry to exit, and in 1998 and 2014, when the stock added 6.67% and 6.65% respectively over the 26-day span. The weakest outcome was 2002, which delivered a 0.91% loss despite a mid-window rally that briefly pushed the position into the green before reversing.
The intraperiod path has mattered as much as the final result. Maximum favorable excursions, or the best point-to-peak moves during the window, have ranged from about 3.83% in 2010 to 7.78% in 2018, showing that even quieter years have offered several percentage points of upside travel in the trade direction. Maximum adverse excursions, the worst drawdowns from entry, have stretched to roughly 4.39% in 1998 and 4.34% in 2022, reminding traders that even ultimately profitable windows have included uncomfortable pullbacks.
The TradeWave Ratio (TWR) for this pattern stands at 3.31. TradeWave Ratio (TWR) reflects how far price typically travels in the trade direction within the window regardless of the final close. Combined with a Sharpe ratio of 1.47 based on end-of-window outcomes, the profile points to a historically favorable risk-adjusted setup for longs in this specific midterm-year slice.
Trend metrics inside the window lean clearly to the upside. Across the sample, the pattern shows 47 days where the average path is trending higher versus only 7 days with a short bias, and even when the lens is tightened the long-tilted days still outnumber short-tilted ones by roughly 42 to 16. The cumulative return curve for the window tends to grind higher rather than spike in a single burst, with gains often building steadily across the 26 days instead of arriving all at once.
In plain terms, this has been a window where ExxonMobil has usually drifted higher over most of the period, with a few years showing early drawdowns that later reversed into solid gains. The single losing year was shallow compared with the stronger rallies, which is why the all-years average remains close to the winners-only average.
Year-by-year bars with both best and worst intraperiod moves show how upside bursts have coexisted with meaningful drawdowns.
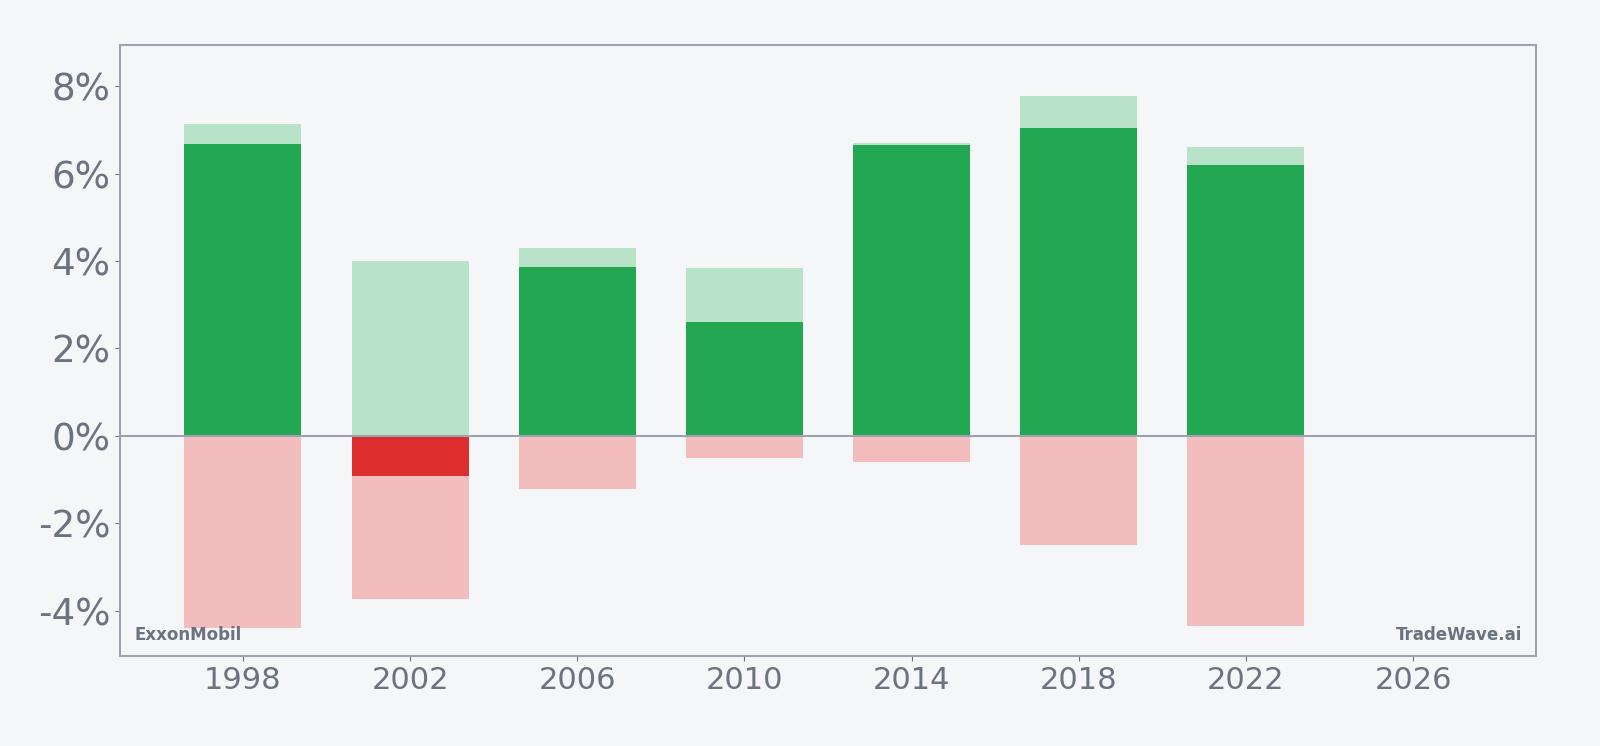
History does not guarantee future results; adverse excursions (MAE) can be large even in winning windows.
Price and near-term drivers
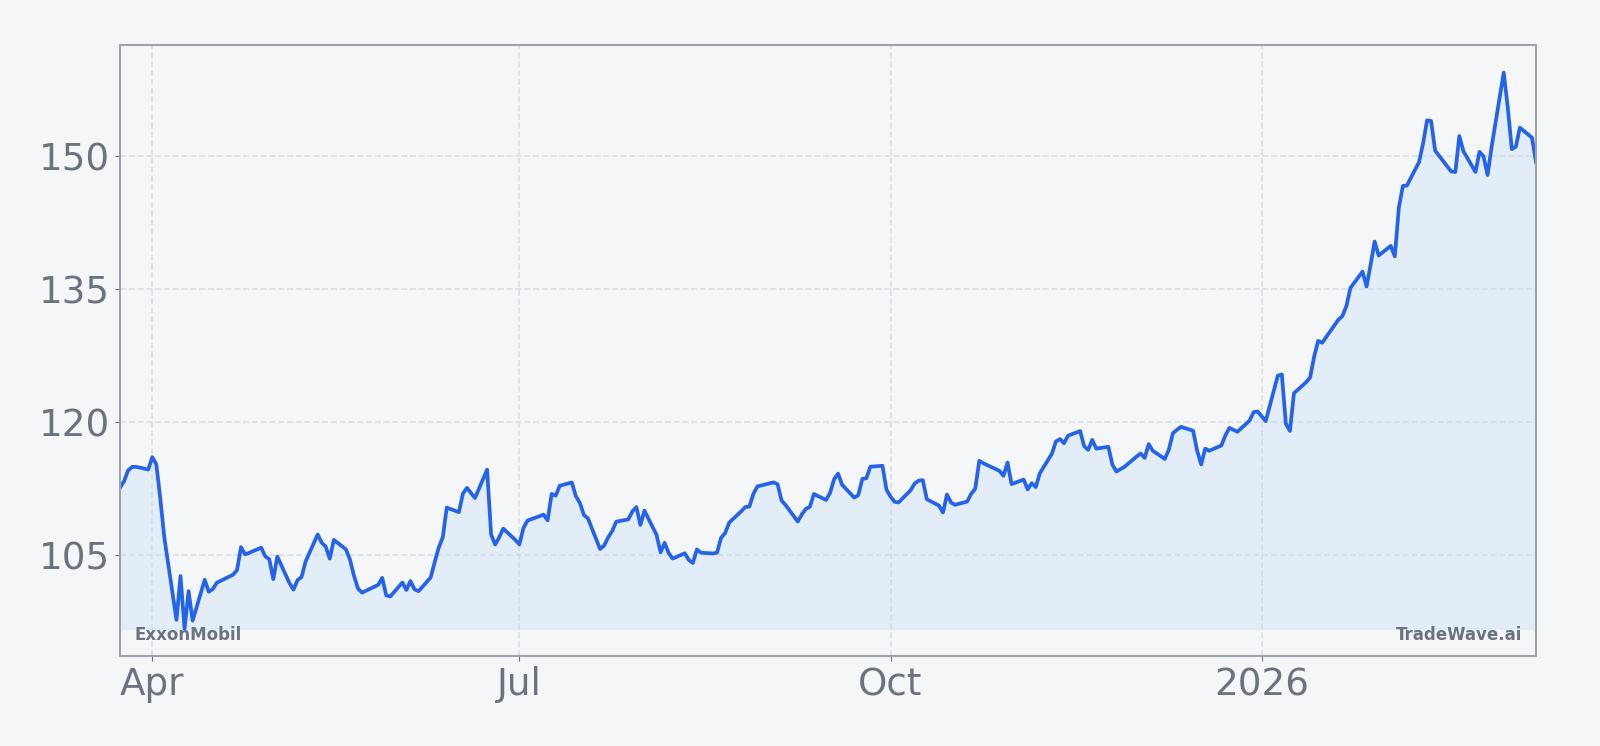
ExxonMobil closed Thursday at $151.58, up $3.45 or 2.3% on the session, with roughly 15.1 million shares changing hands against a 20-day average volume of about 20.3 million. That leaves the stock about 4.9% below its 52-week high of $159.35 and well above its 50-day moving average near $139.26, underscoring how strong the uptrend has been over the past several months.
Part of that strength has come from a run of solid earnings prints. In Q2 2025, ExxonMobil delivered adjusted earnings of $1.64 per share on $79.34 billion in revenue, topping profit estimates and posting its highest oil and gas production for any second quarter, which helped offset pressure from softer crude prices.[1] Q3 2025 then brought record upstream production and continued cost savings, reinforcing the company’s message that it can grow volumes and protect margins even in a choppy commodity tape.[2]
The company has also laid out a longer-term roadmap that keeps investors focused on cash generation. In Dec 2025, management outlined a plan targeting $25 billion in earnings growth and $35 billion in cash flow growth from 2024 to 2030, driven by higher-return assets and structural cost reductions.[1] By Q4 2025, ExxonMobil was reporting earnings of $1.71 per share excluding one-time items and production of 5 million oil-equivalent barrels per day, underscoring that the growth story is not just theoretical.[1]
Macro conditions have been supportive as well. In early 2026, the stock hit a record high as investors weighed geopolitical tensions, including commentary from Exxon’s CEO on the investability of Venezuela amid broader regional uncertainty.[1] More recently, Middle East conflicts have pushed oil prices higher, a backdrop that has tended to benefit integrated producers like ExxonMobil and helped fuel the latest leg of the rally.[1]
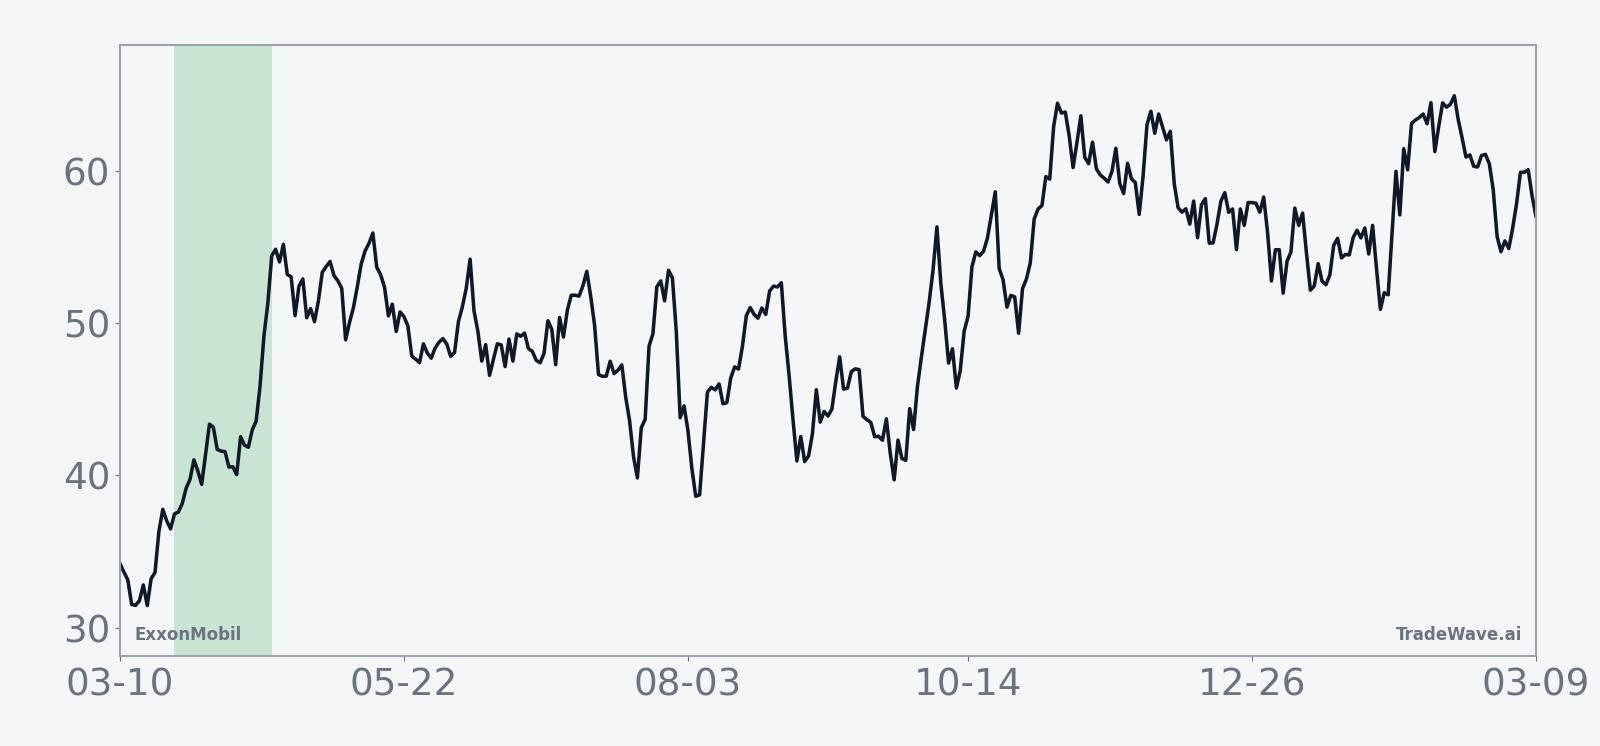
The chart below situates the latest move in its recent multi-month context.
Macro and election-cycle backdrop
The seasonal window that opens on Mar 24 lands in the early part of the midterm election year, a phase that often brings more noise around energy policy, environmental regulation and strategic petroleum reserve decisions. For a company of ExxonMobil’s scale, shifts in expectations around drilling approvals, carbon rules or export policy can move the stock quickly, especially when layered on top of already elevated geopolitical risk in key producing regions.
Energy markets are also digesting the push and pull between supply growth and price volatility. Earlier quarters showed how declines in crude prices could weigh on earnings, but record upstream production and cost savings helped cushion the impact.[1] If similar dynamics play out during this year’s midterm window, the historical pattern of steady gains with intermittent drawdowns could again reflect the tug-of-war between macro headlines and company-specific execution.
What to watch as the window opens
The 26-day window starting Mar 24 has historically favored long exposure in ExxonMobil during midterm election years, but the path has rarely been smooth. Traders watching this iteration will be focused on three main elements.
First, price behavior relative to the 52-week high zone around $159.35 will matter. A push back toward that level early in the window, especially if it comes with rising volume, would be consistent with the historical pattern of strong maximum favorable moves. A failure to hold the 50-day moving average near $139.26 during the window, by contrast, would look very different from most prior midterm-year episodes.
Second, the policy and geopolitical calendar could either reinforce or blunt the seasonal tendency. Any new headlines around Middle East supply risks, sanctions regimes or changes in U.S. drilling and export policy would likely feed directly into ExxonMobil’s tape, potentially amplifying the kind of 4% to 8% intraperiod swings that past windows have seen.
Third, earnings and production commentary will remain a key tell. While there is no near-term earnings date on the calendar, updates on production levels, cost savings or capital allocation could either validate the longer-term growth plan or introduce fresh uncertainty. Behavior inside the window that pairs firm fundamentals with price resilience near the highs would line up with the historical pattern. A sharp breakdown on negative news would mark a clear departure from the last seven midterm-year cycles.
For traders who track seasonality, the signal is straightforward: this has been a strong, long-biased window for ExxonMobil in prior midterm election years, with sizable upside travel but nontrivial drawdowns along the way. How the stock behaves between late March and late April will show whether that pattern still has bite in a market that is already pricing in robust earnings power and elevated geopolitical risk.