McKesson Corporation (MCK) Has Rallied in 10 of 10 Spring Windows as 58-Day Run Nears
McKesson Corporation is heading toward a 58-day spring stretch that has never been negative in the past decade, just as shares hover near record highs after a powerful earnings-driven surge.

Key takeaways
- McKesson Corporation has posted gains in this 58-day spring window in 10 of 10 years, a 100% win rate for long setups.
- The upcoming window begins Mar 26, 2026 and historically has delivered an average profit of 8.3% for McKesson.
- All years in the sample were winners, with a median gain of 6.69% and cumulative returns of 120% across the decade.
- The Trade Direction is long, supported by a TradeWave Ratio of 2.37 and a Sharpe ratio of 1.73 over the lookback.
- Intraperiod swings have been meaningful, with some years showing adverse moves near 10% before finishing higher.
- Shares trade about 5.6% below their 52-week high after a 17% earnings spike in early February, keeping the seasonal window in play for an already-strong trend.[1]
According to historical data from TradeWave.ai, this late-March window has behaved very differently from an average month on the calendar for McKesson. The next section walks through how that pattern has played out over the past decade and what it means for the coming 58 trading days.
Seasonal window
McKesson Corporation has risen in 10 of 10 years during this 58-day spring window, averaging 8.3% gains for long positions. The next iteration begins on Mar 26, 2026, with the stock last changing hands at 943.25, about 5.6% below its 52-week high of 999.00.[1] That combination of a clean 10-for-10 track record and a price still shy of recent peaks gives this year’s window unusual weight for traders watching a stock that has already been on a tear.
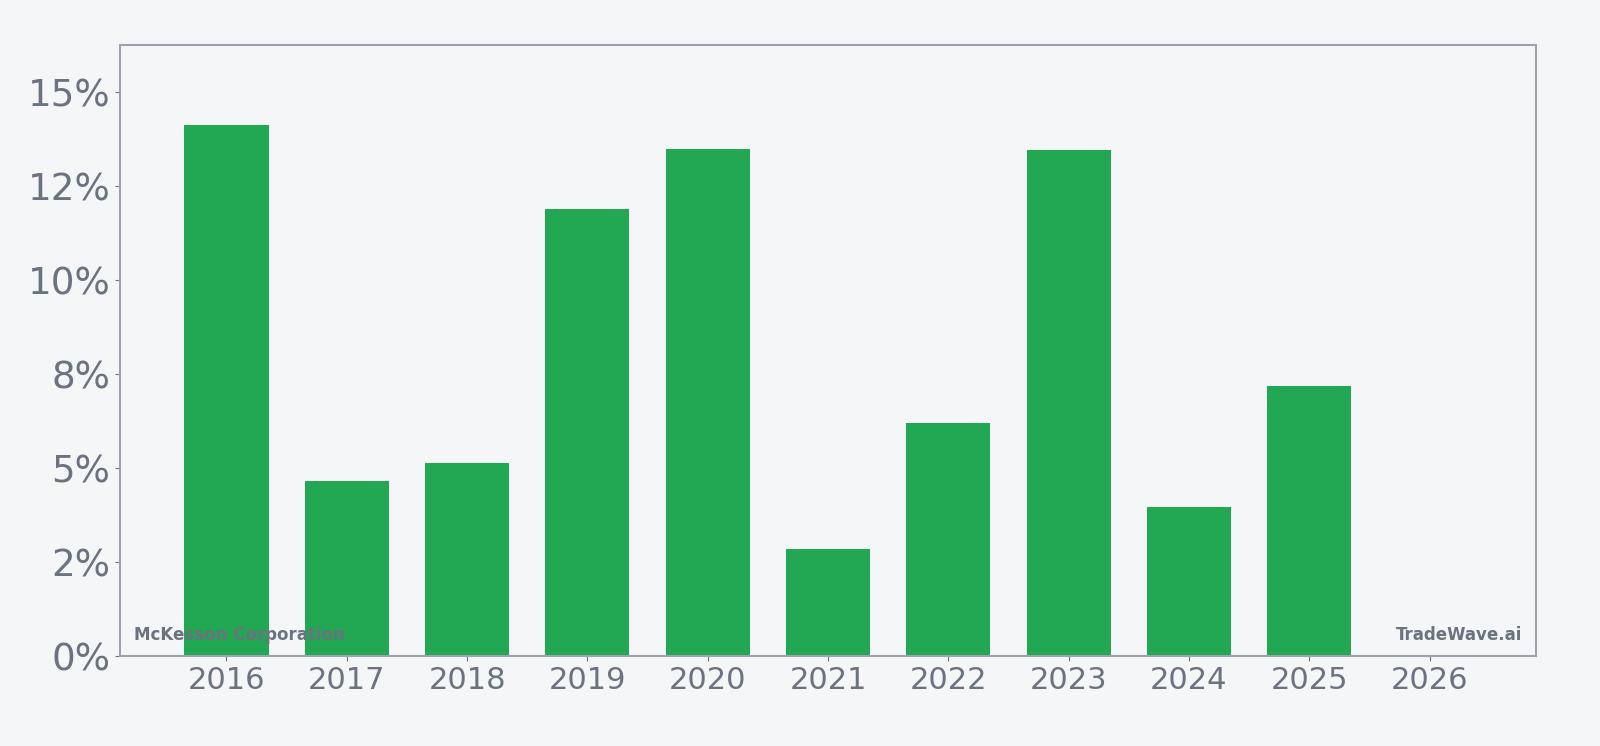
Across the 10-year sample, every single spring window finished positive for a long trade, with net gains ranging from 2.86% at the low end in 2021 to 14.13% at the high end in 2016. The median outcome sits at 6.69%, which means half the years delivered at least that much upside over roughly two and a half months. Add it up and the cumulative gain across these ten windows is 120%, a powerful tailwind for a stock that has already compounded sharply over the past decade.
The strongest years in the pattern, such as 2016, 2019, 2020 and 2023, all posted double-digit net returns between about 11.9% and 14.1%. Even the softer years, including 2017, 2018, 2021 and 2024, still finished with gains between roughly 2.9% and 5.1%. For a long-only seasonal setup, that kind of consistency is rare, especially in a single stock rather than a broad index.
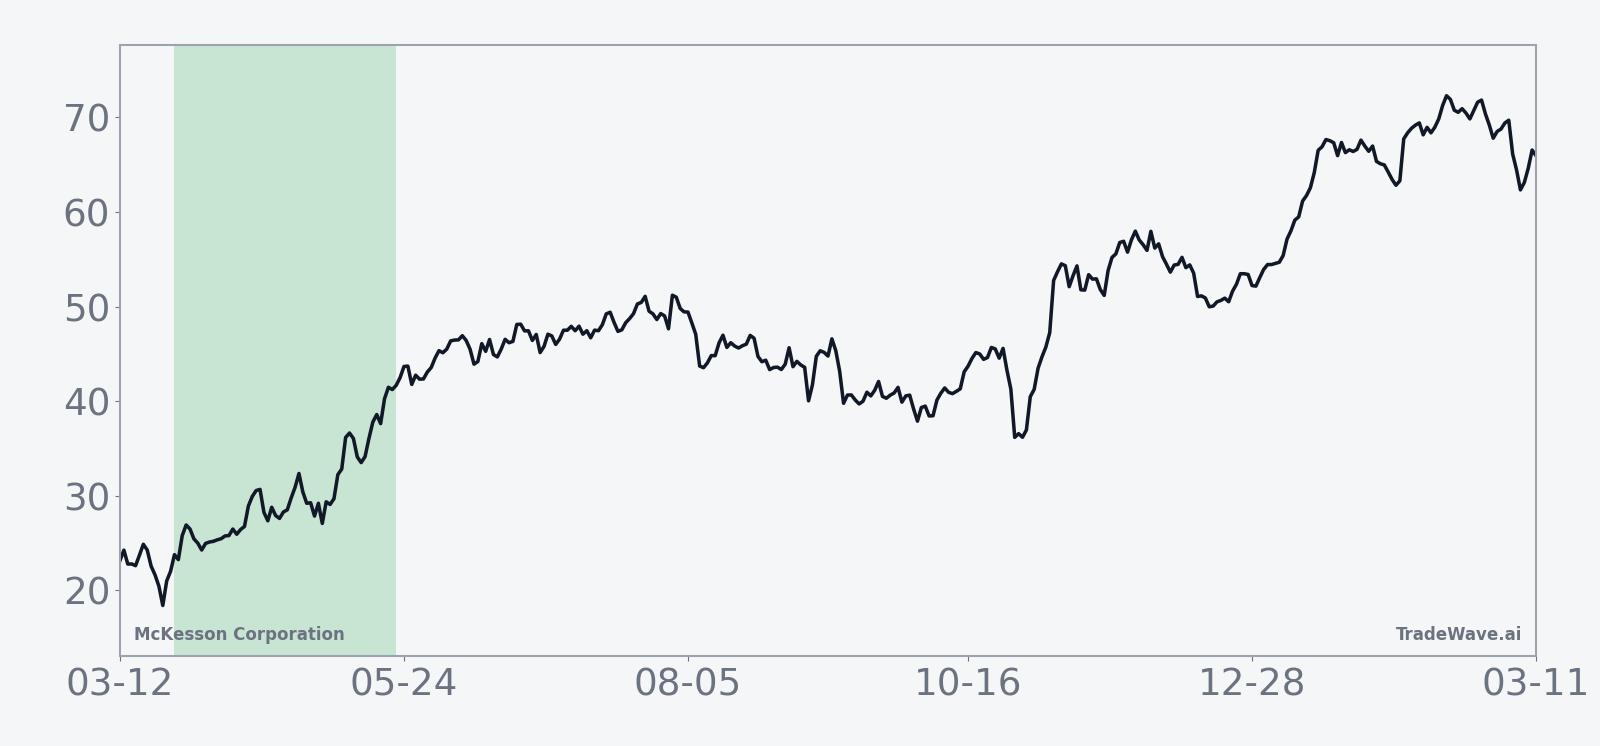
The historical seasonal average trend for this window shows a steady upward grind rather than a single explosive burst. Returns tend to build through the middle of the window, with the average path continuing to slope higher into the final weeks instead of giving back gains late. That profile fits a stock where buyers gradually accumulate exposure through the spring rather than chasing a one-day event.
Year-by-year maximum favorable and adverse moves show how much McKesson has typically swung inside the window before settling at its final gain.
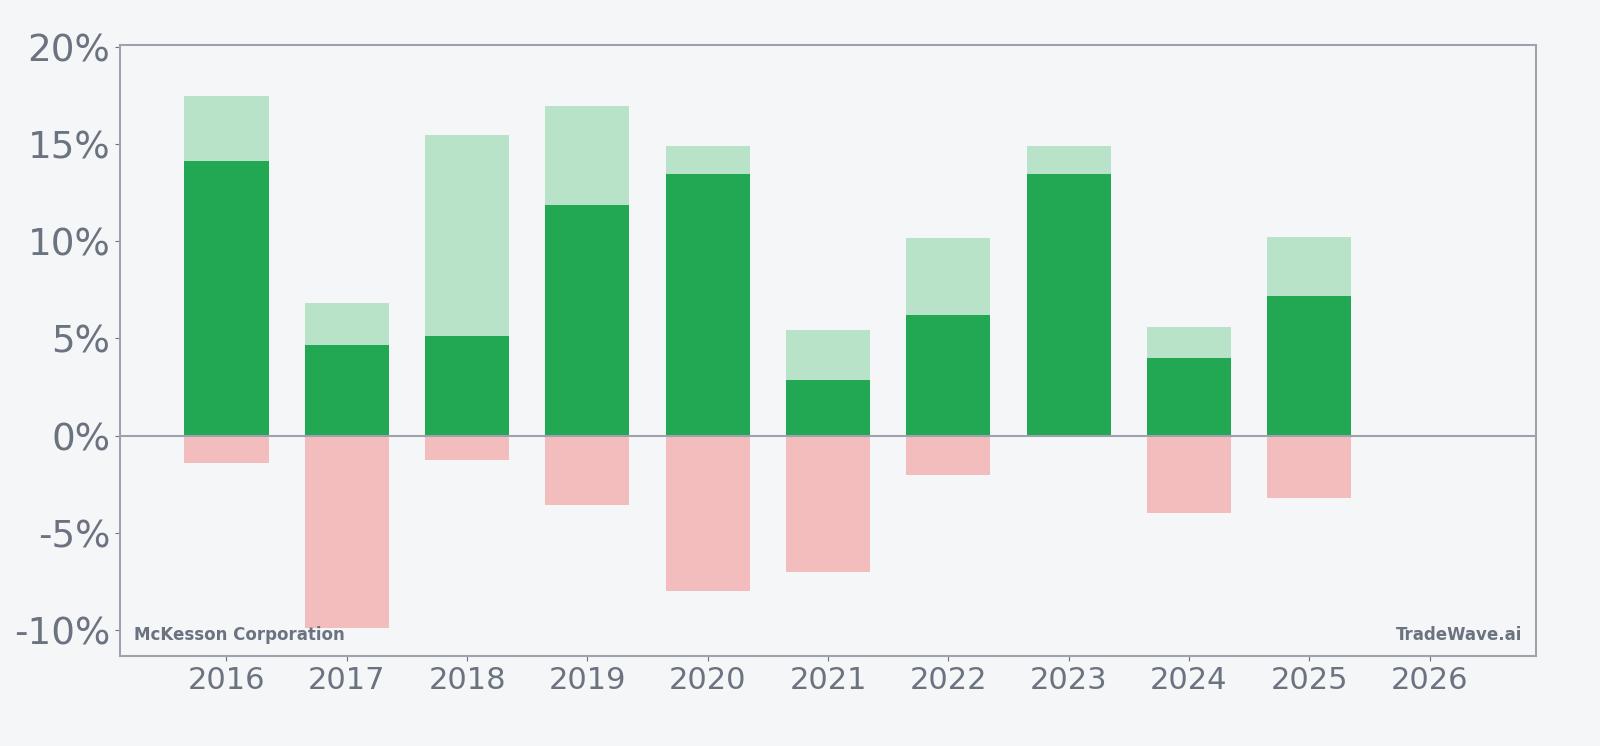
The maximum favorable excursion, or best intraperiod run-up, has often stretched well beyond the final net gain, with several years showing peak advances of roughly 15% to 17.5% before settling back. On the downside, the maximum adverse excursion, or worst drawdown from entry, has ranged from almost flat in 2023 to nearly 10% in 2017, with several years seeing temporary pullbacks of 3% to 8% even though they finished higher. The TradeWave Ratio of 2.37 captures that tendency for price to travel meaningfully in the trade direction within the window, while the Sharpe ratio of 1.73 points to a favorable risk-adjusted profile based on end-of-window outcomes.
History does not guarantee future results; adverse excursions can be large even in winning windows, and traders still face the risk that this year breaks the pattern.
Price and near-term drivers
McKesson shares closed Monday at 943.25, up 0.25% on the day and roughly 5.6% below their 52-week high of 999.00, after a powerful run that has left the stock near the top of its one-year range.[1] The move caps a volatile stretch that included a single-session surge of about 17% on Feb 6, 2026, after the company reported stronger-than-expected fiscal third-quarter earnings and raised its full-year profit outlook.[1]
The February spike followed Q3 adjusted earnings per share of 9.34, ahead of consensus estimates of 9.19, on revenue of 106.16 billion, up 11.4% year over year.[1] Management also lifted its fiscal 2026 adjusted EPS forecast to a range of 38.80 to 39.20, building on a series of upgrades through 2025 as demand for specialty drugs and oncology services accelerated.[1][2][4] In fiscal 2025, McKesson delivered adjusted EPS of 33.05, up 20% from 27.44 the prior year, supported by 6.1 billion in cash from operations.[5]
The latest earnings beat came with a notable volume spike, as trading activity swelled alongside the 17% price jump, signaling aggressive institutional interest rather than a thinly traded squeeze.[1] That matters heading into the seasonal window because it suggests the recent rally has been driven by fundamental buyers responding to upgraded profit expectations, not just short-term momentum traders.
On the fundamental side, McKesson continues to benefit from robust demand for specialty medicines, including treatments for cancer and rheumatoid arthritis, which carry higher margins than traditional drug distribution.[2] The company’s focus on oncology and specialty drug services has been a key growth engine, helping it raise its annual profit forecast multiple times through 2025 as volumes and pricing held up across its healthcare and pharmaceuticals footprint.[4]
The chart below situates the latest move in its recent multi-month context.
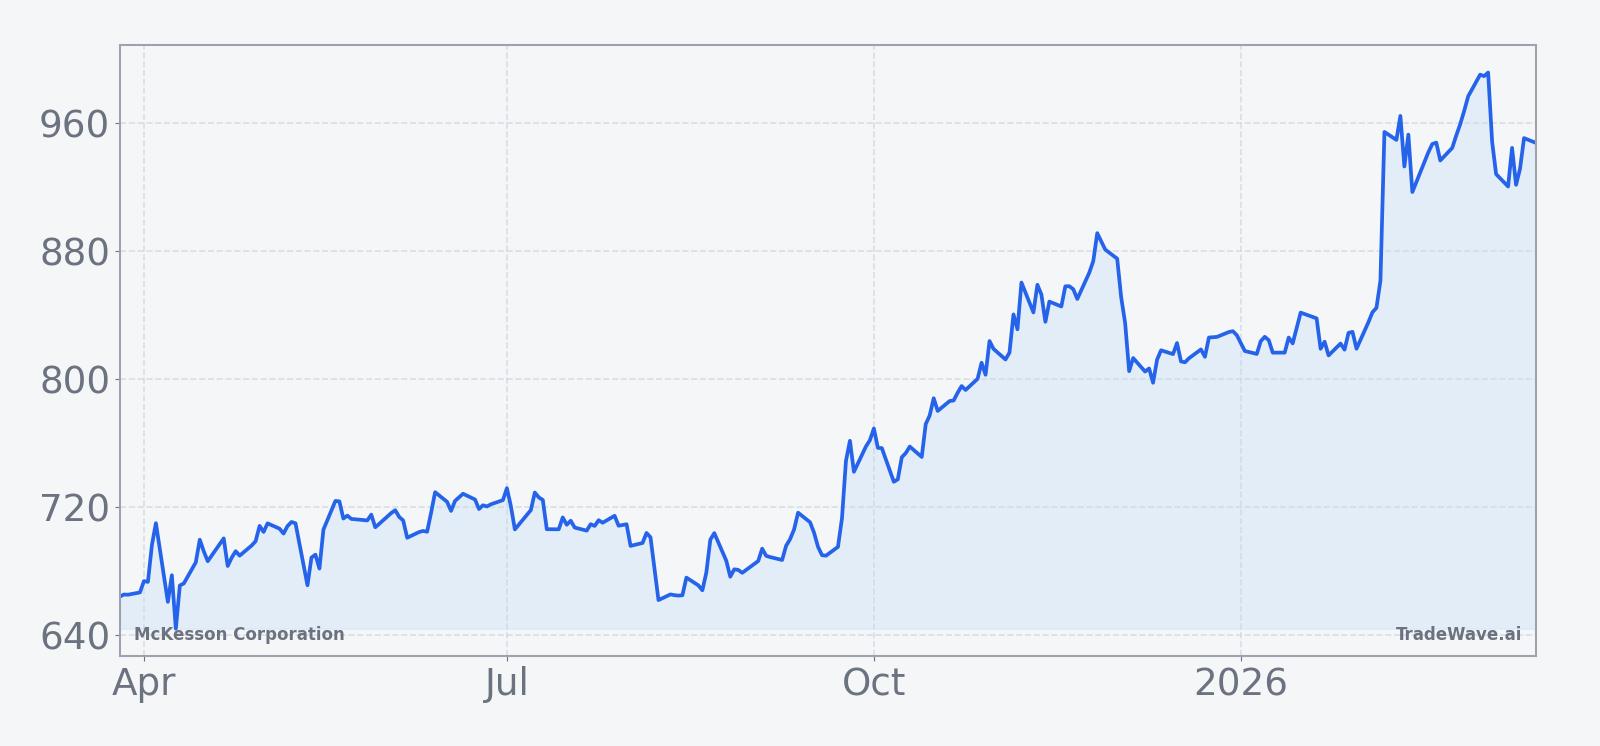
From a positioning standpoint, the stock’s one-month return of 1.08% looks modest compared with the earlier surge, suggesting some digestion as investors absorb the new earnings run-rate.[1] Average 20-day volume of about 675,945 shares and a 50-day simple moving average near 893.02 show that McKesson is trading with healthy liquidity and remains comfortably above its intermediate trend line.[1] That backdrop gives the upcoming seasonal window a different feel than a classic “catch-up” trade; the stock is already strong, and the question is whether the spring pattern adds another leg higher or simply marks a period of elevated two-way volatility.
Earnings and guidance context
McKesson’s recent earnings cadence has been one of steady upside surprises and rising guidance. In August 2025, the company lifted its annual profit forecast on the back of robust demand for specialty drugs, with first-quarter revenue of 97.83 billion topping estimates.[2] By November 2025, management raised the fiscal 2026 EPS outlook again to 38.35 to 38.85 after reporting second-quarter adjusted EPS of 9.86, well ahead of the 9.02 analysts were expecting.[4]
Those upgrades built on a strong fiscal 2025, when adjusted EPS climbed 20% to 33.05 and cash from operations reached 6.1 billion, giving the company room to invest in growth initiatives and shareholder returns.[5] The February 2026 quarter extended that trend, with Q3 adjusted EPS of 9.34 beating consensus and revenue growth of 11.4% year over year, prompting yet another bump to the fiscal 2026 EPS range, this time to 38.80 to 39.20.[1]
Street-level consensus targets are not available in the latest data set, but the pattern of repeated guidance hikes and upside earnings surprises has clearly reset expectations higher over the past year.[1][2][4][5] For a stock already trading near its 52-week high, that kind of earnings momentum can help justify elevated multiples, especially when paired with a historically favorable seasonal backdrop.
Macro and sector backdrop
McKesson sits at the center of a powerful structural trend in healthcare: the shift toward high-cost, high-complexity specialty medicines. Increased demand for treatments targeting cancer, autoimmune conditions such as rheumatoid arthritis, and other chronic diseases has been a major driver of the company’s revenue and profit growth.[2] These drugs often require specialized handling, distribution and patient support, areas where McKesson has invested heavily.
Within the broader healthcare and pharmaceuticals sector, McKesson’s focus on oncology services and specialty drug distribution has helped it capture a larger share of the value chain.[4] As payers and providers look for partners that can manage both cost and complexity, scale players like McKesson have gained leverage, which in turn supports pricing power and margin resilience even in a more regulated environment.
That macro tailwind matters for the seasonal story because it suggests the fundamental backdrop behind the past decade of strong spring windows has not faded. If anything, the demand profile for specialty drugs has become more entrenched, giving investors a clearer line of sight on earnings even as the stock trades near all-time highs.[2][4]
Valuation and positioning
Specific valuation multiples are not detailed in the available data, but the combination of a near-record share price, double-digit earnings growth and repeated guidance hikes implies that investors are willing to pay up for McKesson’s cash flow and market position.[1][2][4][5] The key question for the next 58 trading days is whether that premium expands further or consolidates as the company moves toward its next earnings update.
With the stock trading well above its 50-day moving average and only a few percentage points below its 52-week high, positioning does not look washed out, but it is far from distressed.[1] That leaves room for both upside follow-through if the seasonal pattern repeats and sharper pullbacks if macro or company-specific news disappoints during the window.
What to watch as the window opens
The 58-day spring window for McKesson starts on Mar 26, 2026, and history says it has been a friendly stretch for long exposure, with 10 winners and zero losers across the past decade. The most important thing to watch is whether the stock can hold above its 50-day moving average near 893 and make another run at the 52-week high around 999 as the window progresses.[1] A pattern of higher highs and higher lows inside the window would line up cleanly with the historical seasonal bias.
Earnings timing will also matter. While the next earnings date is not specified, any guidance updates or commentary on specialty drug demand during the window could either reinforce or challenge the bullish seasonal backdrop.[1][2][4][5] Stronger-than-expected numbers or another guidance raise would fit the script of prior winning years, while a miss or cautious tone could be the catalyst that finally breaks the 10-for-10 streak.
Traders should keep an eye on volume patterns as well. The February 17% spike came with a high-volume session that signaled institutional conviction behind the move.[1] If the seasonal window sees renewed volume surges on up days, that would suggest big money is leaning into the historical pattern; if rallies occur on light volume or heavy selling emerges on down days, it would hint at distribution instead.
Finally, watch how the stock behaves on pullbacks inside the window. Past years have seen intraperiod drawdowns as deep as nearly 10% before finishing higher, so a sharp dip would not automatically mean the pattern has failed. The tell will be whether buyers step in near key support levels and push the stock back toward the top of its range, or whether any break lower persists and turns this spring into the first real outlier in an otherwise remarkably consistent seasonal run.
Sources
- [1] Forbes, "How McKesson Stock Surged 17% In A Day," Feb 06, 2026.
- [2] Reuters, "Mckesson lifts annual profit forecast on robust demand for specialty drugs," Aug 06, 2025.
- [4] Reuters, "McKesson raises annual profit forecast on robust demand for specialty drugs," Nov 05, 2025.
- [5] McKesson Corporation, "McKesson Reports Fiscal 2025 Fourth Quarter and Full Year Results," May 08, 2025.