Crude Oil (CL) Shorts Have Averaged 14.65% Profits in This 115-Day Midterm-Year Decline
Crude Oil is hovering near $85 as it heads toward a midterm-year seasonal window that has usually rewarded shorts, just as geopolitical risk keeps volatility elevated.
Price as of Jul 22, 2026: $85.18 (intraday).

What is the seasonal pattern for Crude Oil (CL)?
Crude Oil has fallen in 7 of 8 midterm-year windows starting around Jul 31 and lasting 115 days, with an average 14.65% gain in winning short years.
- 7 wins and 1 loss for the short side in this 115-day window across the last 8 midterm election years.
- Percent Profitable is 88%, with 7 winning short years and just 1 losing year in the sample.
- Average profit in winning years is 14.65%, while Avg Profit - All, including the lone loss, is still a hefty 13%.
- The window runs from Jul 31 for 115 trading days, covering late summer into early winter in midterm election years.
- Historical drawdowns have been meaningful, with several years showing adverse moves greater than 18% before the trend reasserted lower.
- Risk-adjusted performance is strong, with a Sharpe ratio of 1.32 and a TradeWave Ratio of 2.91 for this short-side pattern.
According to historical data from TradeWave.ai, this midterm-year stretch in Crude Oil has behaved very differently from an average quarter, with a distinct short-side bias that traders often overlook.
How has Crude Oil (CL) traded in this midterm-year autumn window?
Crude Oil has delivered profitable short-side trades in 7 of the last 8 midterm election years during the 115-day window that begins on Jul 31, with average winning gains of 14.65% and an all-years average of 13% for shorts. Futures settled at $85.17 in the prior session, up 0.7% on the day and sitting well below the 52-week high of $119.48, a reminder that the market has already backed off its triple-digit spike. That combination of a historically bearish seasonal window and a market still trading in the upper half of its 52-week range is the setup energy desks are watching as late summer approaches.
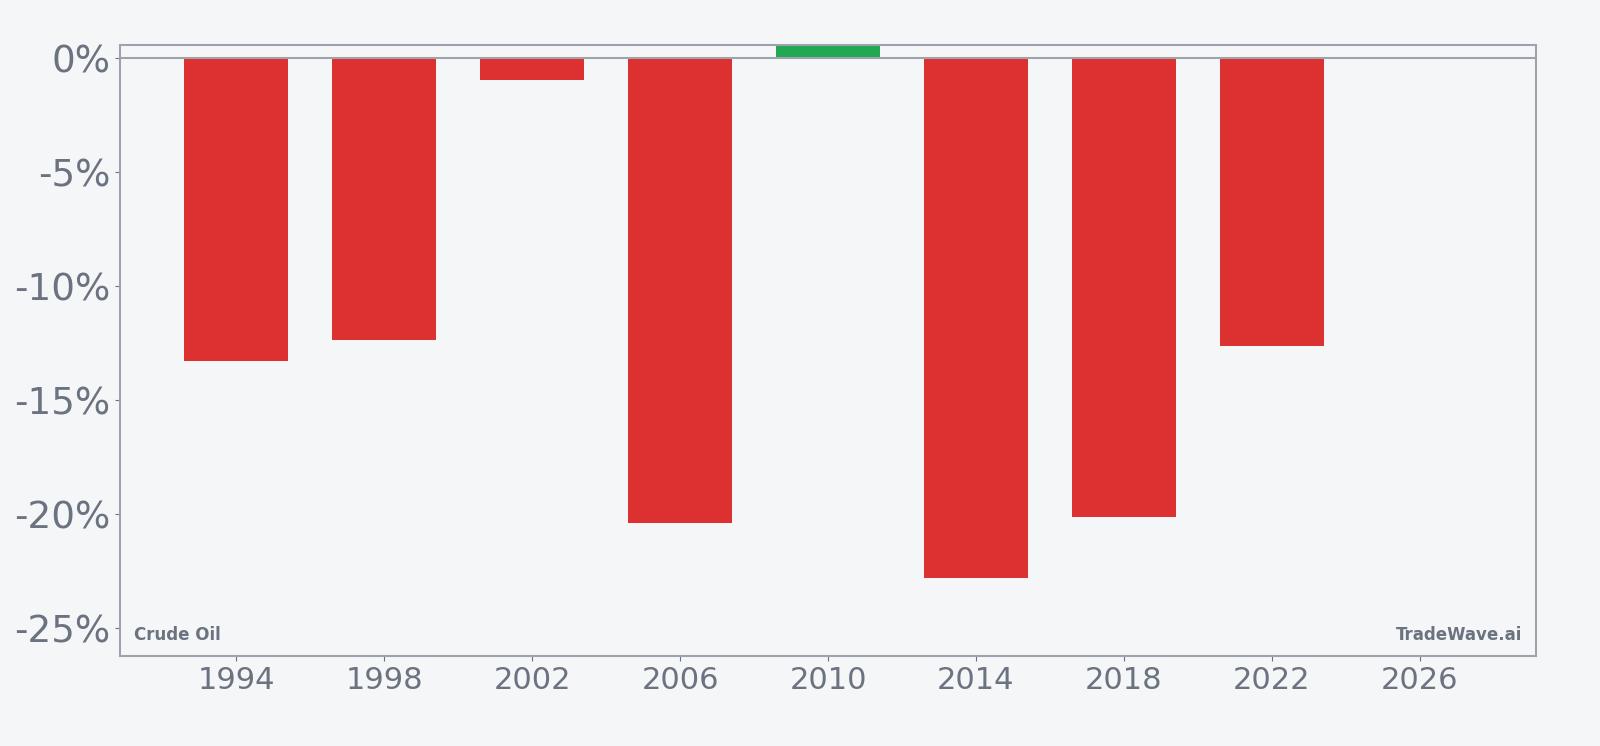
Because this pattern is grouped by the presidential election cycle, it only looks at midterm election years, not every calendar year. That matters for crude because midterm years often coincide with shifting policy, sanctions debates and OPEC coordination that can reshape supply expectations heading into the pre-election year.
Historically, this 115-day stretch has been a weak seasonal window for the underlying Crude Oil contract and a strong one for traders positioned short. Percent Profitable sits at 88%, with 7 winning short years against just 1 losing year, and the median profit for the pattern is 12.95%, which lines up closely with the average winner. The fact that Avg Profit - All is still 13% shows that the lone losing year did not meaningfully dent the overall record.
The per-year table shows how this plays out in practice. In 2014, for example, Crude Oil fell 22.81% from an entry near $98.17 to an exit around $75.78 during the window, a textbook favorable outcome for shorts. In 2006, the contract dropped 20.38% from roughly $74.40 to $59.24, again aligning with the pattern’s short-side bias. The weakest year for the pattern was 2010, when Crude Oil finished the window up 0.49%, a small loss for shorts despite an intraperiod drawdown of 13.01% against the trade.
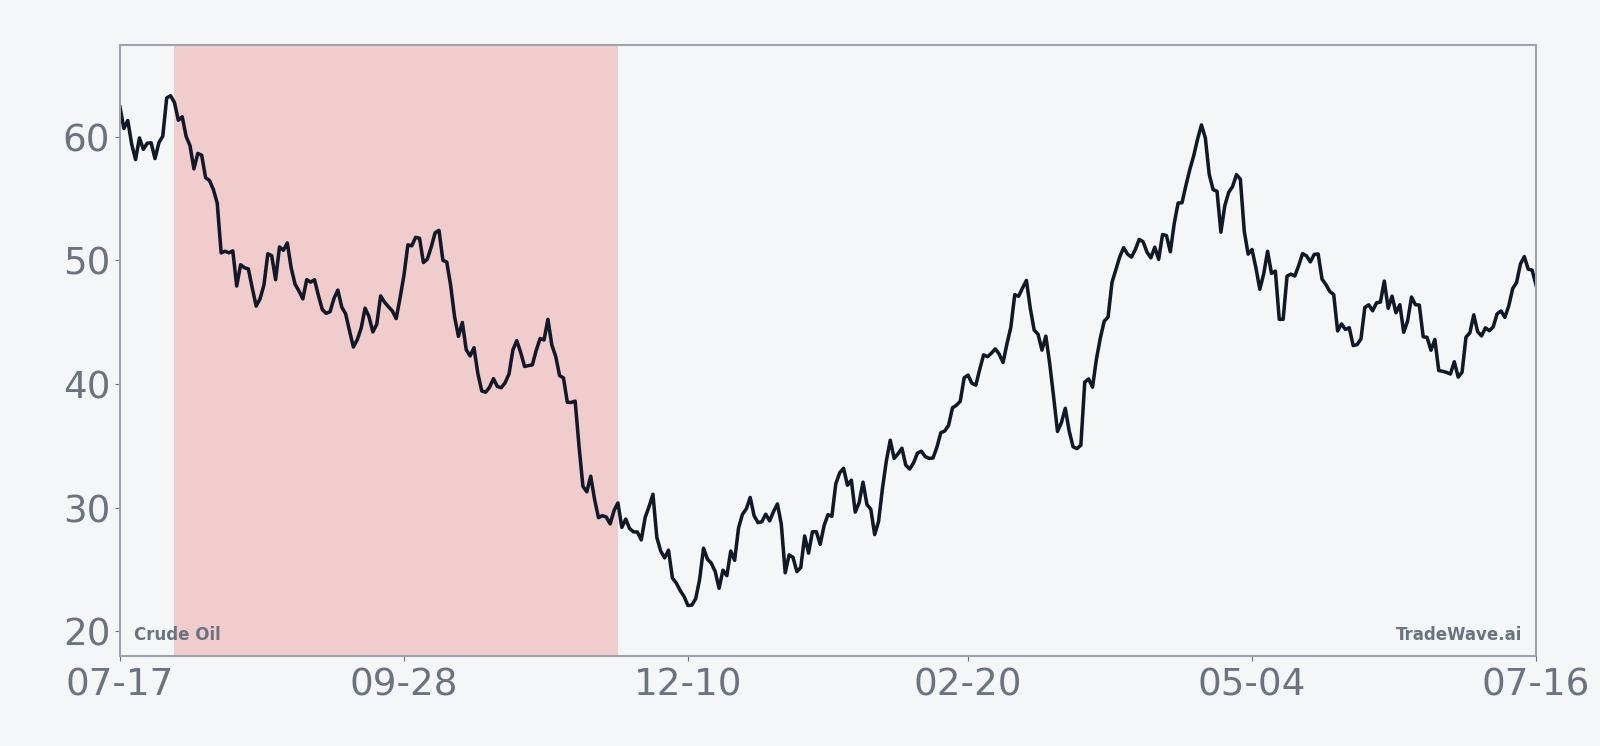
The historical seasonal trend chart suggests that much of the favorable move for shorts tends to build steadily rather than in a single crash. The average path slopes lower across the window, with only brief countertrend rallies, which means the pattern has not relied on one-off shocks to work.
Year-by-year bars with maximum favorable and adverse moves fill in the risk and reward profile behind that smooth average line.
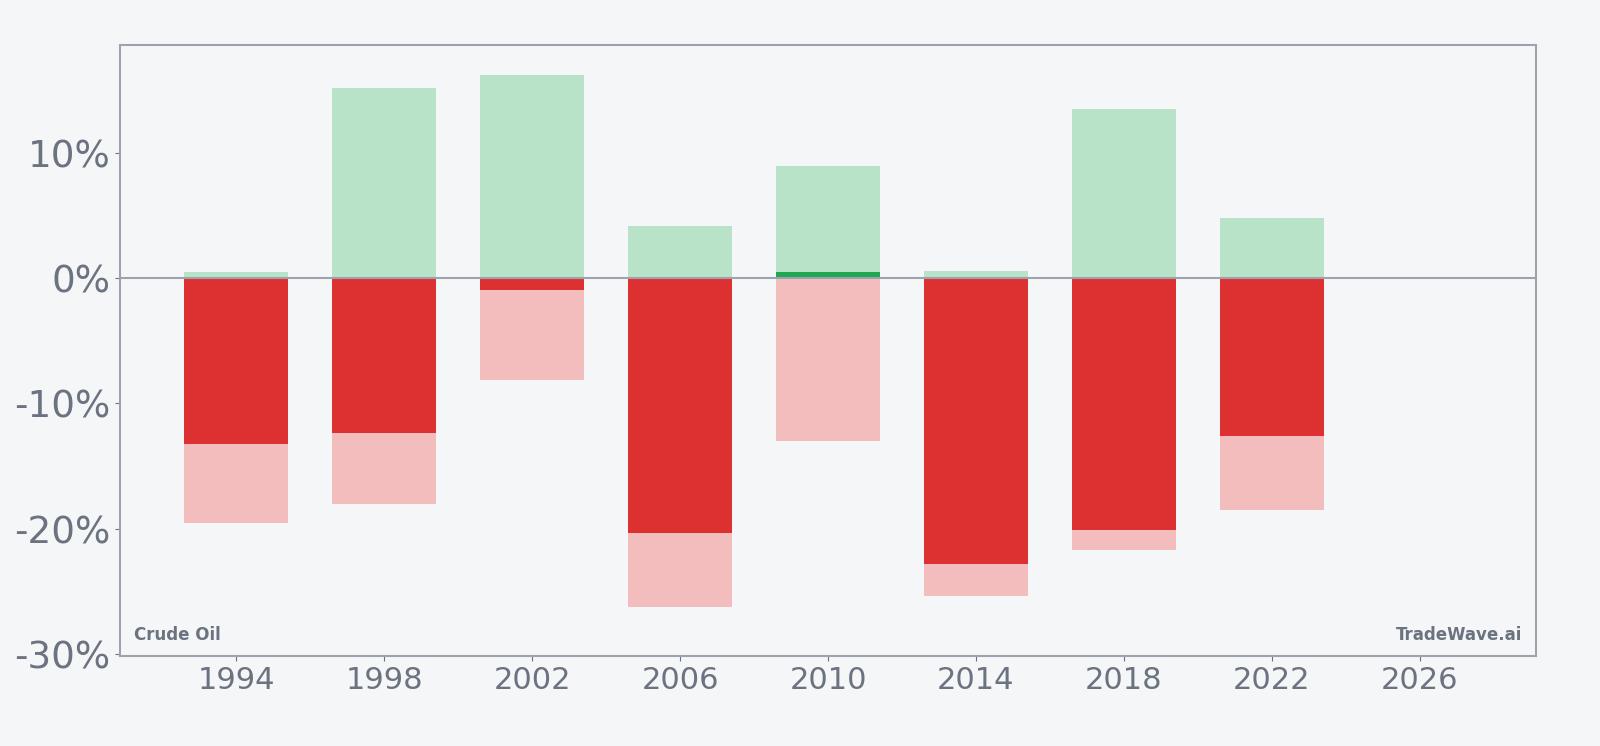
The bars with MFE and MAE show that even in strong short years, Crude Oil has often staged sizable rallies before rolling over. In 1998, for instance, the net return for shorts was a 12.39% gain, but the contract first rallied as much as 15.13% against the position before sliding lower, while the worst drawdown in 2014 reached 25.38% against shorts before the final 22.81% gain. That mix of large favorable and large adverse excursions is captured in the TradeWave Ratio of 2.91 and a standard deviation of 8.69%, which together point to a window where moves tend to be both directional and volatile.
History does not guarantee future results; adverse excursions (MAE) can be large even in winning windows.
Why does Crude Oil (CL) follow this seasonal pattern?
One likely driver is commodity supply and demand seasonality, as refinery maintenance, winter fuel switching and year-end inventory management often cluster in this late-summer to early-winter stretch. Analysts have also pointed to policy and sanctions decisions that frequently surface in midterm election years, which can shift expectations for future supply and encourage hedging activity. The pattern may reflect a blend of these physical and policy forces, which together have tended to pressure crude prices lower in this specific phase of the presidential cycle.
What is driving Crude Oil (CL) today?
Crude Oil futures closed the prior session at $85.17, up 0.63 on the day, a 0.7% gain that leaves the contract about 28.7% below its 52-week high of $119.48 and well above the 52-week low of $54.98. The front-month contract has climbed 10.16% over the past month, trading slightly above its 50-day moving average of $84.20 on relatively light volume of 16,843 contracts versus a 20-day average of 241,590, a sign that the latest bounce has not yet drawn in heavy participation.
In March 2026, analysts at Ritterbusch & Associates flagged the risk that unresolved conflict in the Middle East could push WTI toward the mid-$90s, underscoring how quickly geopolitical shocks can override near-term supply concerns.[3] Earlier that month, weekend trading saw WTI futures spike above $102 per barrel in IG markets after a regular-session close near $99.64, highlighting the kind of gap risk that has periodically hit crude this year.[3] In January 2026, coverage in The Wall Street Journal described how a lingering supply glut was capping prices even as Gulf tensions simmered, a reminder that structural oversupply can blunt the impact of headline risk when demand is soft.[2]
Those cross-currents leave Crude Oil in a familiar tug-of-war between geopolitical risk premia and underlying supply-demand imbalance. On one side sit tail risks tied to the Strait of Hormuz and Iran, which could still trigger sharp upside spikes if flows are disrupted for long. On the other side are references to oversupply and the potential for policy action aimed at cooling prices, which can weigh on rallies when demand growth looks fragile.[2][3]
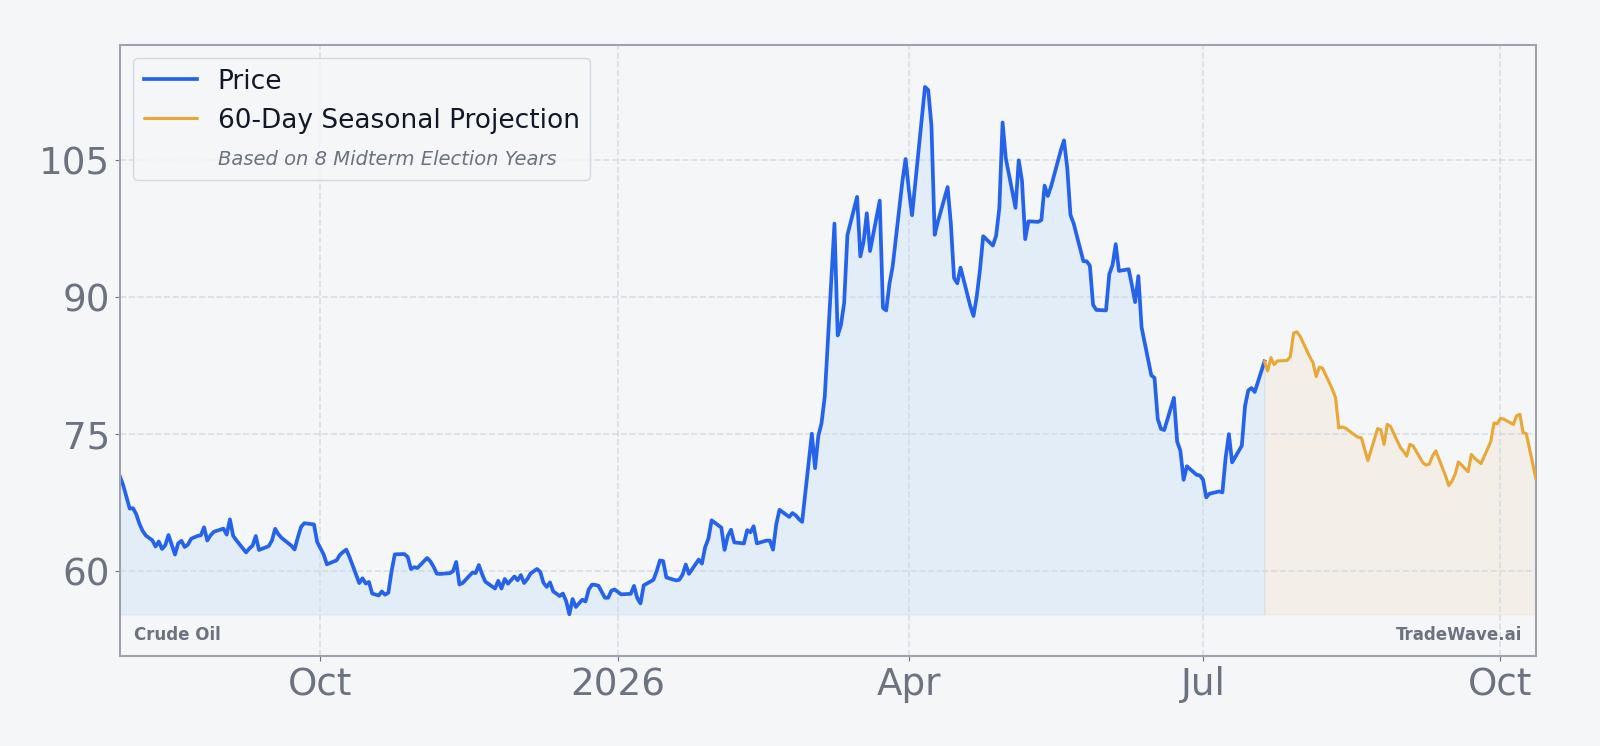
The chart below situates the latest move in its recent multi-month context, alongside a 60-day seasonal projection.
What should traders watch as this seasonal window approaches?
First, the calendar: the 115-day midterm-year window begins on Jul 31, so any sharp move into or out of that date will color how traders interpret the historical pattern. A sustained push back toward the $95 to $100 area would echo the conflict-driven spikes seen in March 2026, while a stall or reversal below the 50-day moving average would look more like the typical seasonal drift lower.[3]
Second, policy and geopolitical headlines will matter for how this CL seasonal trend plays out. Fresh talk of sanctions, strategic reserve releases or military action around key export hubs could inject the kind of volatility that has historically produced large maximum favorable and adverse excursions inside this window. Traders will be watching whether any such shocks create another overshoot to the upside that then fades, as in several prior midterm-year cycles, or whether they break the pattern and keep prices elevated.
Third, watch how intraday ranges and weekend pricing evolve relative to the historical MFE and MAE profile. If rallies during the window keep stalling after 10% to 15% moves and then roll over, that would rhyme with years like 1998 and 2018, where early strength gave way to sizable declines by the end of the window. If instead Crude Oil grinds higher with only shallow pullbacks, that would look more like the rare losing year for shorts and would signal that the current macro backdrop is overpowering the usual midterm-year seasonal pull.
Finally, energy desks will track how this CL seasonal pattern interacts with broader risk assets as the midterm election year gives way to the pre-election year. Historically, weakness in crude during this phase has sometimes eased inflation pressure and supported equities, while surprise strength has done the opposite. How Crude Oil behaves inside this specific 115-day window will offer an early read on which of those paths markets are taking into 2027.
Sources
- Seeking Alpha: Trump eyes Iran oil seizure, Kharg Island takeover amid Kuwait attacks and rising crude - report (Mar 30, 2026)
- The Wall Street Journal: Oil Steady as Supply Glut Offsets Gulf Tensions (Jan 2, 2026)
- Seeking Alpha: Crude oil turns lower as Trump officials signal imminent action to reduce price pressure (Mar 6, 2026)
About this seasonal analysis
Seasonal pattern data is sourced from TradeWave.ai, which analyzes historical price behavior across annual calendar windows going back up to 30 years. Read the full data methodology or the book The 100-Year Pattern by Afshin Moshrefi (2026 edition). Past performance of seasonal patterns does not guarantee future results. This article is for informational purposes only and does not constitute investment advice.