Crude Oil (CL) Has Dropped in 7 of 8 Midterm Windows Starting Apr 30, Averaging 13%
Crude Oil is hovering near $91 as traders brace for a midterm election-year seasonal window that has historically rewarded short exposure and delivered sharp swings.

What is the seasonal pattern for Crude Oil (CL)?
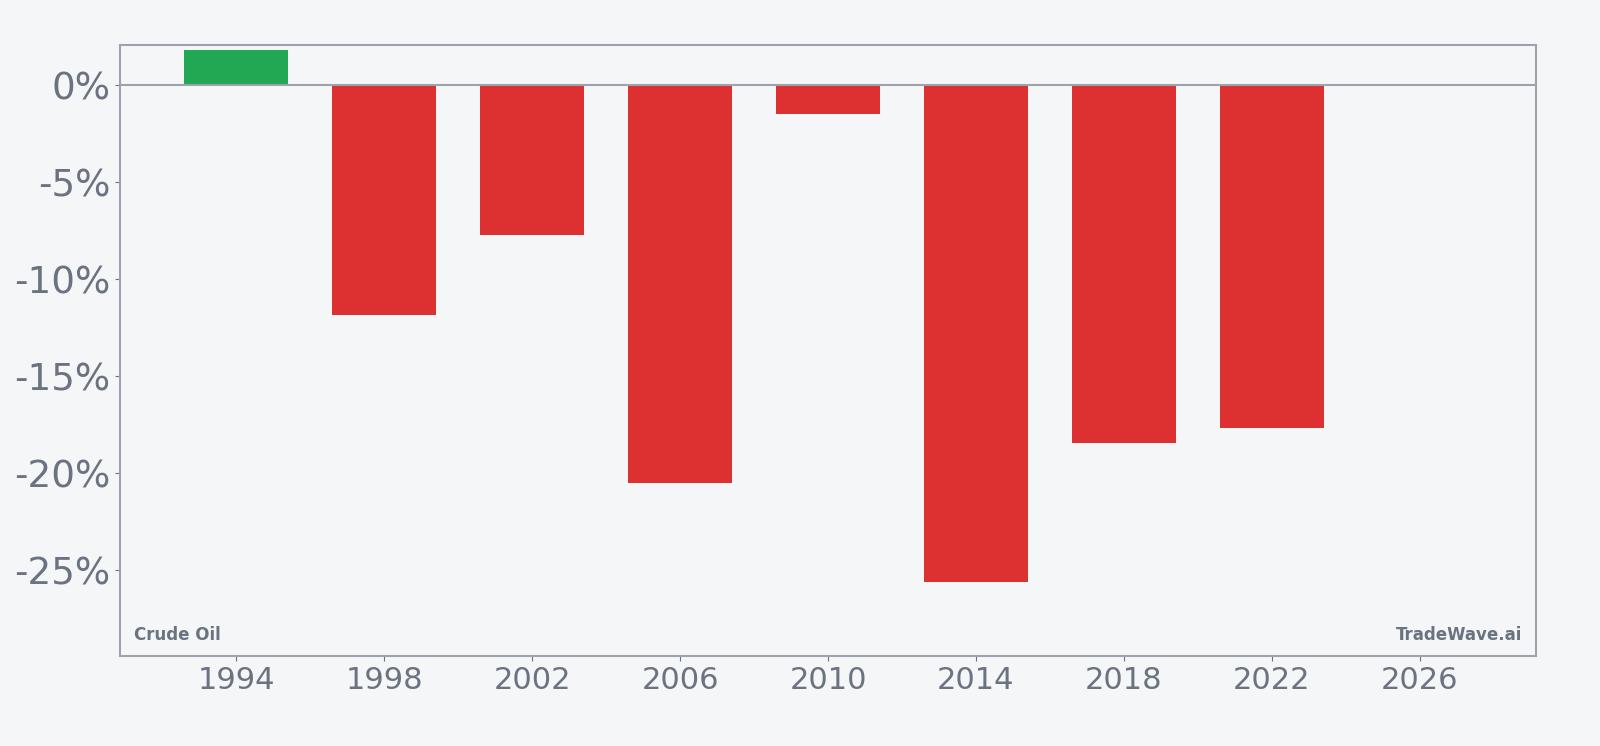
Crude Oil has fallen in 7 of 8 midterm election-year windows starting around Apr 30, with an average gain of 14.75% in winning short years.
- 7 wins and 1 loss for short positions in this window, with winning years averaging 14.75% moves in the trade direction.
- The upcoming Crude Oil trading window starts on Apr 30 and runs for 198 days across the last 8 midterm election years.
- Percent Profitable sits at 88%, with 7 winners and 1 loser for the short-side seasonal pattern.
- Avg Profit in winning years is 14.75%, while Avg Profit - All, including the lone losing year, is still a strong 13%.
- Individual years have seen adverse moves as deep as about 26% against the short side before ultimately resolving lower.
- The CL seasonal trend in this window has typically started choppy, then leaned into more persistent downside as the months progress.
According to historical data from TradeWave.ai, this midterm election-year stretch in Crude Oil has behaved very differently from an average calendar period, and the next iteration is about to open.
How has Crude Oil (CL) traded in this midterm-year window?
Crude Oil has delivered profitable short-side results in 7 of the last 8 midterm election-year windows that begin around Apr 30 and run for 198 days, with an average 14.75% gain in winning years. Today CL futures trade near $91.49, leaving the contract about 23.5% below its 52-week high of $119.48 and well above the $55 area that marked the 52-week low.[1]
The window matters because it is grouped by the presidential election cycle, focusing only on the last 8 midterm election years rather than every calendar year. Energy markets often sit at the center of policy debates in these years, from sanctions and strategic reserve releases to environmental rules, and that policy calendar can shape both demand expectations and supply behavior in ways that repeat from cycle to cycle.
Across those 8 midterm-year samples, the pattern is unambiguously aligned with the short side. Percent Profitable is 88%, with 7 winners and just 1 losing year, and the all-years average outcome is a sizable 13% move in favor of shorts over the 198-day stretch. The single losing year, 1994, saw CL rise about 1.81% against the short, while the strongest short year, 2014, delivered a 25.6% decline from roughly $100 to $74 by the end of the window.
The return distribution shows that when the pattern works, it tends to work in a big way. Net returns for successful short years range from about 7.7% in 2002 to that 25.6% slide in 2014, with several mid-teens declines in 2018 and 2022 as well. Even after including the lone up year, the Avg Profit - All of 13% is still robust for a regime that lasts roughly two-thirds of a year.
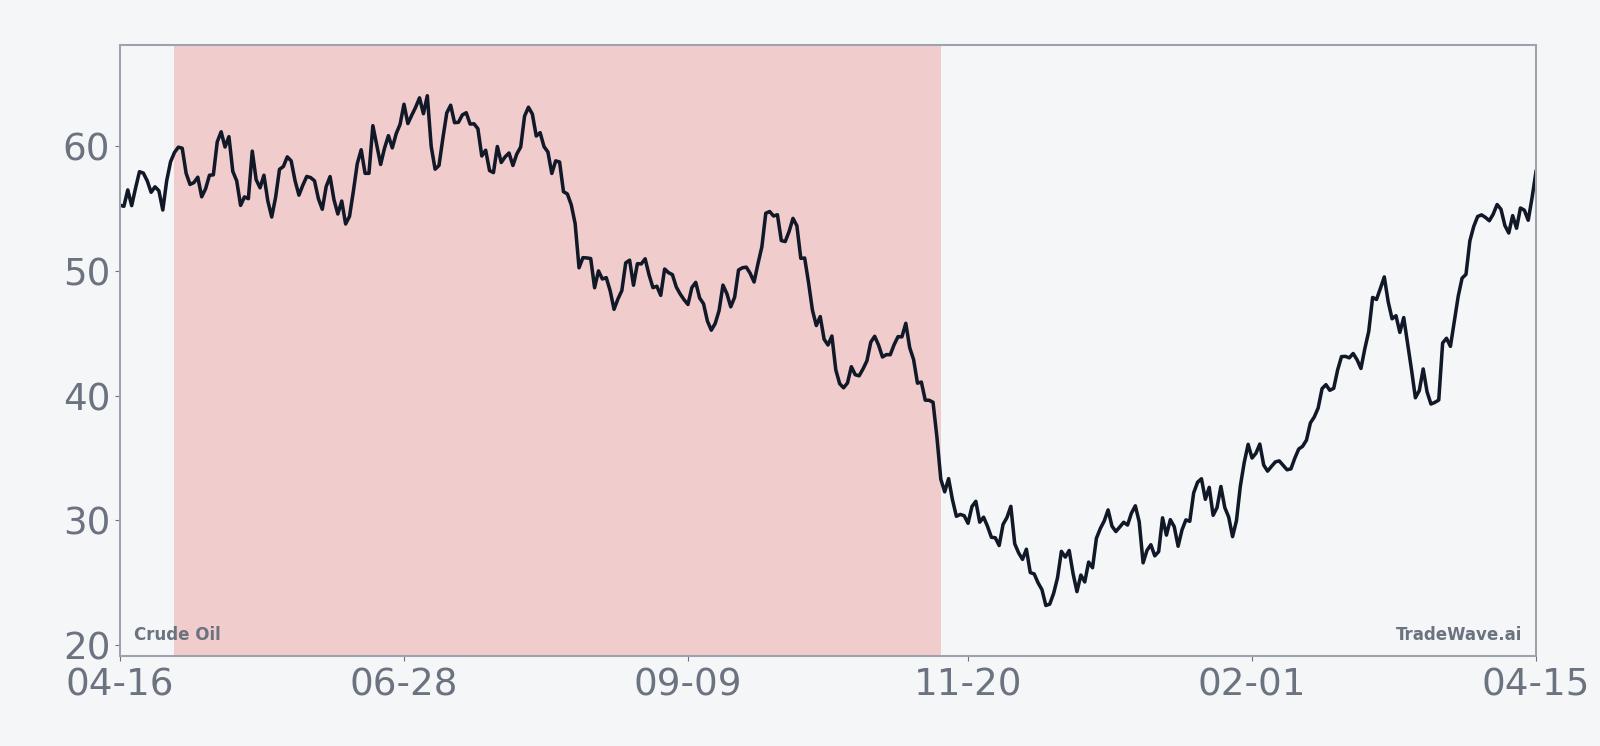
The historical seasonal average suggests that CL often chops early in the window before leaning into more persistent downside later in the period. That fits the per-year pattern, where several cycles saw modest rallies or sideways action in the first weeks before deeper declines unfolded as the midterm year progressed into the following pre-election year.
The combined net, best-case and worst-case moves by year show how far Crude Oil has tended to travel in both directions inside this window.
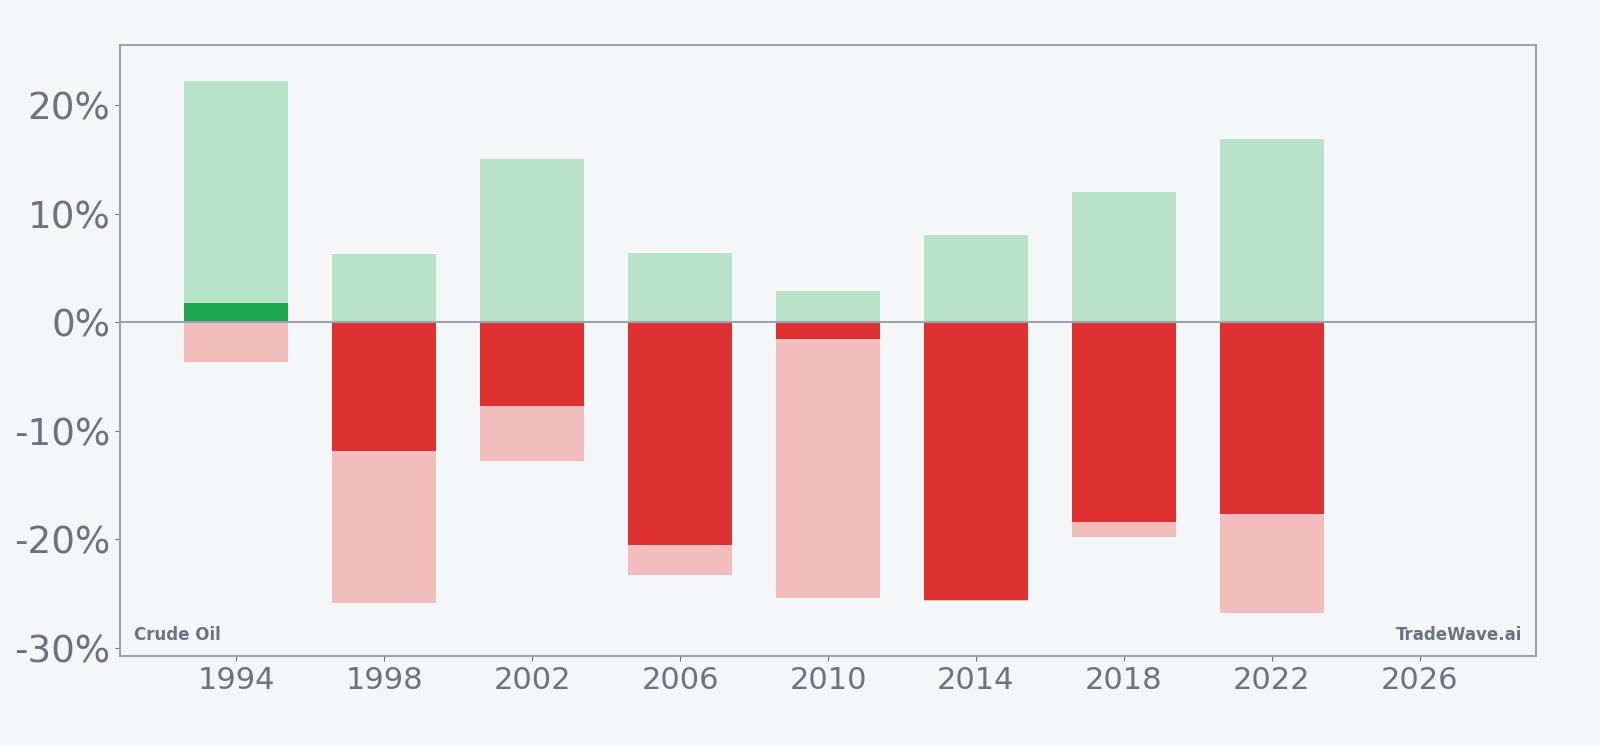
Intraperiod swings have been large in both directions. In the strongest short year, 2014, the best point-to-trough move in favor of shorts reached about 25.74%, while the worst countertrend rally against the position was still more than 8%. In 2022, the maximum favorable move for shorts was 26.8%, but the worst drawdown against them was nearly 17%, underscoring how violent squeezes can be even in ultimately successful windows.
On the other side, the lone losing year for shorts, 1994, still featured a maximum favorable move of 22.26% before reversing and finishing slightly higher than the entry. That is a reminder that the TradeWave Ratio of 2.23 reflects how far price typically travels in the trade direction within the window, not just where it ends. For traders, the message is that this window has historically offered big swings to harvest, but also big intraperiod pain if risk is not managed tightly.
History does not guarantee future results; adverse excursions (MAE) can be large even in winning windows.
Why does Crude Oil (CL) follow this seasonal pattern?
This pattern may reflect a mix of commodity supply and demand seasonality and the policy rhythm of midterm election years. One likely driver is that OPEC+ and major producers often reassess quotas and investment plans as they look ahead to the pre-election year, while governments weigh fuel-price relief measures that can cap rallies. Analysts have also pointed to demand softness after the peak summer driving season and into the northern hemisphere winter as a recurring drag on prices in this part of the cycle.
What is driving Crude Oil (CL) today?
CL futures settled at $91.49 on Apr 15, up 0.2 on the day for a 0.22% gain, after trading between $90.52 and $91.89 on relatively light volume of about 14,000 contracts compared with a 20-day average near 368,000.[1] The contract has slipped roughly 5.01% over the past month but still sits well above its 50-day moving average around $83.45, keeping the broader uptrend from last year intact.[1]
Geopolitics remain the main near-term driver. In March, Brent crude logged a fifth straight weekly gain as the United States sent more troops to the Middle East, with traders bidding up risk premiums around key shipping lanes and regional production hubs.[2] At the same time, some analysts warn that if the Strait of Hormuz were to be closed for an extended period, crude prices could spike above $200 per barrel and tip the global economy toward recession, a tail risk that keeps volatility priced into the curve.[2]
Balancing those fears, other commentary has highlighted the potential for a supply glut to reassert itself if OPEC+ output increases collide with only modest demand growth, a setup that could keep prices in a broad $55 to $65 range in early 2026 once current tensions ease.[3] Inventory data already show U.S. crude stockpiles rising by about 400,000 barrels in the week ended Dec 19, 2025, hinting at a market that is not yet structurally tight.[3]
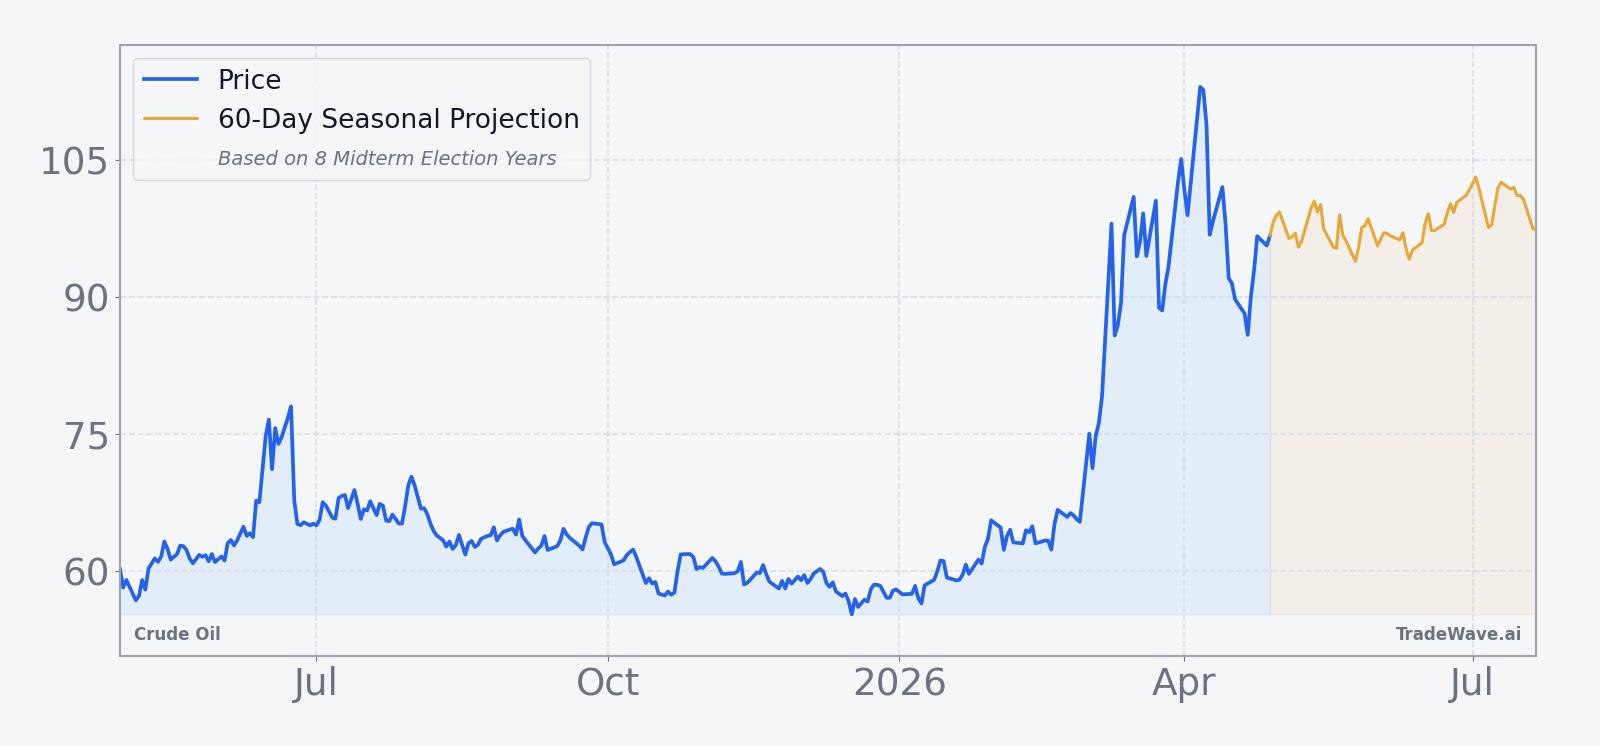
Crude Oil is therefore entering this midterm election-year seasonal window from a position of strength, with spot prices elevated and geopolitical risk premiums high. Even so, the historical pattern points to a long stretch where short exposure has tended to work, and where both rallies and selloffs have unfolded quickly once policy and supply headlines shift.
The chart below situates the latest move against the past year of trading and a short-term seasonal projection.
What should traders watch as this seasonal window opens?
First, watch how CL behaves as the window kicks off around Apr 30. Historically, early strength has not invalidated the pattern, but deeper downside has tended to emerge later in the 198-day stretch, especially once summer demand peaks and policy debates around fuel prices and strategic reserves intensify.
Second, monitor key macro catalysts tied to the policy calendar. Any escalation or resolution around Middle East shipping routes, particularly the Strait of Hormuz, could either reinforce or overwhelm the usual seasonal drift lower, with a prolonged disruption carrying clear upside risk relative to the historical pattern.[2]
Third, keep an eye on inventory trends and OPEC+ signaling. Rising U.S. stockpiles and hints of looser production discipline would line up with the historical midterm-year tendency for CL to struggle over this window, while surprise cuts or stronger-than-expected demand could compress or delay the typical downside path.[3]
Finally, price action itself will be the real-time test of this CL seasonal trend. If rallies toward the prior 52-week high fade quickly and intraperiod drawdowns start to resemble the double-digit adverse moves seen in past cycles, that would echo the historical short-side edge. A sustained breakout to new highs with shallow pullbacks, by contrast, would mark a clear departure from how this midterm election-year window has behaved in the past.
Sources
- [1] Seeking Alpha: Brent crude climbs for fifth straight week as U.S. sends more troops to Middle East (Mar 20, 2026)
- [2] Seeking Alpha: Brent crude climbs for fifth straight week as U.S. sends more troops to Middle East (Mar 20, 2026)
- [3] Forbes: Crude Oil’s Seasonal And Technical Outlook (Jul 24, 2025)
About this seasonal analysis
Seasonal pattern data is sourced from TradeWave.ai, which analyzes historical price behavior across annual calendar windows going back up to 30 years. Read the full data methodology or the book The 100-Year Pattern by Afshin Moshrefi (2026 edition). Past performance of seasonal patterns does not guarantee future results. This article is for informational purposes only and does not constitute investment advice.