Natural Gas (CME) (NG) Has Rallied in 8 of 8 Midterm Spring Windows Since 1994
Natural Gas (CME) is hovering just above $3 as it heads into a short midterm-election spring window that has quietly delivered gains in every cycle since 1994.
Key takeaways
- Natural Gas (CME) enters a 12-day midterm-election spring window on Mar 22 that has produced gains in all 8 historical cycles.
- The pattern is long-biased, with 100% Percent Profitable, 8 winners and 0 losers, and an Avg Profit of 5.67% across those years.
- The TradeWave Ratio of 2.19 signals that price has typically traveled meaningfully in the trade direction within the window, not just at the close.
- Intraperiod swings have been real: some years saw adverse moves near 8% even though they finished higher.
- NG is trading at $3.031 today, well off last year’s extremes, leaving room for either a squeeze higher or another fade if weather and storage shift.
- History shows this short window often starts choppy, then trends higher into the back half, which traders will be watching against the current macro backdrop.
According to historical data from TradeWave.ai, this late-March stretch in midterm election years has behaved very differently from an average month on the natural gas calendar.
Seasonal window
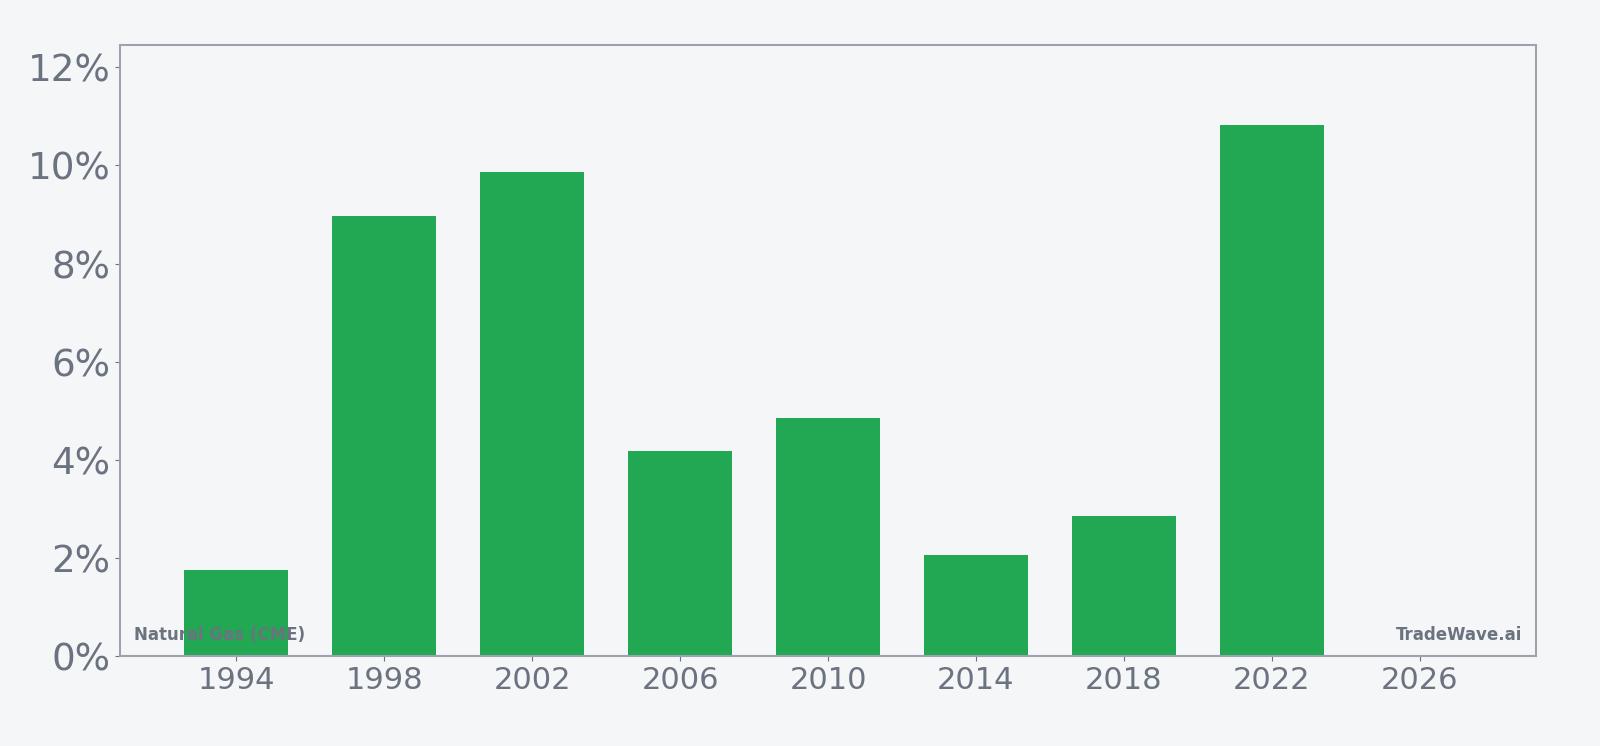
Natural Gas (CME) has risen in all 8 midterm-election-year spring windows that start around Mar 22, averaging 5.67% gains over 12 trading days. Today the front-month contract sits at $3.031, a modest 0.3% higher on the session and well below last year’s $7.827 high, leaving it in the middle of its recent range rather than at an extreme.[2]
The pattern groups the last 8 midterm election years, from 1994 through 2022, rather than consecutive calendar years. That matters because energy markets often trade as much on policy and macro regime as on the weather tape. Midterm years tend to sit between early-term policy pushes and pre-election spending, a phase where regulatory noise, infrastructure debates and supply-side decisions can all intersect with demand shocks.
This seasonal window begins on Mar 22 and spans 12 trading days. Historically, during this period, Natural Gas (CME) has shown a strong upside tendency for long positions, with every single midterm-year sample finishing in the green. The trade direction in the pattern is explicitly long, so those positive returns line up with the intended bias rather than coming from short squeezes.
Across those 8 cycles, Percent Profitable is 100%, with 8 winners and 0 losers. Average gains across all years land at 5.67%, while the median outcome is a 4.52% rise, which tells you the pattern is not just being skewed by one outlier year. The strongest close-to-close gain came in 2022, when NG rallied 10.83% during the window, while the softest still-positive year was 1994, up 1.76%.
Average winner gains of 5.67% sit alongside a Sharpe ratio of 1.51 for this window, which is high for a commodity that often trades like a weather lottery. The TradeWave Ratio (TWR) of 2.19 reflects how far price typically travels in the trade direction within the window regardless of the final close, hinting that intraperiod rallies have often been larger than the end-of-window print.
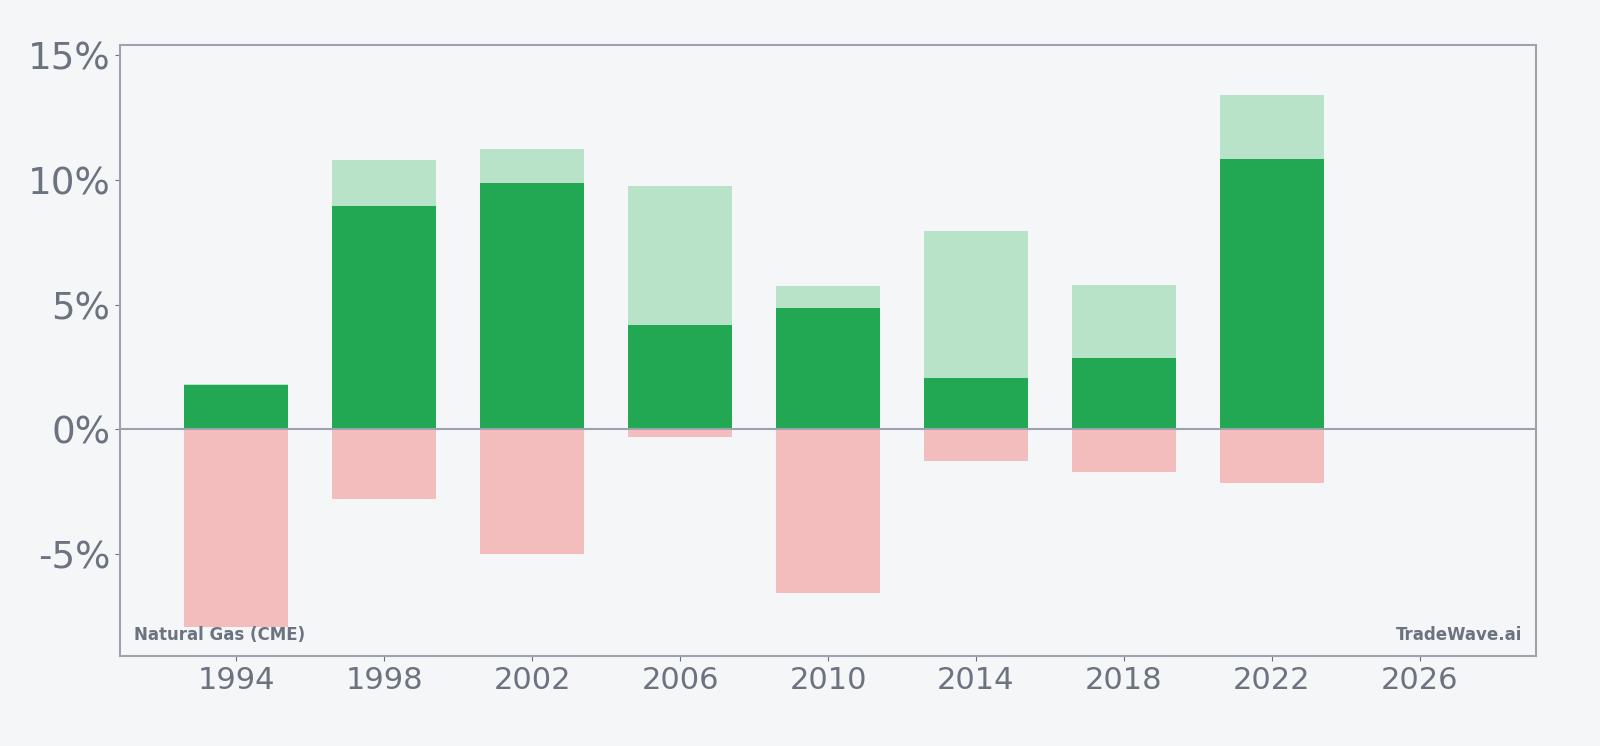
Intraday and intraperiod swings have not been one-way. In 1994, for example, the contract finished the window up 1.76% but suffered a worst drawdown of about 7.93% from the entry before recovering. In 2010, NG closed higher by 4.85% yet still saw an adverse move of 6.59% at one point. On the flip side, the best point-to-peak moves, or maximum favorable excursions, have reached into double digits, such as 13.41% in 2022 and 11.24% in 2002.
The year-by-year path shows a common rhythm. Many cycles start with a modest wobble or sideways trade in the first few sessions, then build more consistent upside into the back half of the 12-day stretch. That pattern of early chop followed by a stronger finish is visible in several years, including 1998, 2006 and 2018, where the maximum favorable move outpaced the final net gain.
Yearly net and peak moves highlight upside persistence amid typical drawdowns.
The cumulative return profile across the eight midterm-year samples climbs steadily rather than in fits and starts, which is unusual for a contract known for violent reversals. Add it up: 54% cumulative gains across those eight short windows, with no losing years in the sample. History does not guarantee a repeat, but the consistency across three decades is hard to ignore.
History does not guarantee future results; adverse excursions (MAE) can be large even in winning windows.
Price and near-term drivers
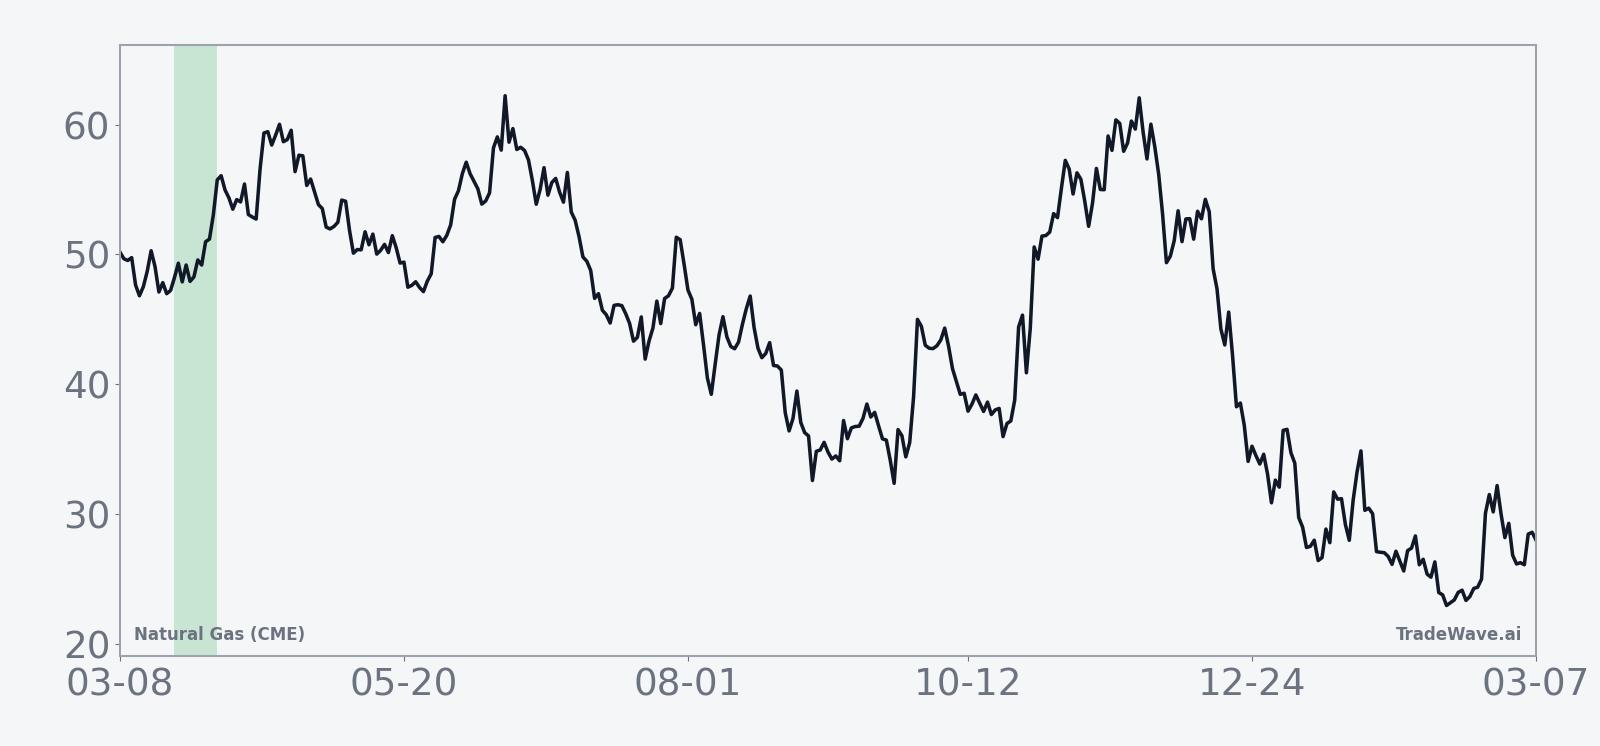
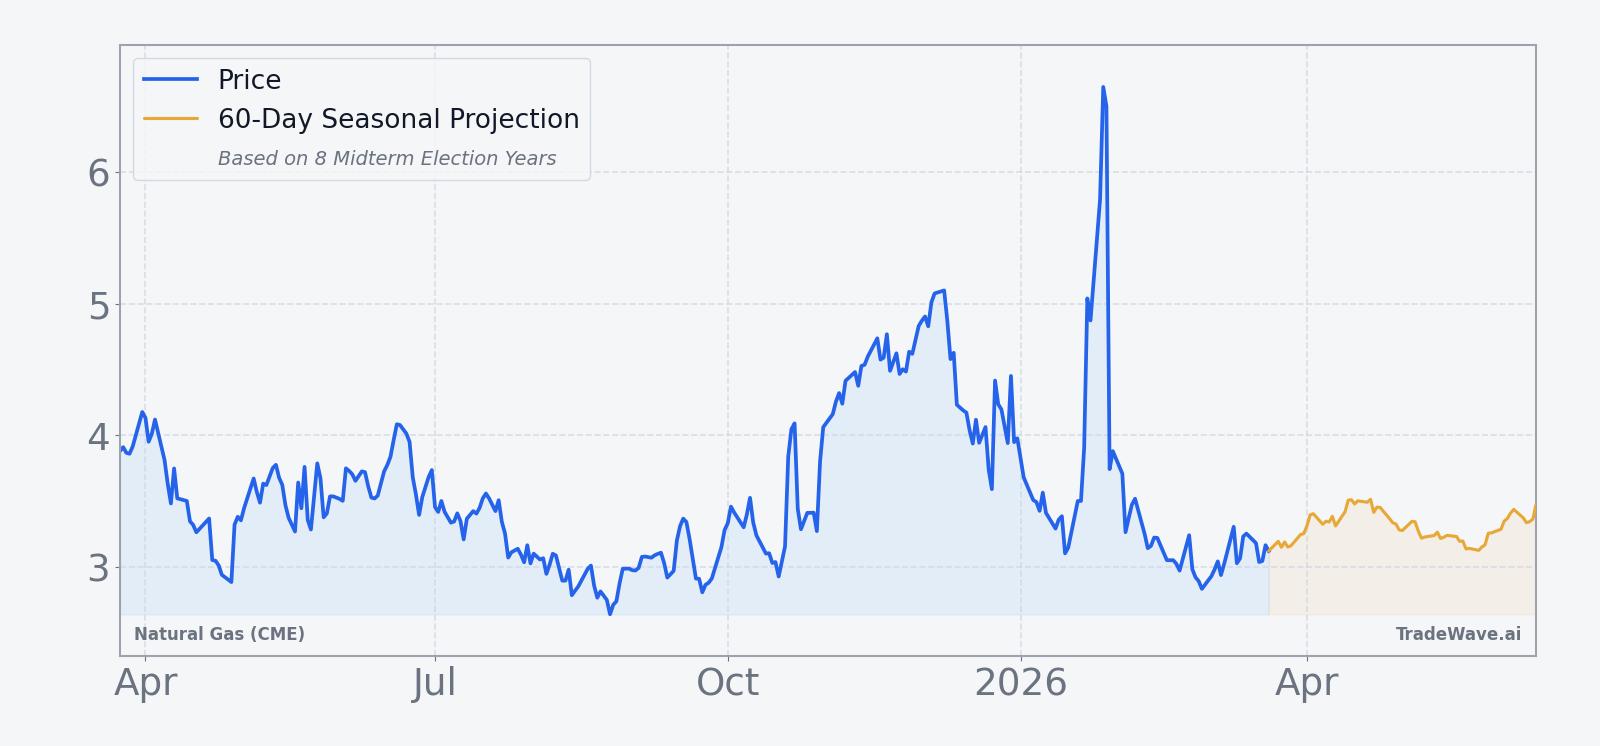
Front-month Natural Gas (CME) futures settled at $3.031 on Tuesday, up 0.008 on the day, as the contract continues to trade in a relatively tight band after last year’s collapse from a 52-week high of $7.827 to a low of $2.622.[2] The one-month return sits at 2.15%, and with the 50-day moving average up at $3.594, NG remains below a key trend gauge even after a winter marked by sharp weather-driven spikes and fades.[2]
In January, a burst of bitter cold across key U.S. demand centers sent natural gas futures sharply higher as traders scrambled to reprice heating demand and storage draws.[2] That episode followed a 2025 backdrop where mild temperatures and ample supply repeatedly pressured prices, with several late-year pullbacks tied to forecasts for less extreme cold and ongoing storage surpluses.[3][4][5][6][7] The result is a market that has been whipsawed between weather shocks and a structural story of robust production and comfortable inventories.
Macro themes remain familiar. Weather still dominates short-term price action, with cold snaps and heat waves driving demand for heating and cooling, while high supply and storage surpluses tend to cap rallies when forecasts turn milder.[2][3] On the fundamental side, rig counts, production trends and the pace of inventory withdrawals continue to shape the medium-term balance, as seen in late 2025 when expectations for a 169 Bcf withdrawal briefly shifted the narrative from surplus toward potential deficit.[6]
The chart below situates the latest move in its recent multi-month context.
Election-cycle context and why this window matters
The current calendar sits in the midterm election year, which in U.S. politics often brings a mix of policy uncertainty and legislative gridlock. For natural gas, that can translate into noise around pipeline approvals, export permits and environmental regulation, even if the near-term tape still trades on weather. Grouping the seasonal pattern by midterm years isolates how NG has behaved in this specific policy backdrop rather than averaging across very different election phases.
In prior midterm cycles, this late-March window has tended to mark a short but meaningful inflection point. The 2002 and 2022 samples, for instance, came in years when broader energy markets were already volatile, yet NG still managed double-digit maximum favorable moves within the 12-day stretch. At the same time, years like 1994 and 2010 show that even in quieter macro regimes, the contract could swing several percent against the position before finishing higher.
Because natural gas prices feed directly into power costs, industrial margins and, indirectly, inflation expectations, a sharp move in this window can ripple beyond the futures pit. Utilities, LNG exporters and energy-intensive manufacturers all feel the impact when NG jumps 5% to 10% in a matter of days, as it has done more than once in this pattern. That is why a short, statistically strong seasonal window like this can matter even for investors who never touch the contract itself.
What to watch as the window opens
As the Mar 22 window approaches, traders will be watching three things. First, the weather tape: another burst of cold or an early-season heat wave could amplify the historical upside tendency, while a string of mild forecasts would test how much of the pattern is policy-cycle driven versus pure demand shock.[2][3][7] Second, storage and production headlines, especially any signs that withdrawals are tightening balances faster than expected or that output is surprising to the upside.[3][4][6]
Third, price behavior inside the window itself will be key. A familiar script would be early chop with a few percent of downside from entry, followed by a stronger push higher into the back half, echoing the MAE and MFE profile seen in prior years. A clean break above the 50-day moving average near $3.594 during the window would line up with the historical long bias, while a failure to hold the $3 area on mild-weather news would mark a clear departure from the past pattern.[2]
For now, the takeaway is simple: NG is 8 for 8 in this specific midterm-year spring stretch, with meaningful upside moves and real drawdowns along the way. The next iteration starts in days, and how the contract trades through that 12-day span will show whether a three-decade seasonal habit still has teeth in a market reshaped by shale, LNG and shifting policy priorities.
Sources
- [1] The Wall Street Journal, "Natural-Gas Futures Face Mild Temperatures," Oct 3, 2025.
- [2] MarketWatch, "Natural-gas prices soar as temperatures drop," Jan 20, 2026.
- [3] The Wall Street Journal, "U.S. Natural Gas Picks Up Ahead of Storage Data," Dec 10, 2025.
- [4] The Wall Street Journal, "U.S. Natural Gas Extends Pullback on Shifting Weather Outlook," Dec 9, 2025.
- [5] The Wall Street Journal, "U.S. Natural Gas Futures Extend Decline," Dec 12, 2025.
- [6] The Wall Street Journal, "U.S. Natural Gas Futures Gain Ahead of Delayed Storage Data," Dec 29, 2025.
- [7] Reuters, "US natgas prices gain over 2% on mid-July heat forecasts," Jul 2, 2025.