Higher Ending Stocks Pressure Corn (CME) (ZC) Just as a Historically Strong Spring Stretch Nears
Corn (CME) futures are climbing toward late March as a midterm-year spring window that has often rewarded long exposure approaches again for ZC.
Key takeaways
- A 47-day seasonal window for Corn (CME) tied to midterm election years begins on Mar 25 and has historically favored the long side.
- Across the last 6 midterm election years, this window has been profitable in 83% of cases, with 5 winners and 1 loser.
- Winning years have averaged gains of 3.62%, while including all years brings the average outcome to 3% for the window.
- The Trade Direction is long, with a TradeWave Ratio of 1.88 and a Sharpe ratio of 0.89, pointing to a constructive but not risk-free profile.
- Intraperiod swings have been meaningful, with some years showing sizable drawdowns before recovering, so timing and risk limits have mattered.
- Today’s rally leaves ZC about 4.8% below its 52-week high, putting price near the upper end of its recent range as the window approaches.
According to historical data from TradeWave.ai, this specific late-March spring stretch in midterm election years has behaved differently from an average month on the corn calendar, and the next iteration is just days away.
Seasonal window
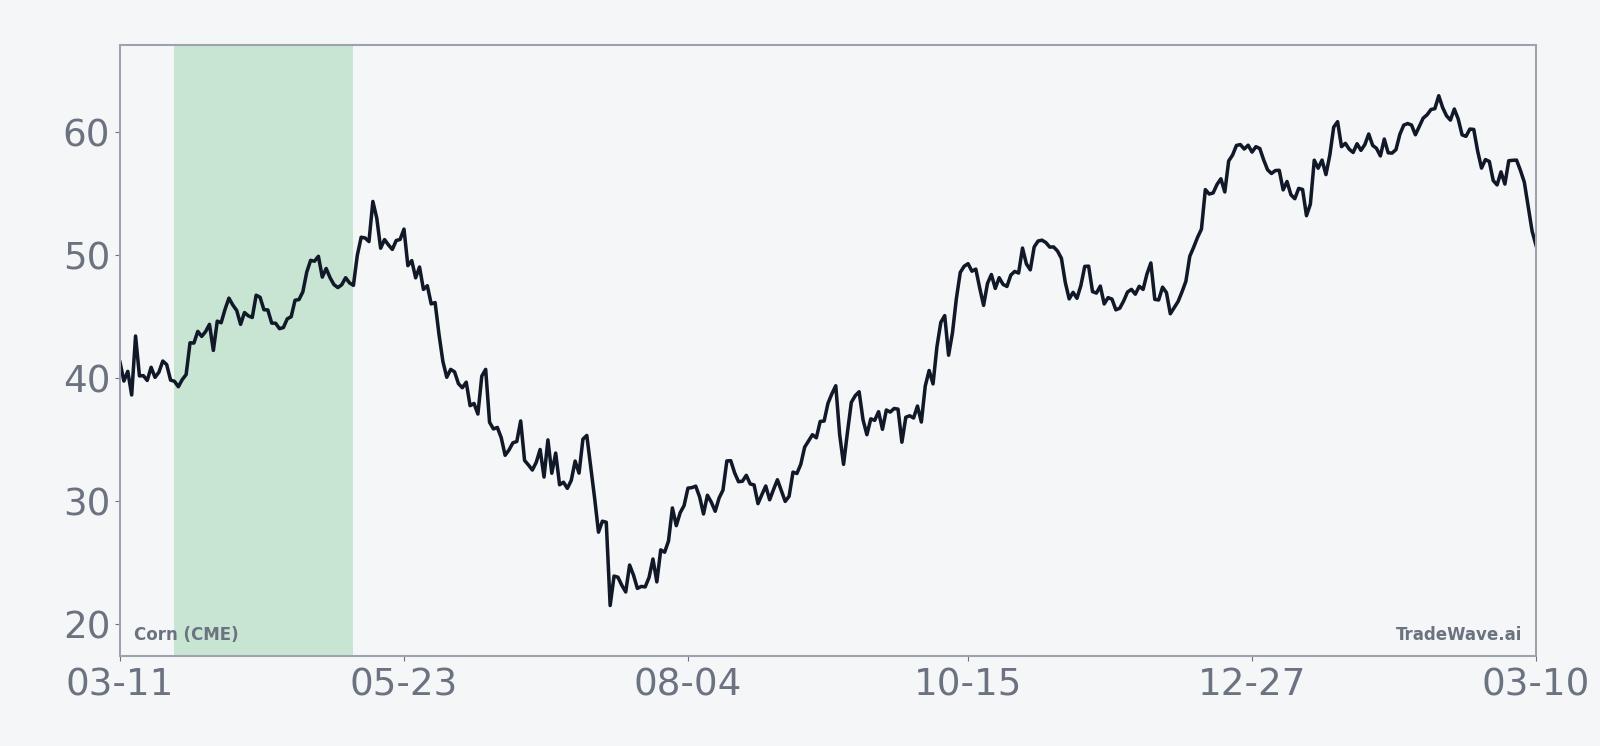
Corn (CME) has risen in 5 of the last 6 midterm election years during this 47-day spring window, averaging 3.62% gains in the winning seasons. Futures are trading at 467.0 cents per bushel, up 4.18% on the day and sitting about 4.8% below the 52-week high of 490.75, with the upcoming window set to open on Mar 25.
Grouping the data by the presidential election cycle matters here because midterm years often bring a different policy and risk backdrop for agriculture than election years or pre-election years. Budget debates, farm-bill positioning and biofuel policy tend to cluster in these mid-cycle periods, which can shift expectations for acreage, demand and hedging behavior in ways that repeat from one midterm year to the next.
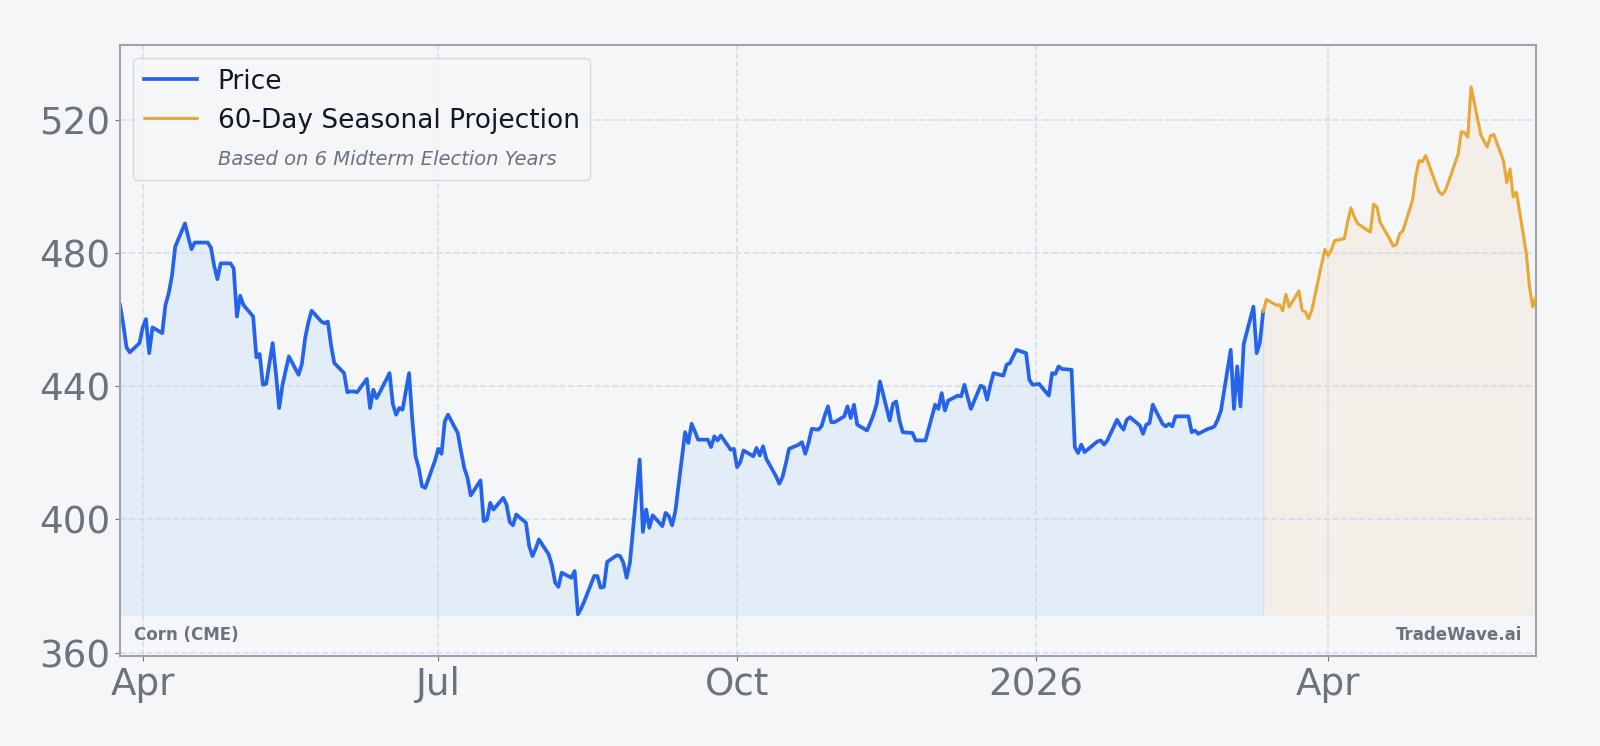
This seasonal window begins on Mar 25 and spans 47 trading days. Historically, during this period in midterm election years, Corn (CME) has shown a constructive bias for long positions rather than a neutral or choppy profile.
The Trade Direction for this pattern is long. Across the last six midterm election years in the sample, 5 windows finished higher and 1 finished lower, giving a Percent Profitable reading of 83% with 5 winners and 1 loser. That skew is notable for a commodity contract that often trades more on weather and headlines than on the calendar.
Average performance has also leaned positive. In the winning years, Corn (CME) gained an average of 3.62% from entry to exit over the 47 days, while including every year in the sample brings the Avg Profit - All to 3%. Avg Profit reflects winners only, while Avg Profit - All includes every year in the sample, so the gap between the two shows that the single losing year did not fully erase the gains from the stronger cycles.
Intraperiod swings have been meaningful. In 2006, for example, the contract finished the window up 3.72% after a maximum favorable move of 10.03% and only a shallow worst drawdown of 0.34% from entry, a clean upside run. In 2002, by contrast, the window ended down 1.71% after a best intraperiod rally of 1.22% and a worst drawdown of 5.98%, illustrating how a midterm-year spring can still deliver a sharp adverse move even when the final result is modest.
The TradeWave Ratio (TWR) for this pattern stands at 1.88. TradeWave Ratio (TWR) reflects how far price typically travels in the trade direction within the window regardless of the final close. Combined with a Sharpe ratio of 0.89 based on end-of-window outcomes, the profile points to a window that has historically offered respectable risk-adjusted returns for longs, but with enough volatility that position sizing and stop placement have mattered.
The per-year path data shows that in several of the stronger cycles, much of the upside tended to accrue in the middle of the window rather than in the first few sessions. Years like 2014 and 2018 saw Corn (CME) grind higher after an initial consolidation, while 2022 featured a more jagged path with both a sizable maximum favorable move of 9.68% and a maximum adverse move of 5.37% before finishing up 4.31%.
On a cumulative basis across the six midterm election years, the average path within the window slopes upward rather than sideways. Gains have not been linear, but the clustering of positive outcomes and the tendency for rallies to extend beyond the initial pop give this window a clearer bullish tilt than many other short seasonal slices in grains.
Year-by-year bars with peak rallies and worst drawdowns show how often upside has come with sizable swings in both directions.
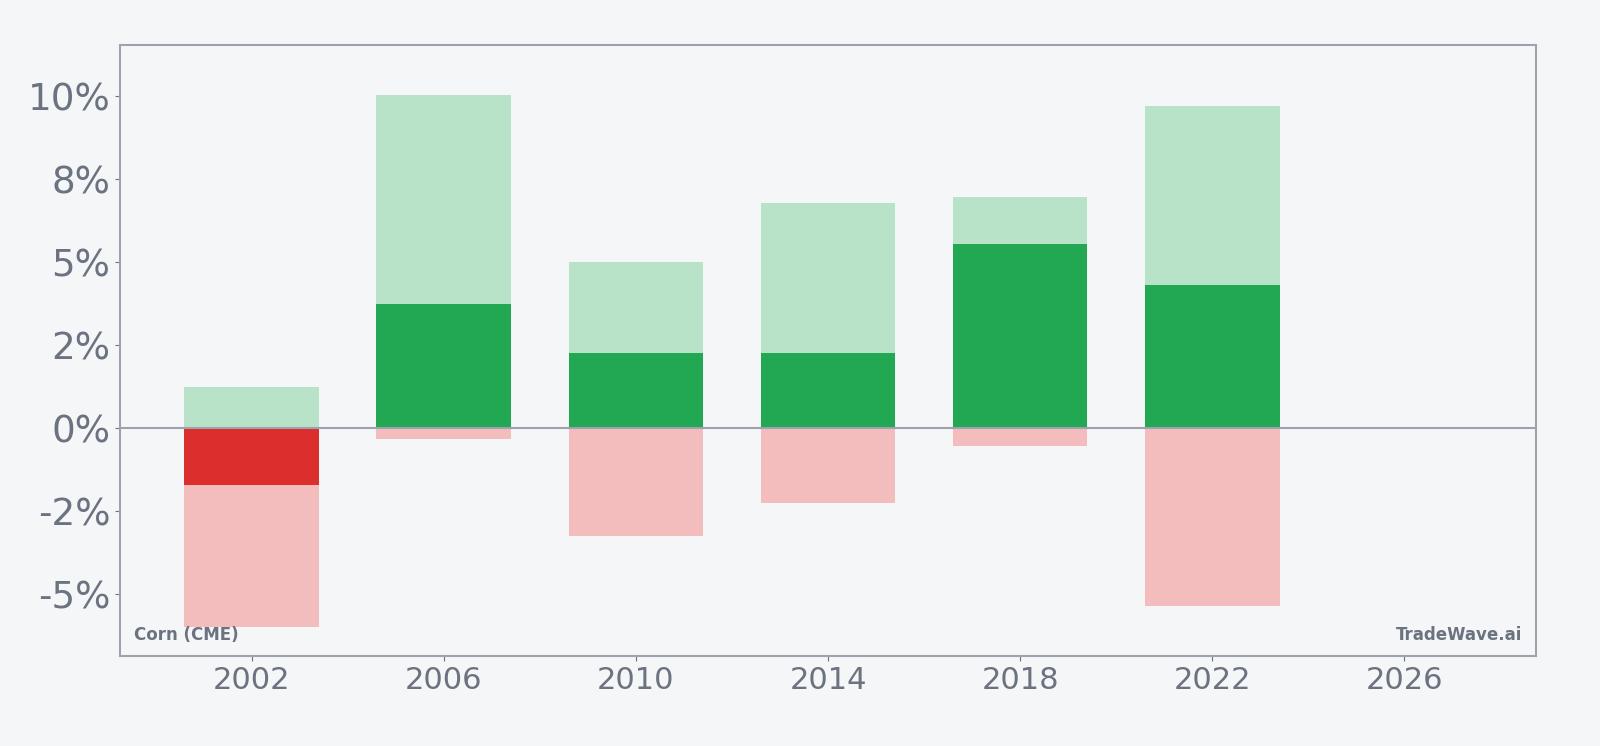
History does not guarantee future results, and even in winning years the worst intraperiod drawdown (MAE) has sometimes been large before the window closed higher.
Price and near-term drivers
Corn (CME) futures jumped 18.75 cents to 467.0 on the latest close, a 4.18% gain that leaves the contract roughly 26.8% above its 52-week low of 368.75 and about 4.8% below the 52-week high of 490.75. Volume of 167,732 contracts came in below the 20-day average of 201,124, suggesting the move was driven more by price repricing than by a surge in participation, while the front contract also sits comfortably above its 50-day simple moving average of 434.27, reinforcing the recent upswing in trend.
The current backdrop still reflects the supply-heavy tone that followed higher U.S. crop-supply estimates and larger ending stocks, which earlier pushed grain futures lower as traders digested a more comfortable balance sheet.[1] At the same time, global demand has been supported by strong U.S. export prospects for the 2024–25 marketing year, even as trade flows have shifted away from China and toward other buyers.[1] That mix of ample supply and firm demand has kept corn pinned in a broad range, with weather, acreage intentions and policy headlines likely to dictate whether the latest rally has room to extend into the approaching seasonal window.
The chart below situates the latest move in its recent multi-month context.
What to watch as the window opens
With Corn (CME) already trading near the top of its one-year range, the key question for traders is how price behaves as the Mar 25 window begins. Historically, this midterm-year spring stretch has rewarded patience on the long side, but several years have seen meaningful drawdowns before the pattern played out, so early weakness would not automatically contradict the seasonal script.
On the fundamental side, upcoming USDA updates on planting intentions and any revisions to ending stocks will be critical for confirming whether the market can sustain a constructive bias into late spring.[1] Watch how futures react to any surprise on acreage or yield: a muted response would suggest the seasonal tailwind is doing some of the heavy lifting, while a sharp break against the historical pattern would signal that fresh information is overwhelming the calendar effect.
Price levels also matter. Holding above the 50-day moving average and defending the 440 to 450 zone during any pullbacks would keep the recent uptrend intact as the window progresses. A decisive push through the 490.75 area that marks the 52-week high would show that this cycle is tracking with the stronger historical years, where rallies extended beyond the initial burst and delivered sizable maximum favorable moves before the window closed.
Finally, monitor intraday volatility and depth of any selloffs inside the window. In prior midterm years, some of the best-performing windows still featured sharp adverse excursions before recovering, so a single downdraft does not automatically negate the pattern. What would contradict the historical playbook is a sustained break that leaves the contract unable to reclaim lost ground over the 47 days, turning this iteration into another outlier like 2002 rather than a typical midterm spring for corn.