Near 52-Week Highs, Chicago SRW Wheat (CME) (ZW) Enters a Bearish 20-Day Midterm Stretch
Chicago SRW Wheat (CME) is stepping into a midterm-election-year stretch that has often rewarded shorts, just as prices trade near the upper end of the past year’s range.

Key takeaways
- Chicago SRW Wheat (CME) is entering a 20-day window tied to the last 7 midterm election years, where the historical trade direction has been short.
- The pattern has been profitable for shorts in 5 of 7 years, or 71%, with 5 winners and 2 losers across the sample.
- Winning years have seen average gains for the short side of 6.72%, while including all years brings the average outcome to 5%.
- Intraperiod swings have been meaningful, with several years showing adverse moves against the short before the trade ultimately worked.
- With ZW recently trading near its 52-week high and up 8.29% over the past month, this historically weak window arrives against a firm price backdrop.
- Traders should treat this as a volatility window rather than a one-way bet, given the mix of strong winners and a couple of sharp losing years for shorts.
According to historical data from TradeWave.ai, this specific midterm-year slice of the calendar has behaved differently from an average month for Chicago SRW Wheat (CME), and the next 20 trading days sit at the center of that pattern.
Seasonal window
Chicago SRW Wheat (CME) is entering a 20-day midterm-election-year window that has historically favored short positions, with 5 winning short years out of 7 and an average outcome of 5% in the trade direction. The contract is coming into this stretch after a strong one-month rally of 8.29% and with last trade levels not far below a 52-week high of 641.75, leaving bulls little margin for error if the usual midterm-year pattern reasserts itself.
Grouping the data by the presidential election cycle matters here because midterm years often bring policy uncertainty around farm support, trade rules and biofuel mandates, which can distort grain pricing in ways that do not show up in simple calendar averages. This pattern isolates the last seven midterm election years and looks only at how ZW behaved in the 20 trading days starting on Mar 15 in those years.
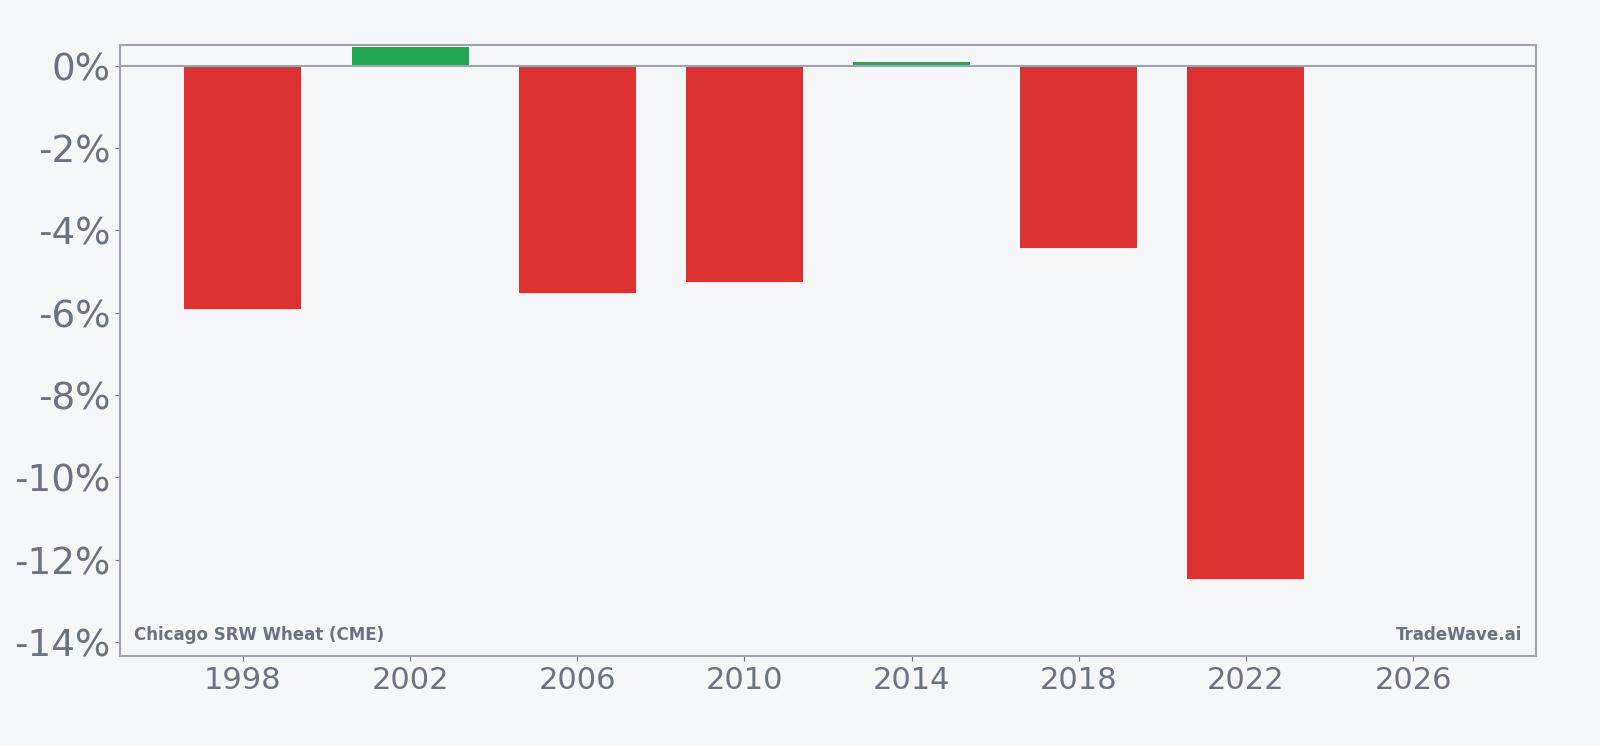
Across that sample, the trade direction is explicitly short. In five of the seven midterm years, a short position entered on the pattern start date and held for 20 trading days finished profitable, while two years produced losses for shorts. The average gain in the winning short years was 6.72%, but when the two losing years are included, the all-years average outcome still comes in at 5% in favor of the short side.
The per-year breakdown shows how that plays out in practice. In 1998, a short entered around 330.75 and exited 20 days later near 311.25, a net move of about 5.9% in favor of the short, even though the contract briefly moved 1.44% against the position at one point during the window. In 2022, the pattern delivered its strongest short result, with an entry near 1154.25 and an exit around 1010.25, a 12.48% gain for the short after a maximum favorable move of 1.3% and a worst intraperiod drawdown of 15.79% from the entry level.
Not every year has been that clean for shorts. In 2002 and 2014, the net returns were essentially flat to slightly positive for the short, with 0.44% and 0.09% gains respectively, even though both years saw sizable intraperiod rallies against the short before prices rolled over. Those years underline the point that this window has often involved two-way trade, with wheat sometimes squeezing higher before the seasonal weakness shows up.
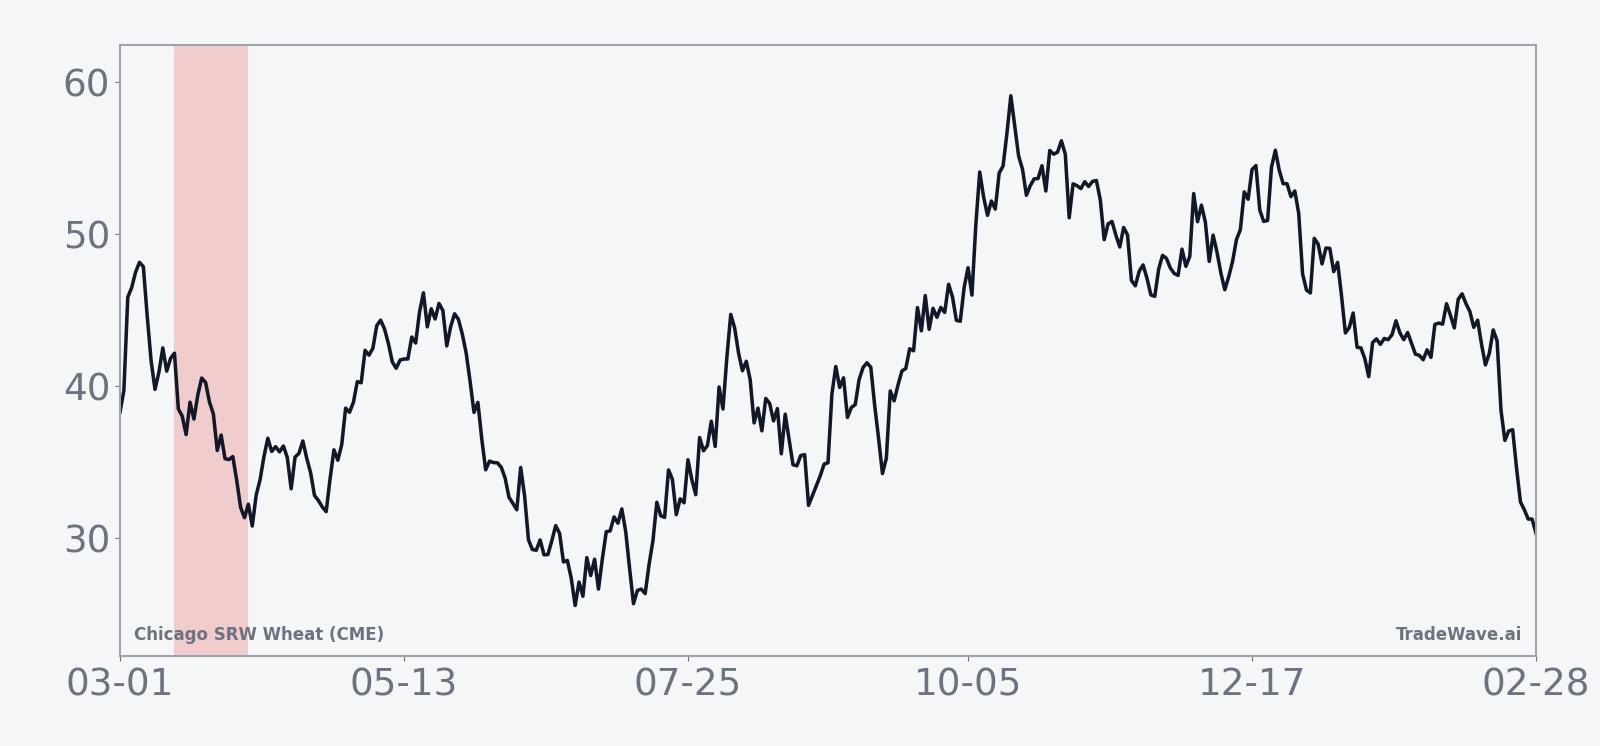
The historical seasonal trend chart for this window shows a tendency for ZW to drift lower across the 20-day span in midterm years, with much of the net move accruing in the back half of the window rather than in a single sharp break. That fits with the idea of a market that tests the highs early in the period, then fades as planting progress, weather updates and policy chatter start to bite.
A stacked view of net returns alongside peak favorable and worst adverse moves shows how far ZW has tended to swing inside this window.
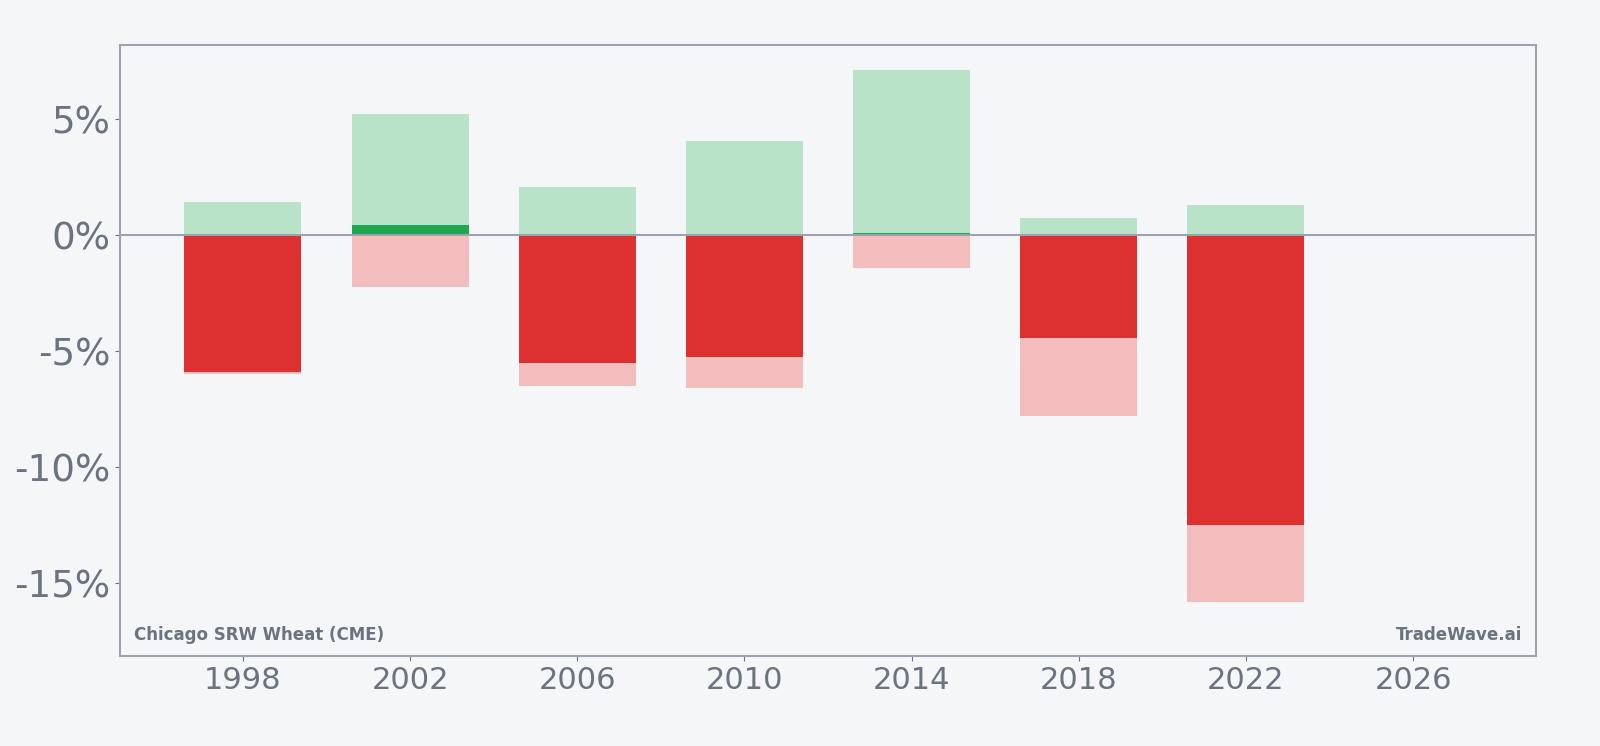
The stacked net, peak favorable and worst adverse bars underline that this is a high-variance stretch rather than a gentle glide lower. Several years show sizeable maximum adverse moves against the short before the trade ultimately worked, while the strongest short years combined deep maximum favorable excursions with still meaningful drawdowns along the way. Add it up and the pattern is clear: this window has leaned bearish for ZW in midterm years, but traders have had to sit through real noise to capture it.
History does not guarantee future results; adverse excursions can be large even in winning windows, and traders should size risk accordingly.
Price and near-term drivers
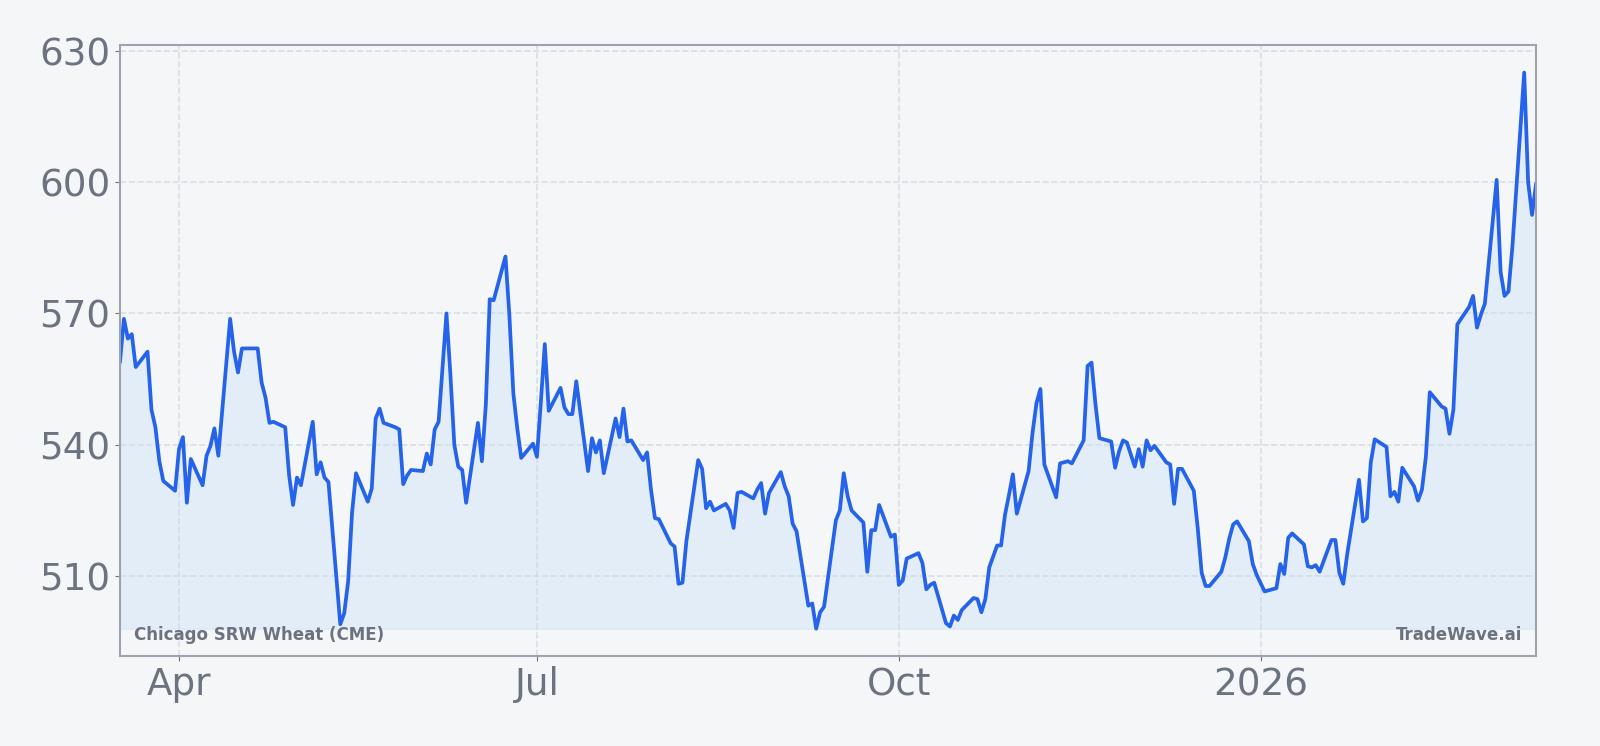
Chicago SRW Wheat (CME) comes into this seasonal window after a firm run, with the contract up 8.29% over the past month and trading between a 52-week low of 492.25 and a high of 641.75 on 20-day average volume of about 79,606 contracts. The 50-day simple moving average sits near 543.93, which means current prices are comfortably above the medium-term trend line and leave room for a pullback without breaking the broader uptrend.
That backdrop matters because this contract is a key benchmark for global wheat pricing and a reference point for everything from food inflation to farm margins. When ZW is strong into spring, it often reflects a mix of weather risk, export demand and positioning by funds that use the contract as a liquid proxy for grain exposure. A seasonal window that has historically leaned bearish for prices, and bullish for shorts, arriving just as the market trades near the top of its one-year range is the kind of setup that tends to sharpen risk management on both sides of the book.
The chart below situates the latest move in its recent multi-month context.
What to watch in this window
For the next 20 trading days, the key question is whether ZW behaves like a typical midterm-year spring or breaks the pattern. Traders will be watching how price reacts around the 50-day moving average near 543.93 and the recent highs just below 641.75. A quick rejection from the upper band followed by a grind lower would rhyme with prior midterm-year iterations of this window, while a clean breakout and hold above the 52-week high would look more like one of the rare losing years for shorts.
Fundamentals will still drive the tape day to day, but the seasonal backdrop suggests that negative surprises on weather, export demand or policy could have extra bite in this stretch. If intraday swings start to widen and the contract posts deeper drawdowns from intraperiod highs, that would be consistent with the historical pattern of sizable maximum adverse and favorable excursions inside the window. On the other hand, a tight, low-volatility consolidation near the highs would be a clear departure from how this period has traded in the last seven midterm election years.
For hedgers and speculators alike, the takeaway is simple. This is a window where Chicago SRW Wheat (CME) has often moved sharply and ultimately rewarded short exposure, but it has rarely done so in a straight line. How price behaves around the current upper range, and whether any early squeezes fade or stick, will tell traders quickly whether 2026 is lining up as another textbook midterm-year spring or an exception to the rule.