Near-$3 Natural Gas (CME) (NG) Eyes 12-Day Midterm Spring Window With a Perfect Winning Streak
Natural Gas (CME) is hovering near $3 as it approaches a 12-day midterm-election spring window that has delivered gains in every cycle over the past three decades.
Seasonal window
Natural Gas (CME) has posted gains in all 8 midterm-election spring windows that start around Mar 22 and run for 12 trading days, averaging a 5.67% rise. The front-month NG contract settled Friday at $3.096, sitting in the lower half of its recent range after a flat session and well below last year’s spike above $7.80.[2] That combination of a clean bullish seasonal record and a subdued price zone gives this year’s window unusual focus for traders trying to gauge whether winter’s volatility is truly behind the market.
Election-cycle backdrop: early in the midterm year
The current calendar sits in the early part of the midterm election year, a phase that often brings shifting expectations around energy policy, regulation and fiscal support. For natural gas, that can translate into changing assumptions about LNG export approvals, pipeline infrastructure and power-sector fuel mix, even before any laws actually change.[2]
The seasonal pattern discussed here is built specifically on the last 8 midterm election years, not on a simple run of consecutive calendar years. That means each data point reflects how NG behaved in this same late-March slice of the midterm year, across cycles stretching back to the 1990s, when policy debates and macro conditions looked very different from today but the election calendar was in the same phase.
This year, the market is also looking ahead to the transition from the midterm year into the year before the presidential election, a phase that has historically leaned more risk-on across many assets as policy uncertainty clears and fiscal levers are often more supportive. For a cyclical commodity like natural gas, that shift can matter for industrial demand expectations and for how aggressively producers hedge forward output.
Key takeaways
- Natural Gas (CME) has risen in 8 of 8 midterm-election spring windows starting around Mar 22, with no losing years in the sample.
- The window runs 12 trading days from Mar 22, with average gains of 5.67% across those prior cycles.
- Trade Direction is long, with a TradeWave Ratio of 2.19 and a Sharpe ratio of 1.51, pointing to historically favorable risk-adjusted upside.
- Individual years have seen maximum favorable moves as high as 13.41% and adverse drawdowns as deep as 7.93% inside the window, underscoring real volatility.
- NG is trading near $3 after a winter of weather-driven spikes and reversals, leaving room for the seasonal pattern to matter if demand or policy headlines surprise.[2][6]
According to historical data from TradeWave.ai, this late-March stretch in midterm years has behaved very differently from an average month on the natural-gas calendar. The next 12-day iteration of that pattern begins on Mar 22, putting a quant lens on what is usually a weather-and-policy story.
Grouping the data by the presidential election cycle matters here because midterm years often feature contentious policy debates and shifting expectations for regulation and infrastructure, which can amplify moves in benchmark energy contracts. In natural gas, those debates intersect with weather, storage and export flows, creating a backdrop where a repeatable calendar pattern is not obvious until you line up the cycles.
Natural Gas (CME) has risen in 8 of 8 midterm-election years during this 12-day window, with an average gain of 5.67%. The upcoming window begins on Mar 22 and runs through early April, and the trade direction in the historical pattern is long. Every prior instance in the sample finished higher than it started, so there are 8 winners and 0 losers in the record.
Average profit of 5.67% reflects the mean gain across those winning years, while the cumulative return of 54% shows what a hypothetical strategy would have earned by repeating the same 12-day exposure across all eight midterm cycles. The median gain of 4.52% sits slightly below the average, which hints that a few strong years, such as 2022’s 10.83% rise, pulled the mean higher.
The intraperiod behavior has been anything but smooth. In the strongest year, 2022, NG rallied as much as 13.41% from entry at one point during the window before finishing up 10.83%. In the choppier 1994 sample, the contract still ended higher by 1.76%, but not before a maximum adverse move of 7.93% against the long side, a reminder that even “all green” windows can feel uncomfortable in real time.
Across the full sample, the TradeWave Ratio (TWR) stands at 2.19. TradeWave Ratio (TWR) reflects how far price typically travels in the trade direction within the window regardless of the final close. A Sharpe ratio of 1.51, based on end-of-window outcomes, points to historically favorable risk-adjusted returns for this specific slice of the calendar compared with more random behavior.
The per-year table shows that the weakest outcome in net terms was 1994’s 1.76% gain, while the strongest was 2022’s 10.83% rise. Several mid-cycle years, including 1998, 2002 and 2010, clustered in the mid-single-digit range, suggesting that while big spikes are possible, the more typical pattern has been a steady grind higher rather than a one-way melt-up.
A second view combines net results with the best and worst intraperiod swings to show how far NG has tended to travel inside the window.
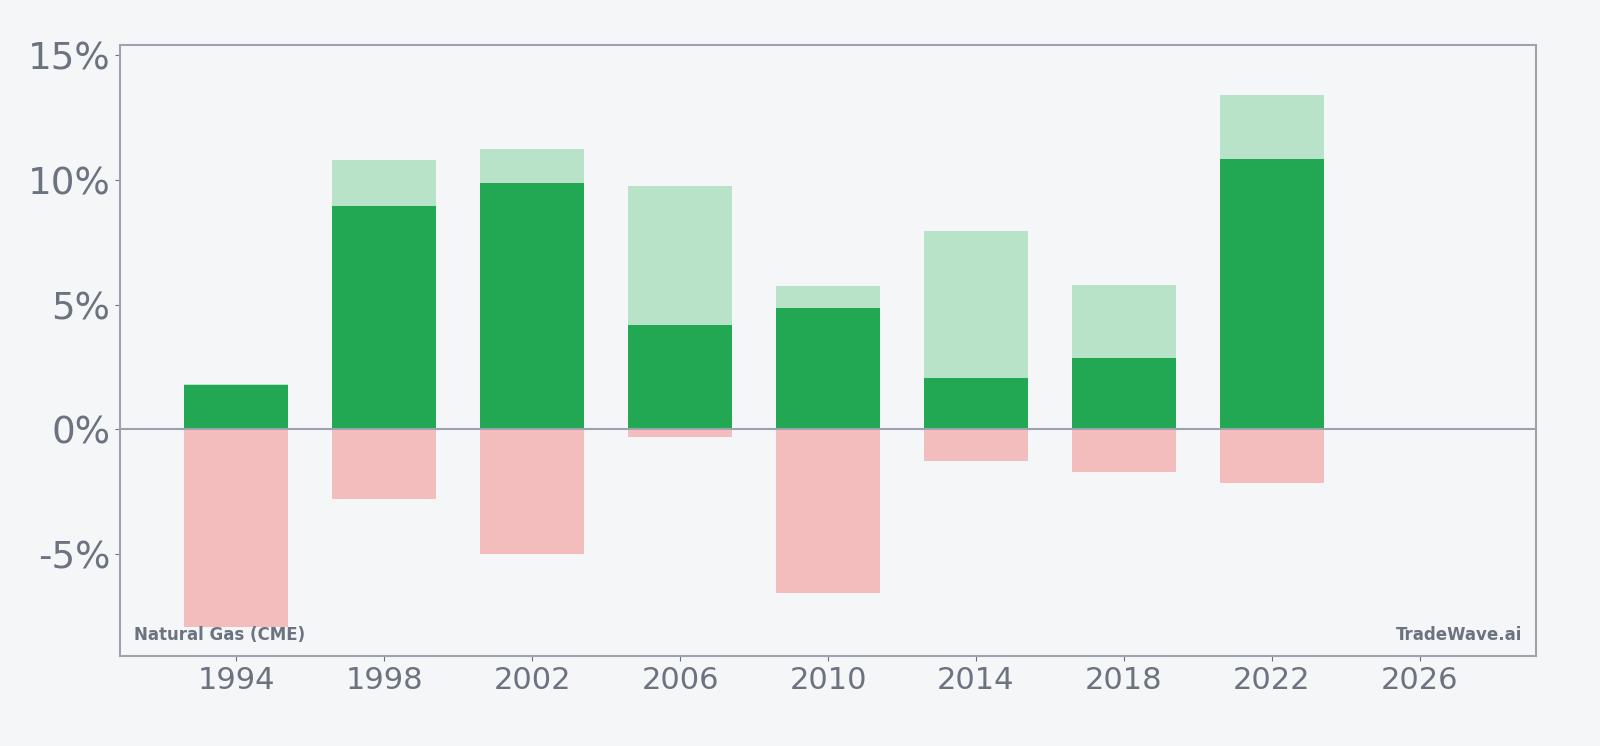
The stacked net, best-case and worst-case bars show a consistent pattern of positive finishes paired with meaningful swings along the way. Maximum favorable excursions often ran into the high single digits or low double digits, while maximum adverse excursions in several years pushed beyond 5% against the trade before recovering. That mix points to a window where upside has historically dominated by the close, but where intraday and intrawindow volatility has been significant.
History does not guarantee future results, and adverse excursions can be large even in winning windows, so position sizing and risk controls remain critical.
The headline takeaway is simple: eight for eight. In every midterm-election year in this sample, being long NG during this late-March window has finished in the green, with several years delivering outsized gains and all of them featuring enough volatility to test conviction along the way.
Price and near-term drivers
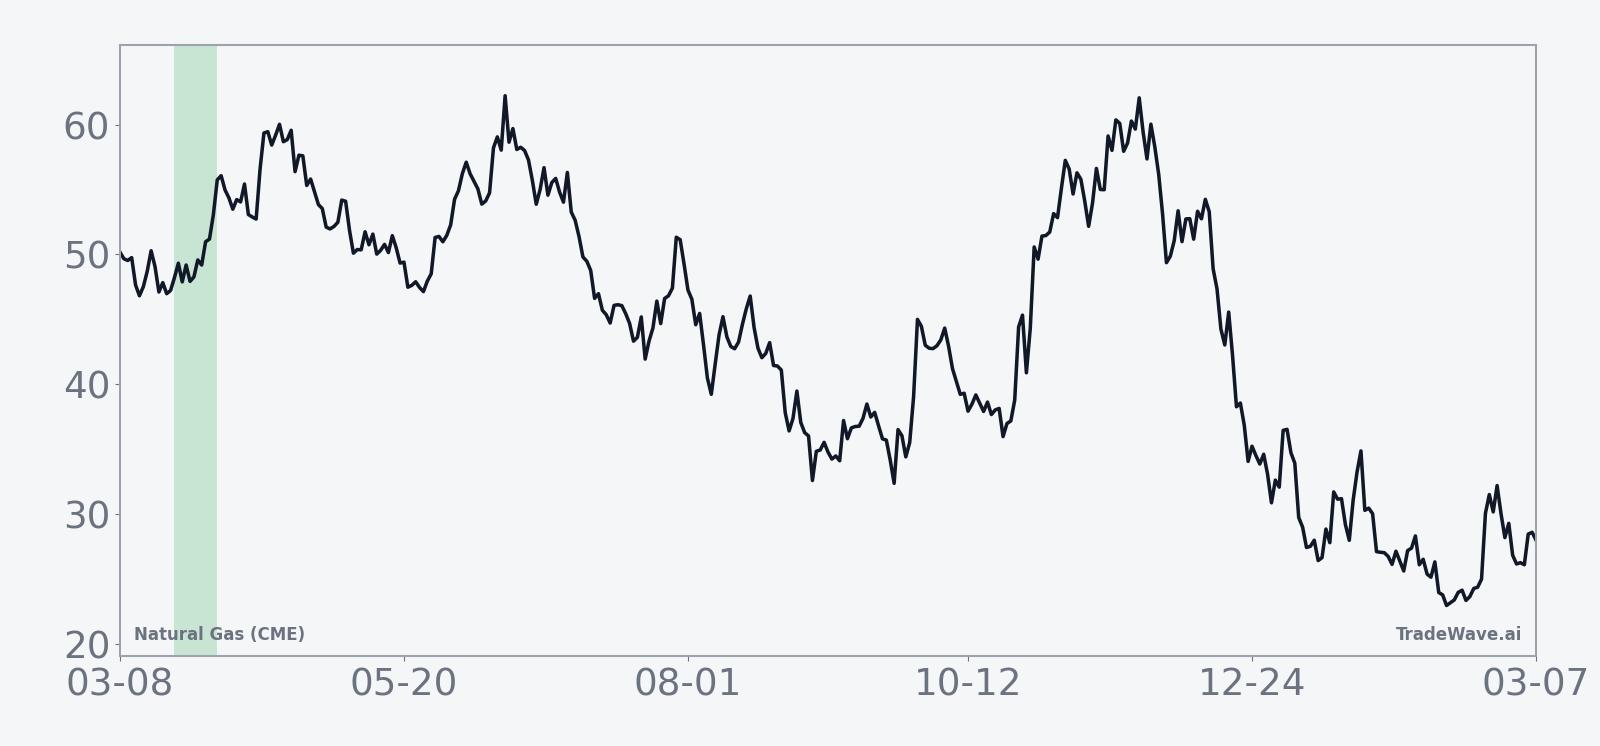
Front-month Natural Gas (CME) futures closed Friday unchanged at $3.096, leaving the contract modestly above its 52-week low of $2.622 and far below last year’s $7.827 high as the market digests a volatile winter heating season.[2] The flat close masks a choppy intraday range between $3.045 and $3.169 on volume just over 101,000 contracts, below the 20-day average of about 129,900, as traders weighed lingering cold in parts of the U.S. against shoulder-season demand expectations.
In January, a burst of bitter cold in the Northeastern U.S. sent natural-gas prices sharply higher as heating demand spiked, delivering one of the winter’s most dramatic rallies.[2] By late February, futures had slipped back in choppy trade as forecasts turned more mixed, with cold snaps still boosting short-term consumption but warmer outlooks capping follow-through on the upside.[6] That push-and-pull has left NG in a kind of truce zone near $3, where neither bulls nor bears have been able to press a sustained trend.
Storage dynamics remain a key swing factor. In late 2025, U.S. natural-gas futures repeatedly reacted to weekly inventory data, with prices firming ahead of expected above-average withdrawals and easing when milder weather cut into heating demand.[3][4][7][8] The latest commentary points to ongoing inventory reductions and a narrowing storage surplus, which can tighten the market into the cooling season if early-summer heat arrives on schedule.[3][8]
Weather is still the dominant macro driver. Reports over the past year have shown how quickly NG can jump on hotter or colder-than-expected forecasts, whether it is mid-July heat boosting power-sector cooling demand or early-December cold lifting expectations for storage draws.[1][3] As the market heads into this late-March window, traders are watching both short-range temperature models and the evolving outlook for summer heat, which will determine how aggressively power generators lean on gas versus alternatives.
Sector-wide, energy demand trends remain constructive, with higher overall consumption and pricing supporting the broader natural-gas complex.[3] At the same time, the contract’s current level below its 50-day moving average of roughly $3.59 hints at a market that has cooled from winter extremes but has not yet found a new equilibrium. That tension between a historically strong seasonal window and a market still digesting winter’s swings is what makes this year’s setup stand out.
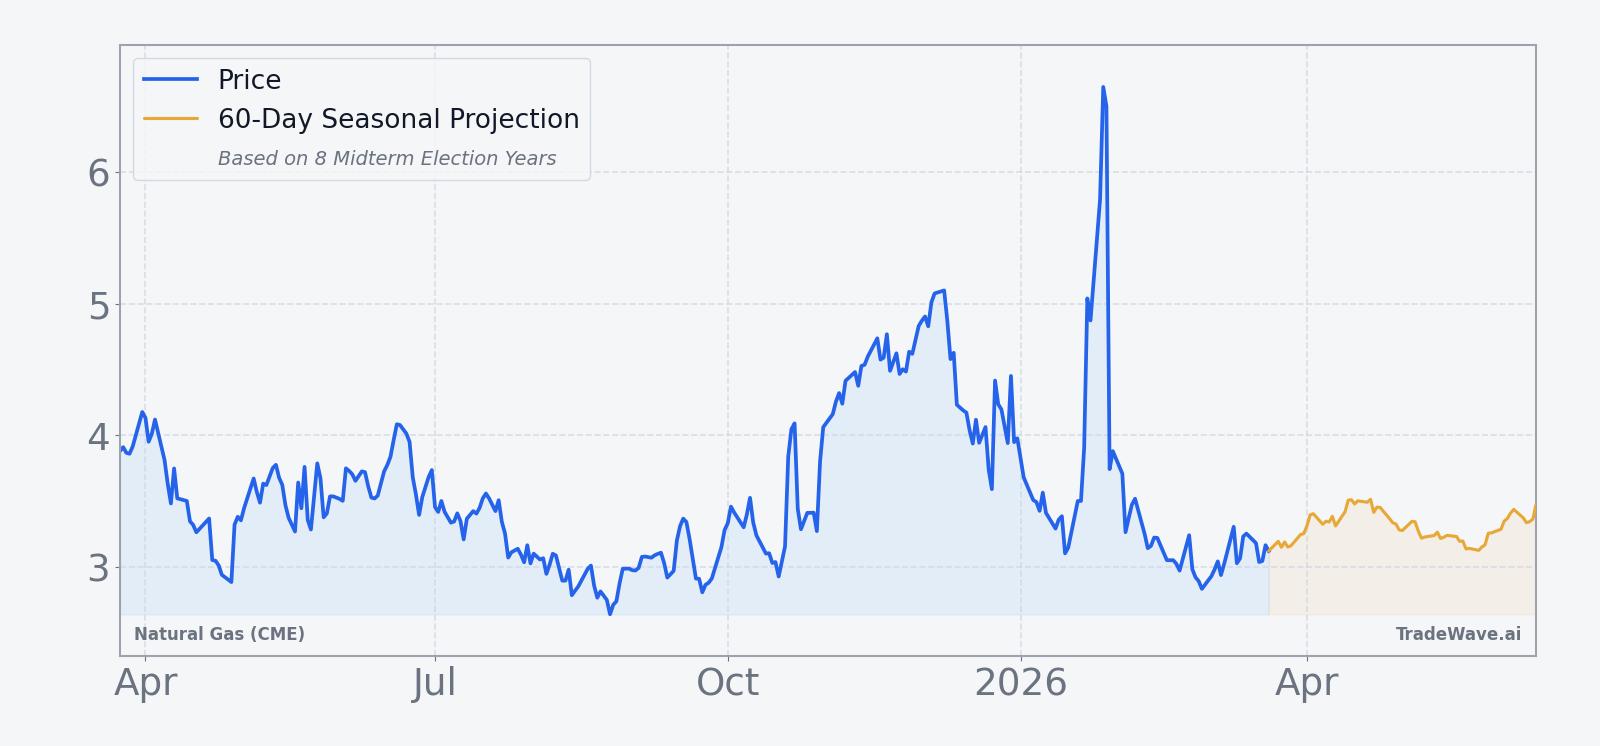
The chart below situates the latest move in its recent multi-month context and overlays a 60-day seasonal projection for perspective.
What to watch as the window opens
As the 12-day midterm-year spring window kicks off on Mar 22, the first thing to watch is how NG behaves around the $3 mark. A firm bid that holds pullbacks above recent lows would be more consistent with the historical pattern of positive net returns, while a quick break lower with expanding volume would signal that this cycle may be diverging from the past.
Second, keep an eye on weekly U.S. storage reports and the associated weather commentary. Larger-than-expected withdrawals or early signs of tightening into the cooling season have previously coincided with stronger NG performance around this time of year, while surprise builds or persistently mild forecasts have tended to blunt rallies.[3][4][7][8]
Third, monitor short-range and seasonal temperature forecasts for both the Northeast and key power-demand regions. Episodes of extreme cold or early heat have repeatedly triggered sharp, if sometimes short-lived, price spikes in natural gas, and similar surprises during this window could again interact with the historical tendency toward upside moves.[1][2][6]
Finally, watch how policy headlines around energy infrastructure, LNG exports and environmental regulation evolve as the midterm year progresses. While those stories rarely move NG on a single day, they can shape expectations for demand and supply over the coming year, influencing how traders interpret any strength or weakness that shows up during this statistically strong seasonal stretch.[2] If price action respects the historical pattern with controlled drawdowns and constructive closes, it will reinforce the idea that this late-March window remains a distinct feature of the natural-gas calendar; if it breaks sharply in the other direction, that divergence will be just as informative for how the market is repricing risk in this election cycle.
Sources
- Reuters, "US natgas prices gain over 2% on mid-July heat forecasts, more cooling demand," Jul 2, 2025.
- MarketWatch, "Natural-gas prices soar as temperatures drop. It could be the toughest test for the markets in a decade," Jan 20, 2026.
- The Wall Street Journal, "U.S. Natural Gas Picks Up Ahead of Storage Data," Dec 10, 2025.
- The Wall Street Journal, "U.S. Natural Gas Futures Extend Decline," Dec 12, 2025.
- The Wall Street Journal, "U.S. Natural Gas Futures Post Daily Gain, Weekly Loss," Dec 19, 2025.
- The Wall Street Journal, "U.S. Natural Gas Futures Slip in Choppy Trade," Feb 19, 2026.
- The Wall Street Journal, "U.S. Natural Gas Futures Gain Ahead of Delayed Storage Data," Dec 29, 2025.