Corn (CME) (ZC) Has Rallied in 5 of 6 Midterm Spring Windows as March Gains Build
Corn (CME) futures are firming into late March as a historically strong midterm-year spring window approaches, just as supply and acreage debates heat up.
Key takeaways
- Corn (CME) is approaching a 47-day midterm-year spring window starting Mar 25 that has historically favored long positions.
- Across the last 6 midterm election years, this window has produced 5 winners and 1 loser, for an 83% win rate.
- Average gain in winning years is 3.62%, while the all-years average including the lone loss is 3%.
- Past windows have seen meaningful swings, with strong rallies in some years and intraperiod drawdowns in others, underscoring two-way risk.
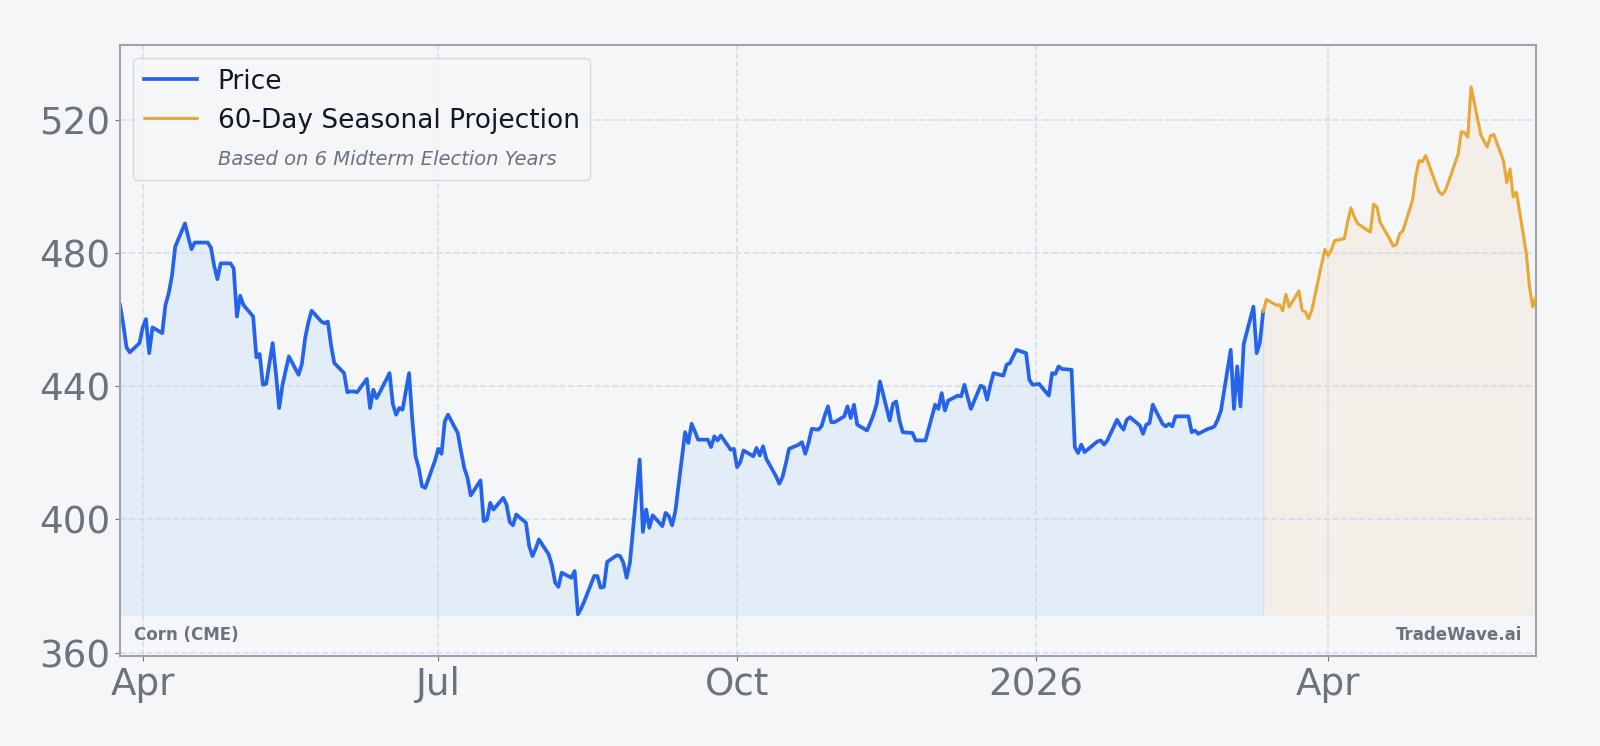
- Today’s price near 464.75 leaves corn about 5.3% below its 52-week high of 490.75, with a one-month gain of 8.07%.
- USDA supply revisions and expectations for larger planted corn acres are setting the macro backdrop as this seasonal window opens.[1]
According to historical data from TradeWave.ai, this specific late-March window in midterm election years has behaved differently from an average spring for corn, and the next iteration is only days away.
Seasonal window
Corn (CME) has risen in 5 of the last 6 midterm election years during this 47-day spring window, averaging 3.62% gains in the winning seasons. Today the front-month contract trades around 464.75, up 0.32% on the session and sitting about 5.3% below its 52-week high of 490.75, after an 8.07% climb over the past month.
Grouping the data by the presidential election cycle matters here because midterm years often bring policy uncertainty on farm support, trade and biofuel mandates, which can distort normal planting-season price behavior. This pattern isolates the last six midterm election years and looks only at how corn behaved from Mar 25 forward for 47 trading days, a stretch that typically runs through much of the U.S. planting campaign.
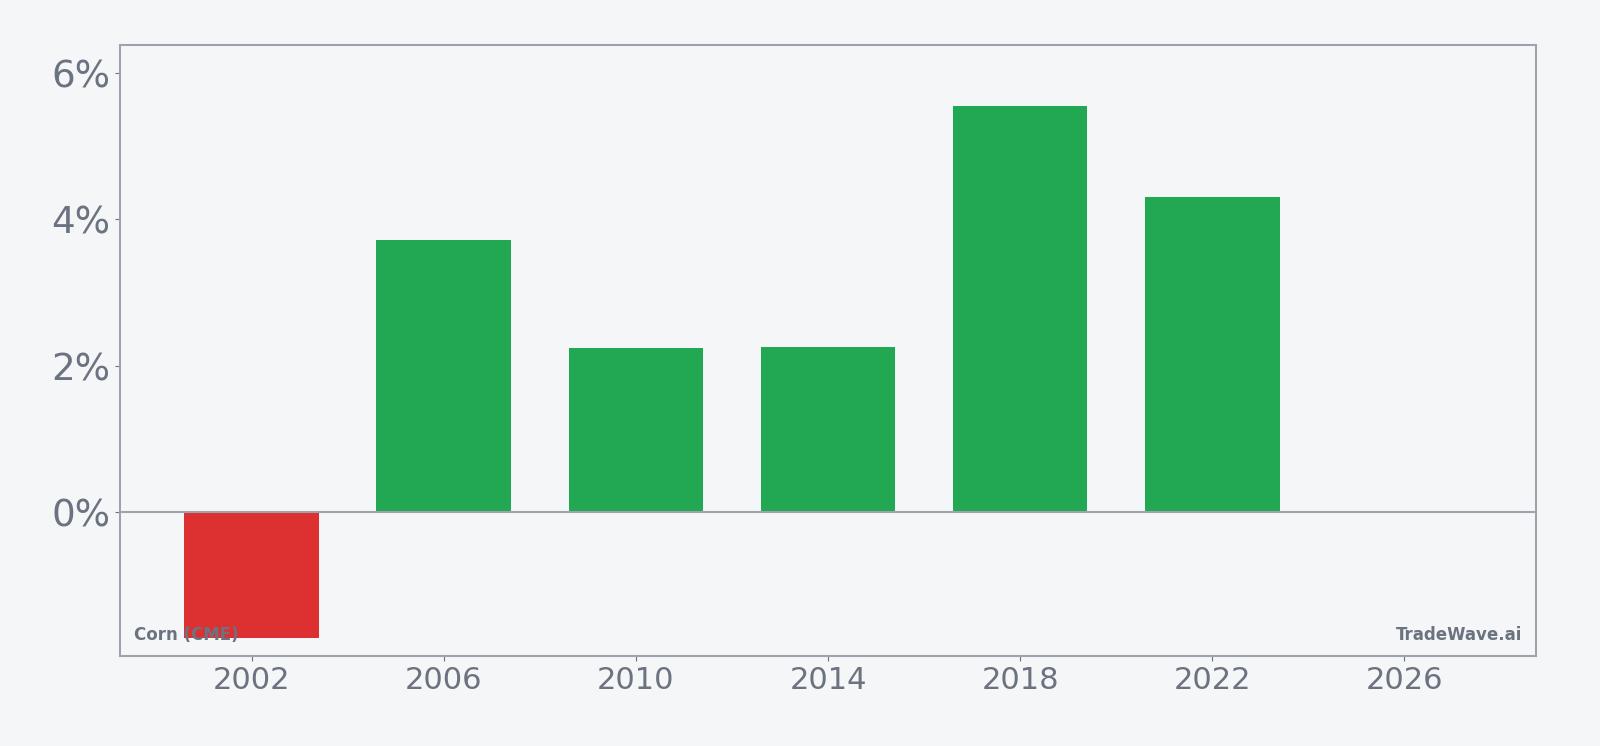
The trade direction for this pattern is long. Historically, 5 winning years against 1 losing year translate into an 83% Percent Profitable record for this window, with the single down year posting a loss of 1.71%. Average profit in the winning years is 3.62%, while Avg Profit - All, which includes every year in the sample, comes in at 3%, showing that the lone loss has not erased the positive bias.
Intraperiod swings have been meaningful. In the strongest years, the maximum favorable move, or best point-to-peak rally within the window, has reached between roughly 5% and 10%, while the maximum adverse move, or worst drawdown from entry, has ranged from about 0.3% to nearly 6%. That mix points to a window where upside has tended to dominate by the close, but traders have still had to sit through real downside noise along the way.
The per-year breakdown shows the weakest outcome in 2002, when corn slipped 1.71% over the window after suffering a worst intraperiod drawdown of 5.98% from the entry level. At the other end of the spectrum, 2018 delivered a 5.55% net gain with a maximum favorable excursion of 6.95% and only a shallow 0.53% worst drawdown, a clean trend year for longs.
On a day-by-day basis, the historical seasonal trend suggests that gains have tended to build rather than spike. The pattern’s Sharpe ratio of 0.89 indicates that, based on end-of-window outcomes, returns have been reasonably strong relative to volatility. The TradeWave Ratio (TWR) of 1.88 reflects how far price typically travels in the trade direction within the window, independent of the final close, hinting that intraperiod rallies have often extended well beyond the eventual net gain.
Cumulative returns across the six midterm-year samples add up to 17%, or about 2.7% annualized when scaled to a yearly basis. Add it up: six midterm election cycles, one losing spring, and a cluster of modest but consistent gains that have rewarded long exposure more often than not.
Yearly net and peak moves highlight how upside bursts have often come with manageable but real drawdowns.
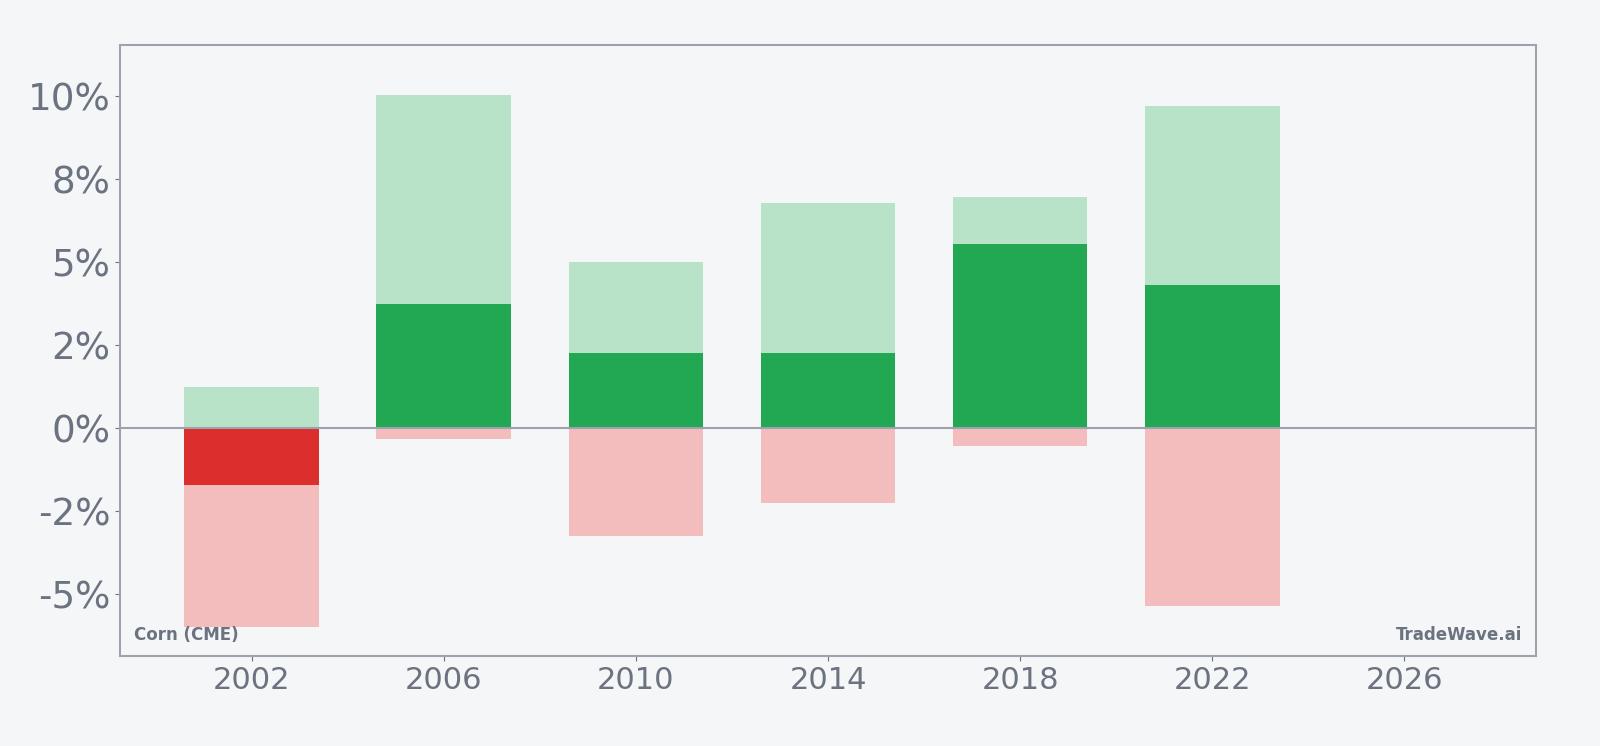
History does not guarantee future results; adverse excursions (MAE) can be large even in winning windows.
Price and near-term drivers
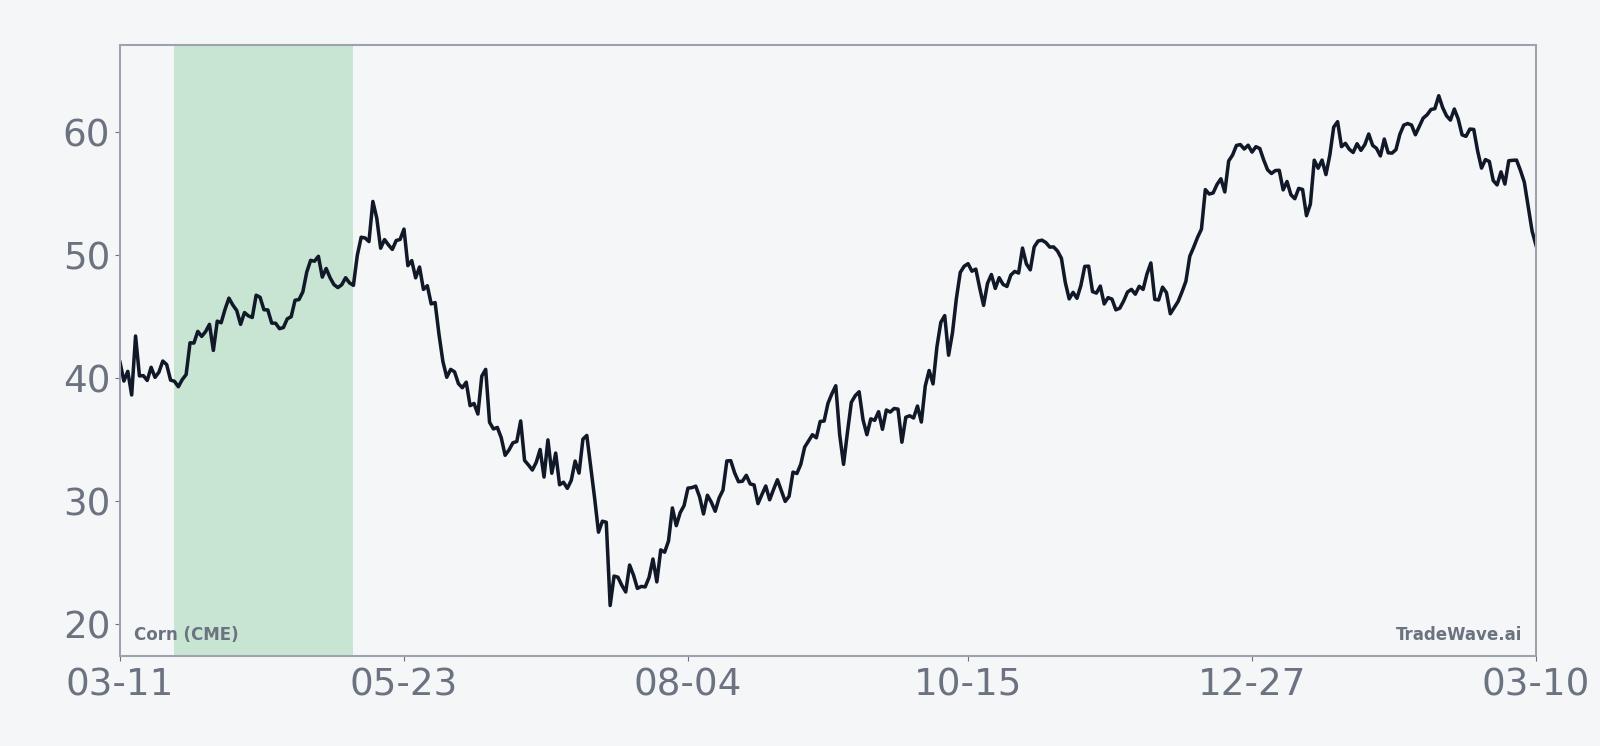
Corn futures have been grinding higher into late March. The front-month ZC contract closed at 464.75, up 1.5 points or 0.32% on the day, leaving prices about 5.3% below the 52-week high of 490.75 and well above the 52-week low of 368.75. A one-month gain of 8.07% has pulled the contract above its 50-day moving average of 434.27 on moderate volume relative to the 20-day average of 201,124 contracts.
The macro backdrop is dominated by supply. In January, the USDA projected corn ending stocks at 2.23 billion bushels, higher than previous estimates and a key driver of earlier price weakness as traders digested the prospect of more comfortable inventories.[1] At the same time, U.S. farmers are signaling plans to lean into corn acres this season, viewing the crop as their best shot at breaking even despite broader stress across agriculture.[1] That combination of heavier stocks and robust planting intentions has kept a lid on rallies even as the broader commodity complex has shown signs of life.
Positioning reflects that tension. Analysts tracking farmer behavior note that corn’s break-even math looks more attractive than some alternatives, which encourages acreage but also raises the risk of another heavy harvest if weather cooperates.[1] For futures traders, that means the upcoming seasonal window will open against a backdrop of ample supply on paper, but with weather, export demand and policy still capable of tightening the balance sheet quickly.
The chart below situates the latest move in its recent multi-month context.
What to watch as the window opens
The next 47 trading days will test whether corn’s midterm-year spring pattern can repeat against a backdrop of comfortable stocks and aggressive planting plans. Historically, this window has leaned bullish for longs, but the path has not been smooth, with several years showing meaningful intraperiod drawdowns before finishing higher.
First, watch how futures behave around the Mar 25 start date relative to key technical levels. Holding above the 50-day moving average near 434 and pushing toward the 52-week high around 490.75 would be consistent with prior winning windows. A quick break back into the low 400s, especially on rising volume, would signal that supply concerns are overwhelming the usual seasonal tailwind.
Second, monitor the USDA’s next updates on acreage and ending stocks, along with early planting progress reports. Any sign that intended corn acres are trimmed, or that weather is threatening yield potential, could tighten the balance sheet and amplify the historical upside bias of this window.[1] Conversely, confirmation of large acres and benign weather would make it harder for the seasonal pattern to deliver more than modest gains.
Finally, pay attention to how intraday ranges evolve once the window is underway. In past cycles, some of the best years combined steady closes with sharp intraperiod rallies and only shallow drawdowns, while the lone losing year saw a deep early selloff that never fully recovered. If volatility expands but pullbacks remain contained, that would echo the stronger historical samples. A fast, deep drawdown that fails to attract buying would look more like 2002’s outlier.
For traders, the message is straightforward: corn is heading into a midterm-year spring stretch that has usually rewarded long exposure, but the same history shows that those gains have come with real two-way risk. How price reacts to the coming run of acreage, weather and policy headlines will determine whether this cycle joins the five winners or becomes the second loss in an otherwise strong seasonal record.