Weather-Driven Demand Lifts Natural Gas (CME) (NG) as Bullish Late-April Window Nears
Natural Gas (CME) is trading under pressure but is less than a month away from a six-day late-April window that has delivered gains in nearly every year of the past decade and a half, creating a tight seasonal pocket of upside risk for bears and opportunity for bulls.
Key takeaways
- A six-day seasonal window for Natural Gas (CME) begins on Apr 23 and has historically favored long positions.
- Across the past 15 years, the window has seen gains in 93% of years, with 14 winners and just 1 loser.
- Winning years have averaged a 4.84% rise, while the all-years average, including the lone loss, is still 4%.
- Intraperiod swings have been meaningful, with several years showing sharp downside before finishing higher.
- NG trades at 2.961, only about 12.1% above its 52-week low of 2.622 and far below the 7.827 high, leaving plenty of room for volatility.
- Traders should treat this window as historically bullish but high-variance, with both strong rallies and deep drawdowns appearing in the record.
According to historical data from TradeWave.ai, this late-April stretch has behaved very differently from an average week in the gas market, and the next iteration is now just weeks away.
Seasonal window
Natural Gas (CME) has risen in 14 of the past 15 years during the six trading days starting Apr 23, averaging a 4.84% gain in winning years. Today the front-month contract sits at 2.961, down 1.3% on the session and trading about 62.2% below its 52-week high of 7.827 while hovering roughly 12.9% above the 2.622 low, a compressed zone where even a typical seasonal move would feel large.
Historically this window has been a straightforward long setup. The trade direction is long, and 93% of years have finished higher over the six-day span, with 14 winners against just 1 loser. Average gains in the up years come in at 4.84%, while including the lone down year still leaves the all-years average at 4%, a strong result for such a short holding period.
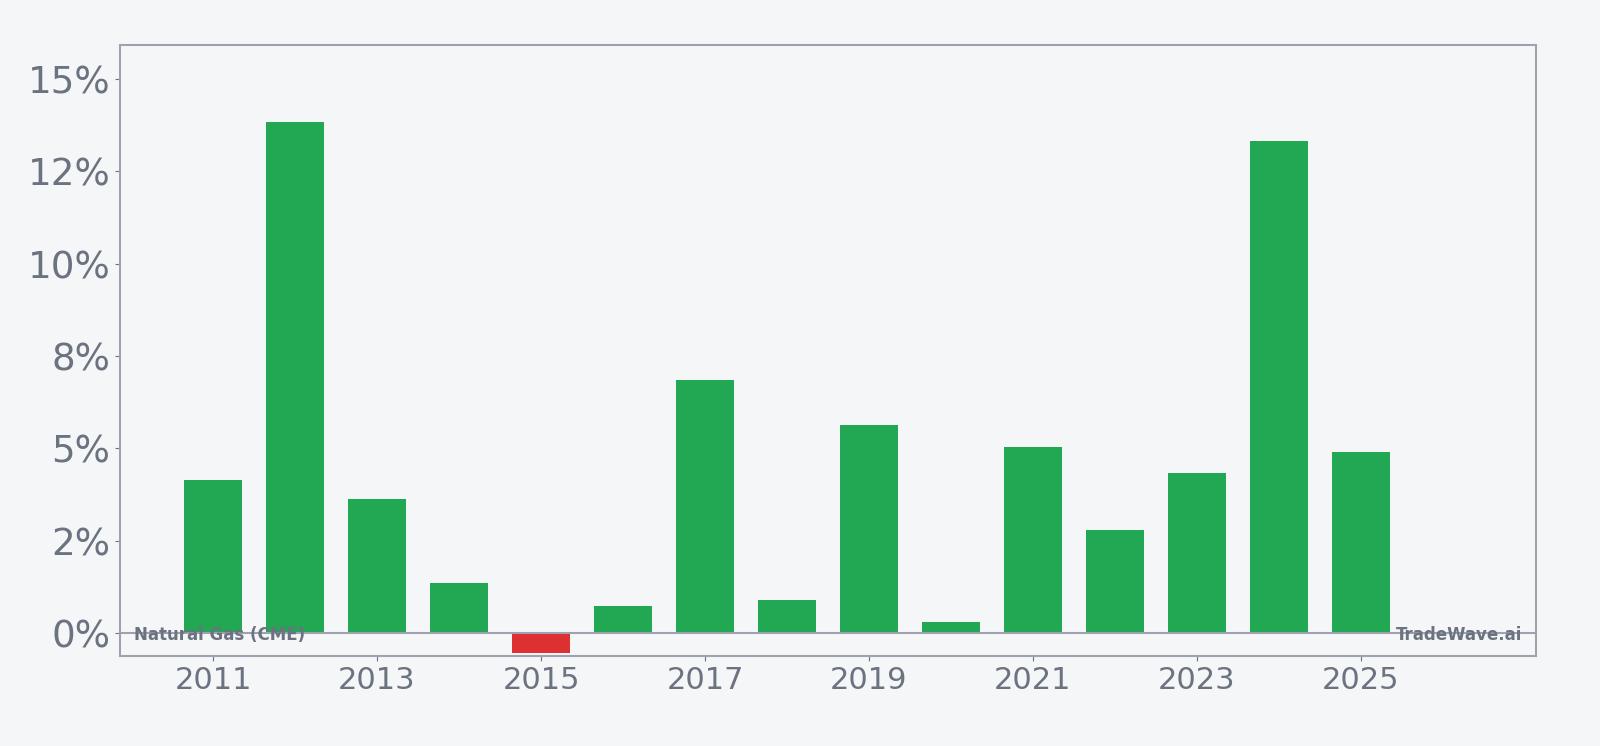
The per-year record shows how consistent that edge has been. In 2024, NG rallied 13.32% during the window, with a maximum favorable move of 14.18% and a worst intraperiod drawdown of 8.83% from entry. At the other end of the spectrum, 2016 barely moved, finishing up 0.73% after a 4.46% intraperiod high and a 5.48% dip below entry before recovering. The only losing year in the sample posted a modest decline, which is why the average loss across down years is just -0.55%.
The historical seasonal average for this window slopes higher almost from day one. The typical pattern shows early strength that either grinds or surges into the end of the six-day span, with only shallow average pullbacks along the way. That profile lines up with the long bias in the stats and the positive Sharpe ratio of 1.03, which measures risk-adjusted average return based on end-of-window outcomes.
A closer look at yearly net returns alongside peak rallies and worst drawdowns shows how much gas can move inside this short window.
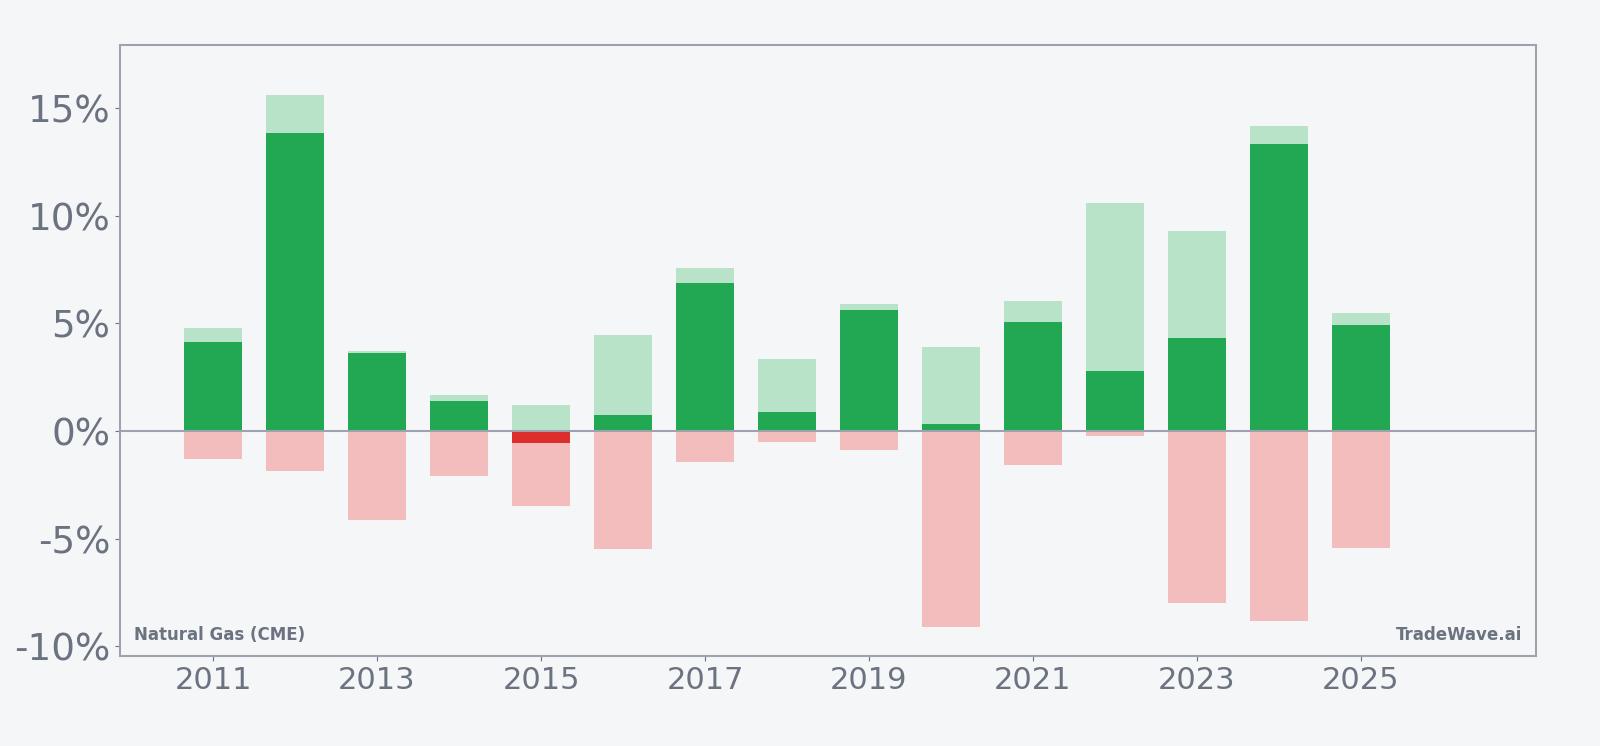
The combined net, maximum favorable excursion and maximum adverse excursion view shows why this window matters for risk management as much as opportunity. Several years, including 2022 and 2023, saw double-digit peak rallies inside the window, but they also carried intraperiod drawdowns of 7% to 9% before finishing higher. That mix of large upside potential and meaningful downside swings is captured in the TradeWave Ratio of 1.52, which tracks how far price typically travels in the trade direction within the window, and in the standard deviation of 4.28%, which signals a high-variance environment even when the final outcome is positive.
History does not guarantee future results, and adverse excursions can be large even in winning windows, so traders using this pattern still face meaningful drawdown risk.
Add it up: 14 winners, one small loser and a 90% cumulative return across the 15-sample history make this one of the cleaner short seasonal pockets on the gas calendar.
Price and near-term drivers
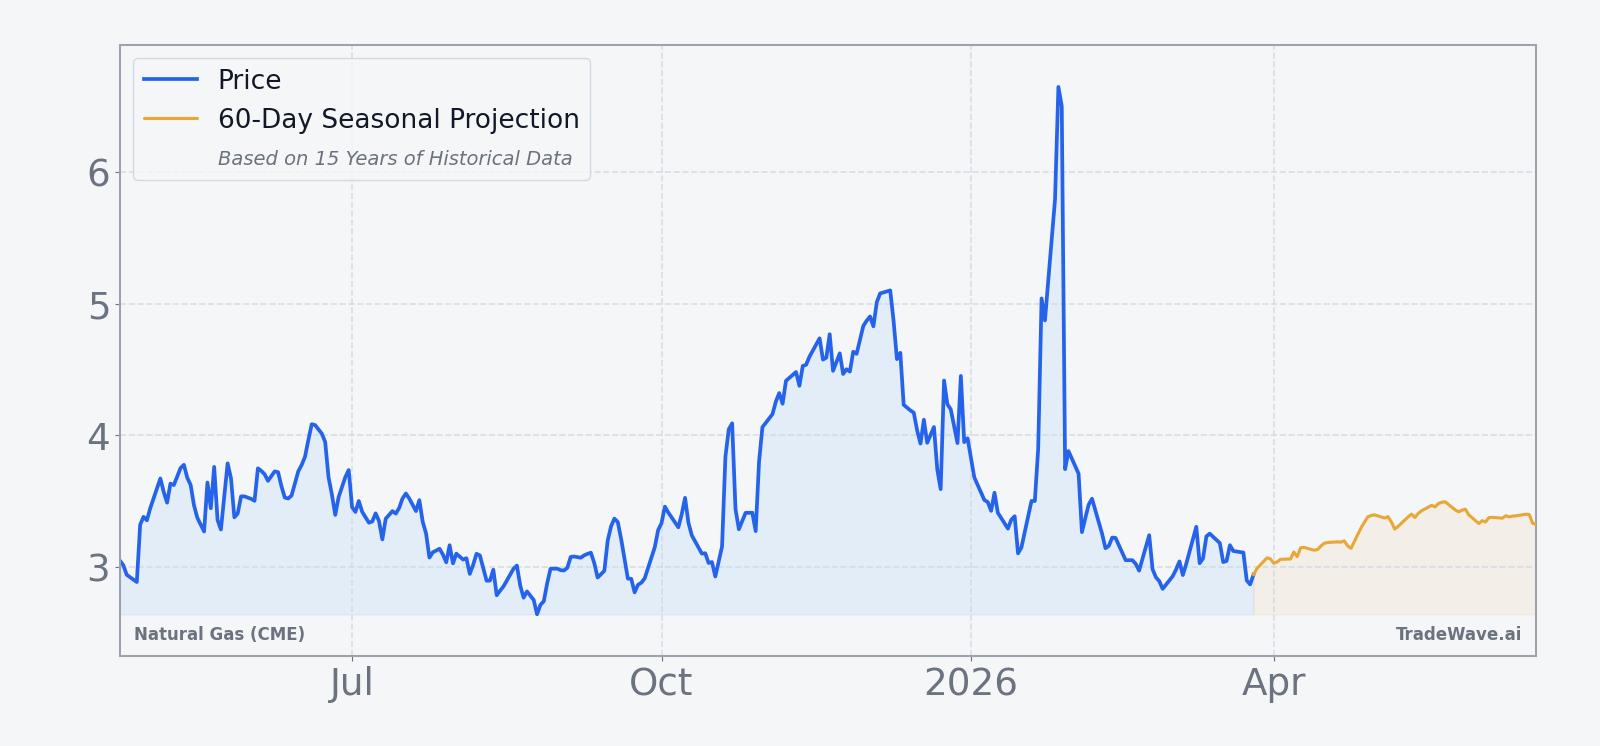
Front-month Natural Gas (CME) futures last traded at 2.961, down 0.038 on the day for a 1.3% decline, after ranging between 2.913 and 2.966 on relatively light volume of 3,207 contracts. The contract is trading well below its 50-day moving average of 3.51298 and sits about 62.2% under the 52-week high of 7.827 while only roughly 12.9% above the 2.622 low, a reminder that the market remains in a depressed price regime even after a 3.25% gain over the past month.
Weather and storage expectations remain the core macro levers for gas. In 2025, episodes of extreme cold in the Northeast drove sharp spikes as traders scrambled to reprice heating demand, while milder late-December forecasts triggered renewed selling as heating load faded.[3][5] Inventory expectations have also swung sentiment. In Dec 2025, U.S. futures firmed ahead of storage data as traders anticipated a 173 Bcf withdrawal that would cut the surplus to 107 Bcf, a shift that supported prices despite otherwise soft conditions.[2]
Those same themes are likely to frame the upcoming late-April window. By then, the market will be transitioning from heating season into the shoulder period, when cooling demand has not yet fully kicked in and storage injections begin to matter more. The historical pattern of strong late-April gains suggests that even modest surprises in weather or storage can have an outsized impact when prices are low and positioning is cautious.
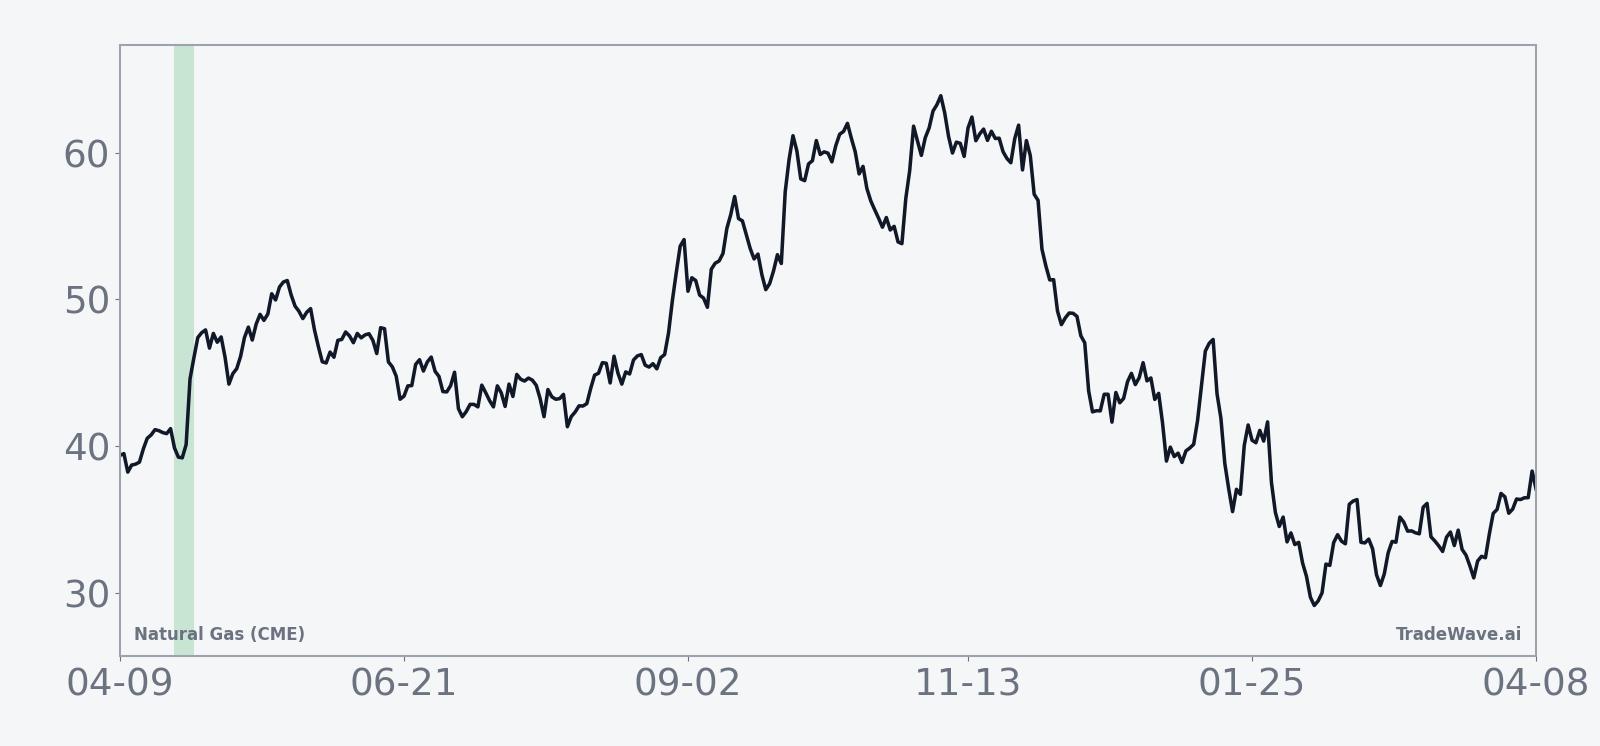
The chart below situates the latest move in its recent multi-month context and overlays the next 60 days of seasonal tendencies.
Supply, demand and inventories
On the demand side, the past year has shown how quickly weather can flip the script for gas. In Jul 2025, U.S. prices climbed more than 2% on forecasts for mid-July heat that would boost cooling demand, a reminder that power burn can tighten balances even outside winter.[1] Later in the year, a stretch of milder weather into late December weighed on futures as traders marked down heating demand and anticipated softer draws from storage.[5]
Inventory dynamics have been just as important. In Dec 2025, expectations for a 173 Bcf withdrawal that would shrink the surplus to 107 Bcf helped lift prices ahead of delayed storage data, underscoring how quickly sentiment can shift when the market senses a turn from surplus toward deficit.[2] A similar setup into late April, with injections running below expectations or early-season heat lifting power demand, could again tighten the outlook and interact with the historically bullish window.
From a logistics standpoint, the U.S. storage system and LNG export chain remain the key waypoints. When domestic inventories look comfortable, incremental supply often finds its way into export flows, pressuring Henry Hub-linked contracts. When storage looks tight, the balance flips, and domestic prices can decouple from overseas benchmarks as the system prioritizes refilling caverns ahead of the next winter. The late-April window sits near the point where that pivot typically begins.
Positioning and volatility profile
While detailed CFTC positioning data is not included here, the seasonal record itself offers a proxy for how traders have tended to behave in this window. The combination of a high win rate and sizable intraperiod drawdowns suggests that many years have started with skepticism or short covering before the market ultimately resolved higher.
Years like 2020 and 2023 illustrate that pattern. In 2020, NG finished the window barely positive at 0.31%, but the contract experienced a worst intraperiod drawdown of 9.11% from entry before clawing back. In 2023, the net gain of 4.33% came alongside a 9.27% peak rally and a 7.97% dip below entry at the worst point. Those swings imply that both longs and shorts have been forced to adjust quickly when the tape moved against them.
For risk managers, the message is straightforward. This is a short window where the historical bias is clearly bullish, but the path has often been noisy. Stops placed too tight relative to typical intraperiod downside have frequently been triggered even in years that ultimately finished higher, while traders who ignored downside risk entirely have faced double-digit drawdowns in the most volatile iterations.
What to watch as the window approaches
With NG trading near the lower end of its 52-week range and the late-April six-day window less than a month away, traders will be watching a handful of key markers. First, weekly U.S. storage reports will set the tone for how quickly the market transitions from winter draws to summer injections and whether the surplus begins to narrow as it did ahead of the Dec 2025 data.[2]
Second, weather models for late April and early May will matter. A hotter-than-normal start to the cooling season could lift power demand and tighten balances just as the historical window opens, while a mild pattern would blunt that effect and test how much of the seasonal bias is driven by positioning rather than fundamentals.[1][5]
Third, price levels themselves are important. NG is far below last year’s high and under its 50-day moving average, so any rally into the window would still leave the contract in a broader downtrend. How the market behaves if prices push back toward the 3.50 area or slip closer to the 2.62 low will signal whether traders are willing to lean into the historical pattern or fade it.
Finally, volatility inside the window will be the real tell. If the upcoming stretch again features sharp intraperiod dips followed by strong closes, it would reinforce the pattern of noisy but ultimately bullish behavior. A clean, low-volatility grind higher would mark a different tone, while a decisive break lower that fails to recover would be the kind of outlier that resets how traders think about this pocket of the calendar.
For now, the takeaway is simple. Natural Gas (CME) is cheap relative to its past year’s range, and late April has been a surprisingly reliable time for short, sharp rallies. Whether 2026 joins the 14 prior winners or becomes the second loser will depend on how storage, weather and positioning line up as the calendar flips into that six-day window.
Sources
- Reuters, "US natgas prices gain over 2% on mid-July heat forecasts, more cooling demand," Jul 2, 2025.
- The Wall Street Journal, "U.S. Natural Gas Picks Up Ahead of Storage Data," Dec 10, 2025.
- MarketWatch, "Natural-gas prices soar as temperatures drop," Jan 20, 2026.
- The Wall Street Journal, "U.S. Natural Gas Futures Gain Ahead of Delayed Storage Data," Dec 29, 2025.
- The Wall Street Journal, "U.S. Natural Gas Futures Extend Decline," Dec 12, 2025.
- The Wall Street Journal, "U.S. Natural Gas Futures Post Daily Gain, Weekly Loss," Dec 19, 2025.