Rising Volatility Puts Nasdaq QQQ Invesco ETF (QQQ) Support Levels at Risk of Deeper Slide
Nasdaq QQQ Invesco ETF is sitting below its 52-week high just as a 66-day midterm-year seasonal window that has produced declines in every prior cycle gets underway, raising the stakes for tech-heavy index traders.

Key takeaways
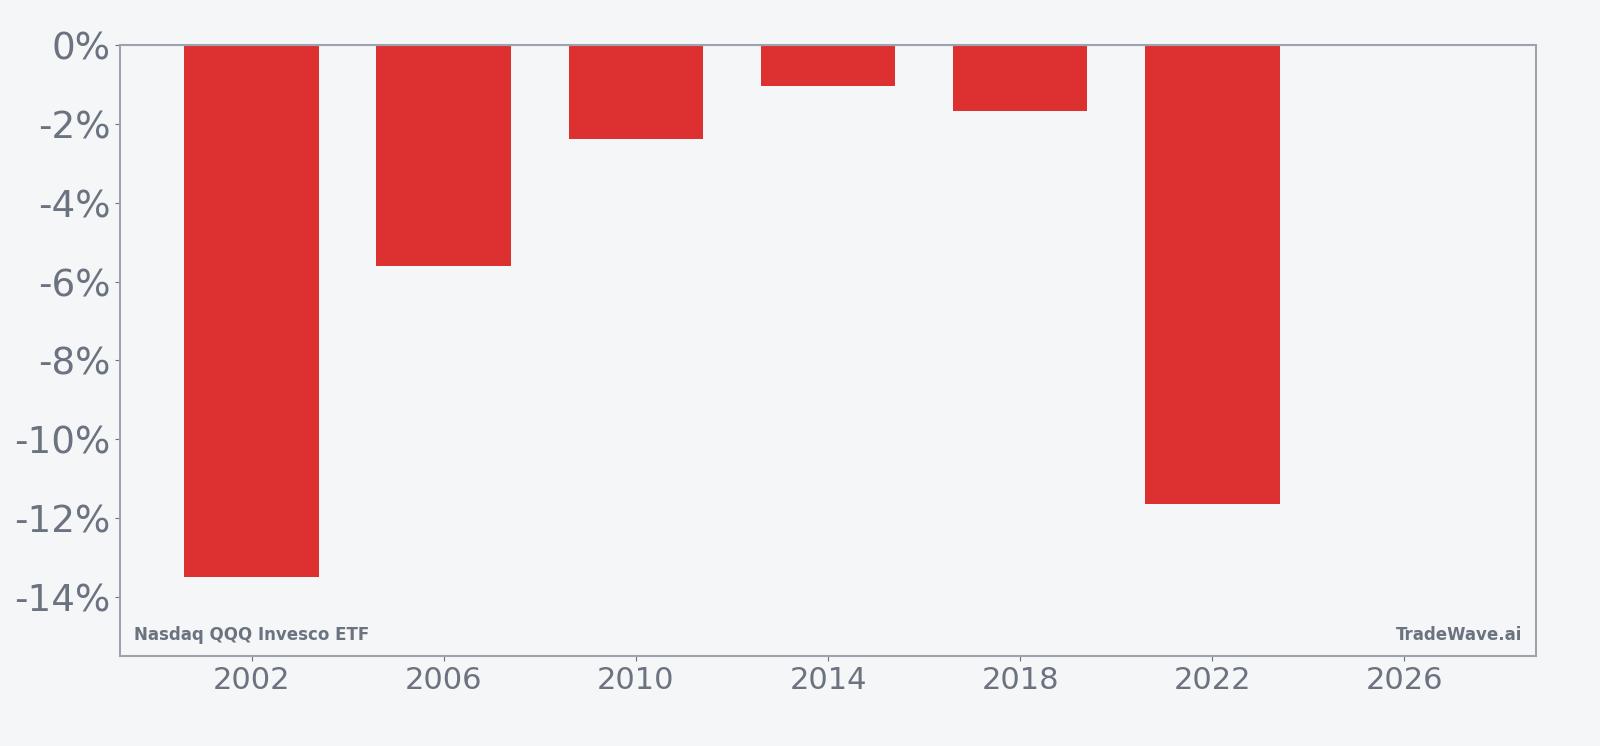
- Across the last 6 midterm election years, this 66-day window has produced a decline for Nasdaq QQQ Invesco ETF every time, aligning with a short trade direction.
- The window begins on Mar 15 and runs for roughly three months of trading days, capturing the early midterm-year stretch when policy uncertainty and rate debates often flare.
- Percent Profitable is 100% with 6 winners and 0 losers for the short setup, with an average profit of 5.97% in favor of the downside.
- Individual years have seen net drops as deep as 13.48%, while even the mildest year still finished lower, underscoring how consistently weakness has shown up in this slice of the calendar.
- Intraperiod swings have been sharp, with best-case favorable moves for shorts reaching double digits and adverse rallies also sizable, pointing to a high-volatility environment rather than a smooth grind.
- With QQQ recently about 5.8% below its 52-week high and mega-cap tech still anchoring the market, how the ETF behaves in this window could shape broader risk sentiment into early summer.
According to historical data from TradeWave.ai, this midterm-year stretch has behaved very differently from an average spring for QQQ, and the next section walks through what that pattern has looked like in practice.
Seasonal window
Nasdaq QQQ Invesco ETF has declined in all 6 midterm election years during this 66-day window, averaging 5.97% downside in favor of a short trade direction. The ETF last traded at 599.75, leaving it about 5.8% below its 52-week high of 636.60 and well above its 52-week low near 399.53, so the pattern is kicking in with QQQ still closer to the top of its recent range.
The presidential election cycle matters here because this pattern isolates only midterm election years, a phase that has often featured tighter financial conditions, policy brinkmanship in Washington and more volatile reactions in growth-heavy benchmarks like QQQ. Pattern phase and calendar phase are aligned: the current year is a midterm election year, and this window captures the early part of that year, when markets have historically struggled to digest shifting expectations for regulation, taxes and central bank policy.
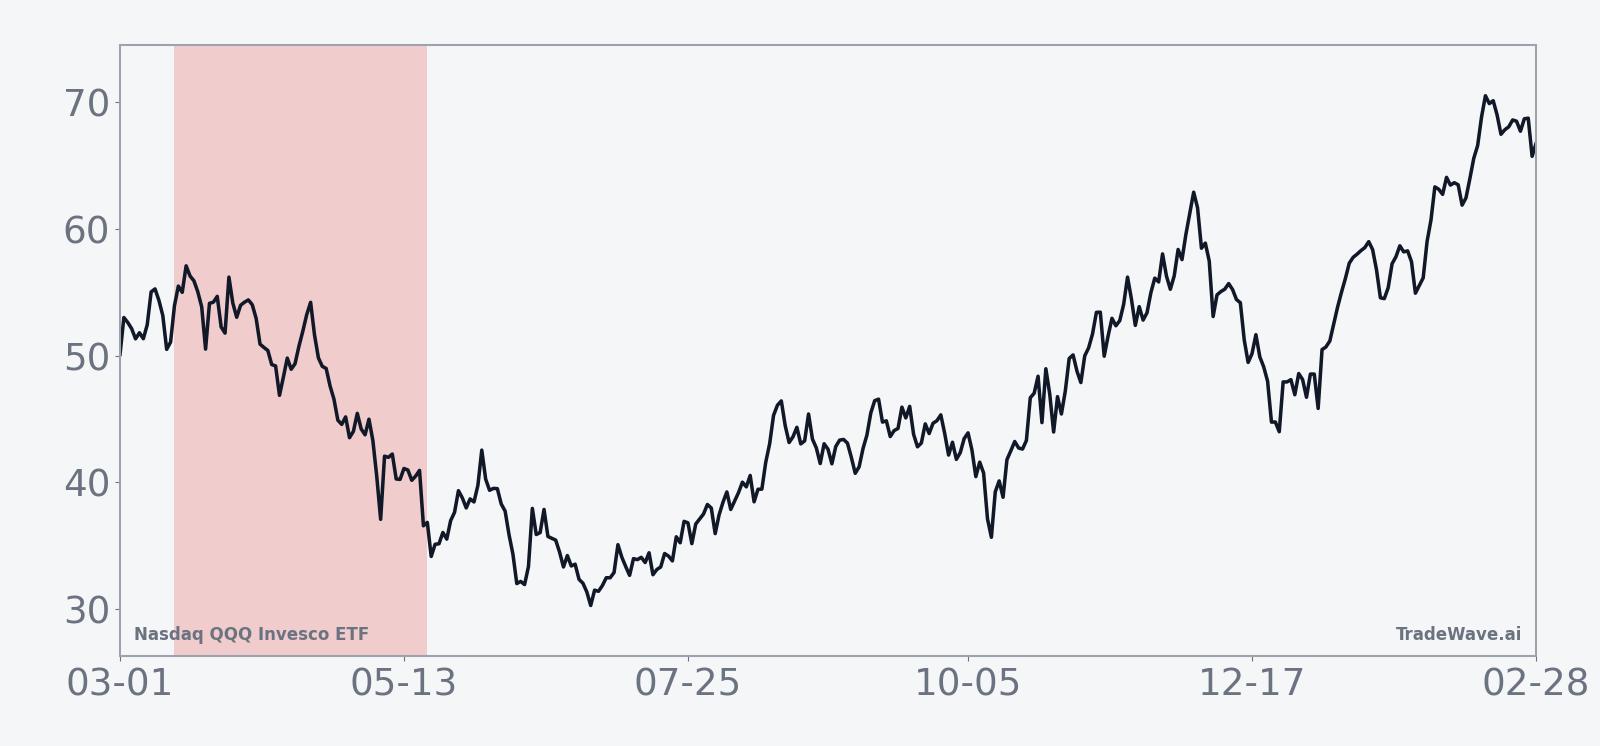
This seasonal window begins on Mar 15 and spans 66 trading days. Historically, during this period, Nasdaq QQQ Invesco ETF has shown a clear downside tendency that favors short exposure rather than long, with every midterm-year sample finishing lower by the end of the window. The trade direction is explicitly short, so years with negative returns are the “good” outcomes for the pattern, while any sharp rallies inside the window have represented adverse moves for that setup.
Percent Profitable sits at 100%, with 6 winners and 0 losers for the short strategy across the last six midterm election years. Average profit of 5.97% reflects the mean decline in QQQ over the full window in those years, while the median profit of 4.0% shows that even the middle-of-the-pack outcome still delivered a meaningful move lower. Because there are no losing years in this sample, the average loss metric is 0%, and the cumulative return across all six windows is a 40% gain for the short side.
The per-year table shows how that plays out in individual cycles. The strongest year for the short pattern was 2002, when QQQ fell 13.48% between entry and exit, while 2022 also delivered a double-digit 11.64% decline as rising rates hit growth valuations. On the softer side, 2014 still produced a 1.04% drop, which counts as a win for the short setup but illustrates that not every midterm-year spring has been a full-blown slide.
Intraperiod swings have been large in both directions. Maximum favorable moves for shorts, the best point-to-peak declines within the window, reached 13.45% in 2022 and 7.33% in 2010, showing that when the pattern works, it can work quickly. Maximum adverse moves, the worst drawdowns against the short position, have also been significant, with a 23.66% rally against shorts in 2002 and double-digit squeezes in 2010 and 2022, underscoring that even winning years featured sharp countertrend spikes before finishing lower.
The Sharpe ratio of 0.98 for this pattern indicates that, based on end-of-window outcomes, the risk-adjusted return has been solid but not smooth, consistent with the elevated standard deviation of 5.37%. The historical trend profile, which tracks the average path of returns inside the window, shows that weakness has tended to build in waves rather than in a straight line, with early choppiness often giving way to more decisive downside later in the period. Trend statistics also show more days where the short side has been in control than the long side, reinforcing the directional bias.
Yearly net and peak moves highlight how downside has ultimately prevailed even when intraperiod rallies were sharp.
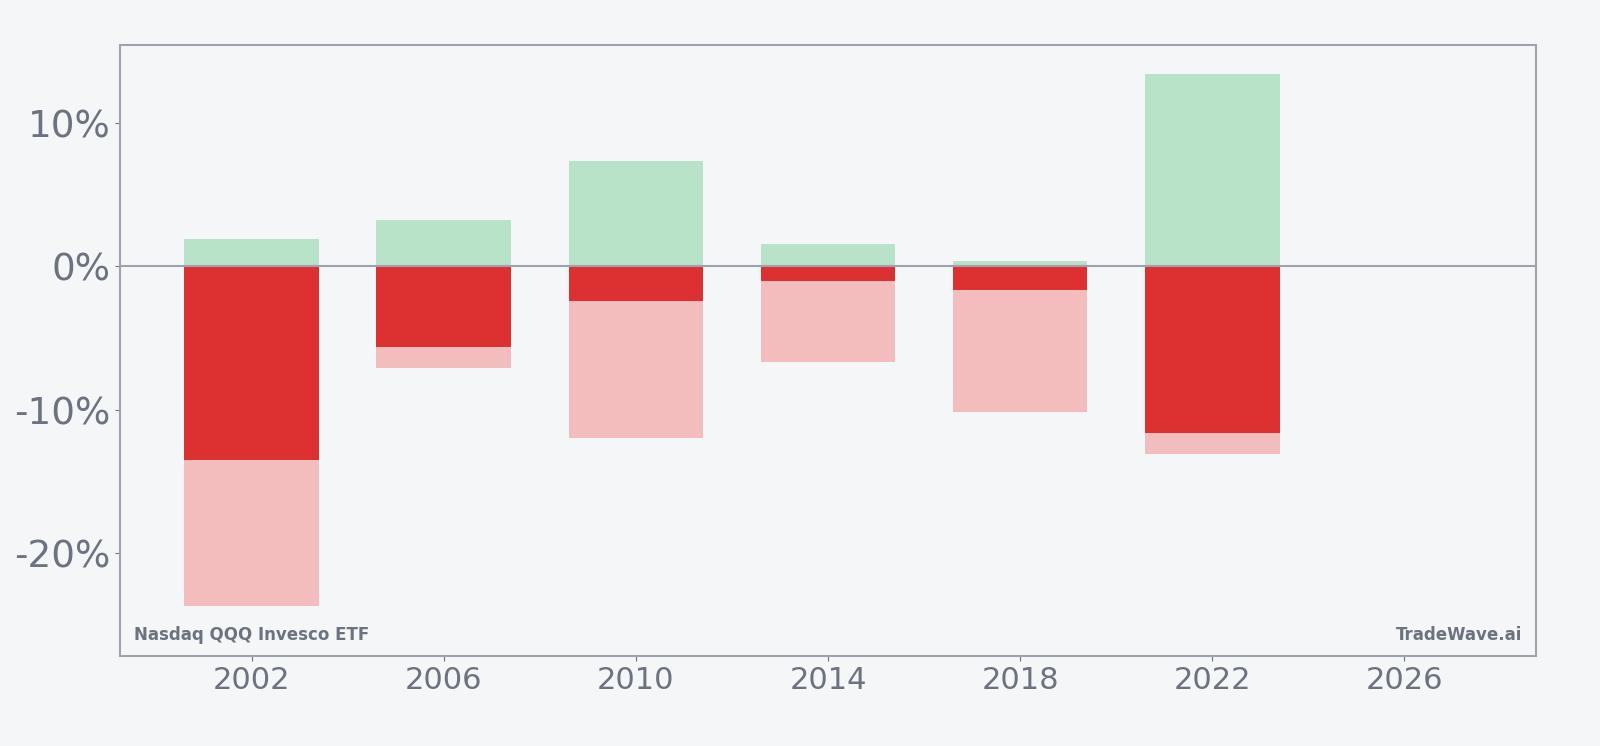
The stacked view of net results alongside maximum favorable and adverse excursions shows a consistent pattern: every year has ended with QQQ lower, but the path has often included sizable rallies that would have pressured shorts before the eventual decline. Large maximum favorable moves combined with large maximum adverse moves point to a high-variance window where both sharp drops and sharp squeezes have been common.
History does not guarantee future results, and adverse excursions can be large even in windows that ultimately finish in the trade direction.
Price and near-term drivers
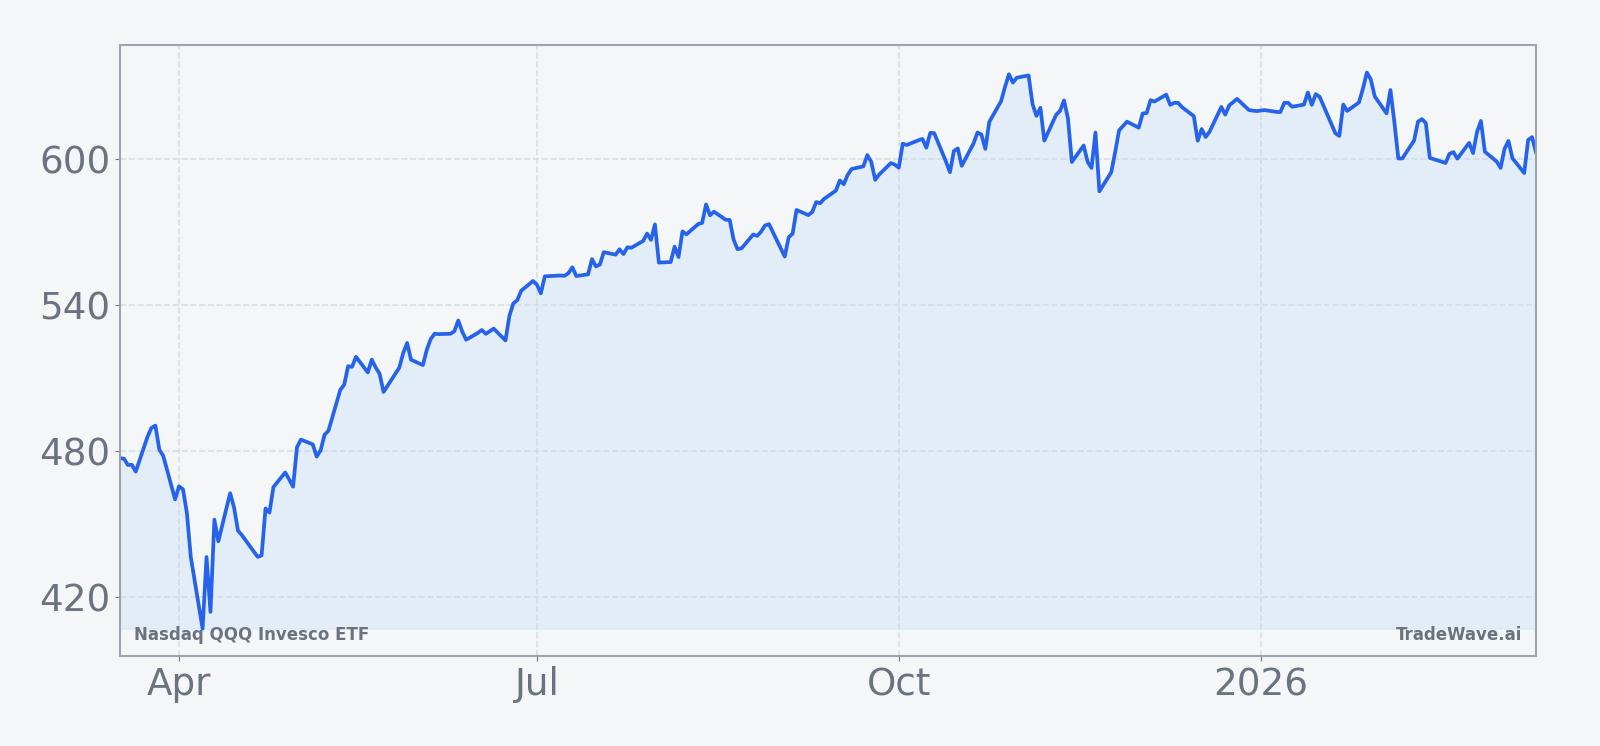
QQQ finished the latest session at 599.75, down 1.5% on the day, leaving the ETF about 5.8% below its 52-week high of 636.60 and well above its 52-week low near 399.53. Over the past month, the fund has slipped 2.59%, a modest pullback after a powerful multi-quarter run that has kept it trading above its 50-day moving average of 613.85 for much of the winter.
Average 20-day volume sits around 72.7 million shares, a reminder that QQQ remains one of the deepest and most liquid vehicles for expressing views on large-cap U.S. growth stocks. The ETF’s heavy weighting in mega-cap technology and communication services names means its behavior often sets the tone for broader risk appetite, especially when volatility picks up around macro events such as inflation data, Federal Reserve meetings or major earnings seasons.
In Oct 2025, chart-based analysis highlighted key support levels in QQQ as volatility increased, pointing to areas where dip buyers had previously stepped in during pullbacks.[1] That backdrop matters for this year’s midterm window because many of those levels sit not far below current prices, creating a potential collision between historical seasonal weakness and zones where technical buyers may be waiting.
The chart below situates the latest move in its recent multi-month context.
Election-cycle and macro backdrop
The current year is the midterm election year in the U.S. presidential cycle, a phase that has often produced a “two-playbook” pattern for equities. Early in the year, markets have tended to wrestle with policy uncertainty, budget fights and shifting expectations for regulation, while the later part of the midterm year into the following pre-election year has historically been much stronger for risk assets.
For a tech-heavy benchmark like QQQ, that early midterm stretch has often coincided with debates over antitrust policy, digital regulation and the broader stance toward large-cap technology platforms. At the same time, the Federal Reserve’s path on interest rates remains central for growth valuations, since higher real yields can compress multiples on long-duration cash flows. When those macro and policy narratives collide with a historically weak seasonal window, volatility in QQQ has often spilled over into the broader market.
What to watch in this window
For traders and investors, the key question in this 66-day stretch is whether QQQ respects or breaks the midterm-year pattern. Historically, the ETF has tended to chop early in the window before weakness becomes more decisive, so the behavior of pullbacks and bounces in the next few weeks will be important. A series of lower highs and heavier selling on down days would be consistent with prior cycles, while a sustained breakout back toward the 52-week high would mark a clear departure from the historical script.
Levels matter. The 50-day moving average near 613.85 and the 52-week high around 636.60 frame the upside band, while prior support zones identified in past volatility episodes could come back into play if selling accelerates.[1] How QQQ trades around those areas during this window will help determine whether this midterm-year pattern once again leans into downside or finally delivers its first losing year for the short setup.
Macro catalysts will also shape the tape. Inflation prints, Fed communications and any surprise shifts in fiscal or regulatory rhetoric toward large-cap tech could all act as triggers inside a window that has historically been prone to sharp intraperiod swings. If volatility spikes and QQQ begins to show the kind of deep intraperiod drawdowns seen in 2002 and 2022, that would align with the historical profile of this pattern. If, instead, pullbacks remain shallow and are quickly bought, it would signal that the market is treating this midterm year differently from the last six.
In short, the record for this window is six for six in favor of the short side. The next two months will show whether QQQ’s current uptrend and the market’s appetite for mega-cap tech are strong enough to finally break that streak.