Geopolitical Shocks Push S&P 500 Energy Sector SPDR (XLE) Toward a Bullish 24-Day Midterm Window
S&P 500 Energy Sector SPDR is heading toward a historically strong 24-day midterm-year window just as geopolitical shocks and heavy retail flows pull fresh money into the energy trade.

Key takeaways
- A 24-day seasonal window for S&P 500 Energy Sector SPDR starting Mar 24 has been positive in 5 of the last 6 midterm election years, with a long trade direction.
- Winning years in this window have averaged gains of 5.33%, while including the lone losing year brings the all-years average to 4%.
- The pattern’s Percent Profitable is 83%, with 5 winners and 1 loser across the last six midterm election-year samples.
- A TradeWave Ratio of 9.48 and a Sharpe ratio of 1.81 point to historically strong risk-adjusted upside during this slice of the calendar.
- Intraperiod swings have been meaningful, with both sizable peak run-ups and notable drawdowns inside the window, so timing and risk controls have mattered.
- Retail inflows into XLE around recent geopolitical shocks and options strategies targeting upside add a positioning layer on top of the upcoming seasonal bias.[1][4]
According to historical data from TradeWave.ai, this late-March stretch has behaved very differently from an average month for XLE in past midterm election years, and the next iteration is about to open again.
Seasonal window
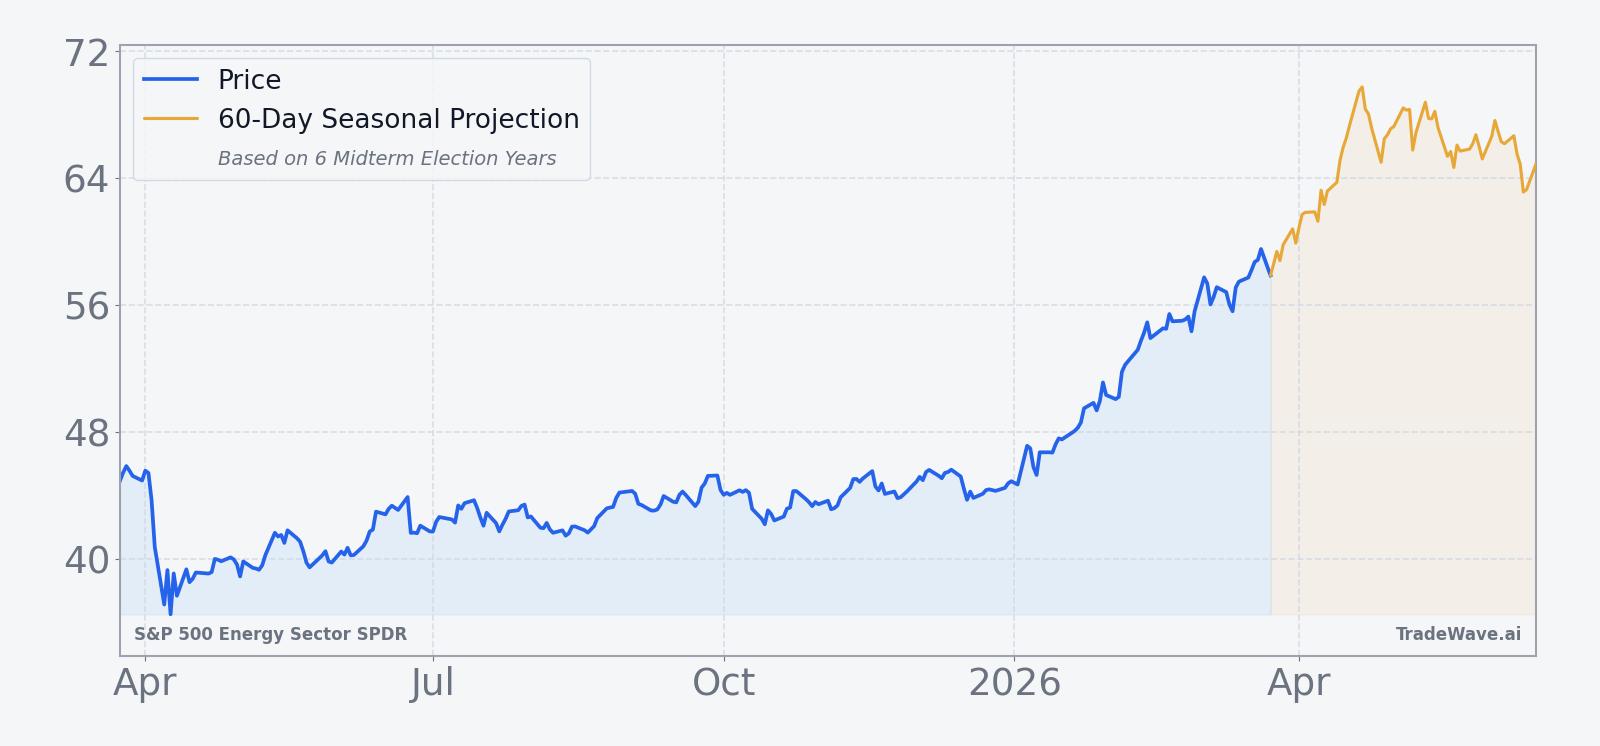
S&P 500 Energy Sector SPDR has risen in 5 of the last 6 midterm election-year windows that begin around Mar 24 and run for 24 trading days, averaging 5.33% gains in the winning years. The ETF last closed at 89, leaving traders focused less on distance to any single high or low and more on how this historically strong spring stretch might interact with a market already primed by geopolitical risk and heavy retail interest.
The presidential election cycle matters here because this pattern only looks at the last six midterm election years, a phase that often brings policy uncertainty on regulation, drilling permits and export rules that directly affect energy majors. Grouping by midterm years isolates how XLE has behaved when Washington is in the middle of the cycle and the policy calendar is heavy on hearings and rulemaking rather than campaign promises.
This seasonal window begins on Mar 24 and spans 24 trading days. Historically, during this period, S&P 500 Energy Sector SPDR has shown a strong upside tendency for long exposure, with 83% of the sampled midterm years finishing higher over the window and only one year posting a small loss or flat result.
Across those six midterm-year samples, the average gain in winning years is 5.33%, while including the lone down year pulls the all-years average to 4%. That gap between winners-only and all-years performance is small, which suggests the losing outcome has been modest compared with the typical upside in the strong years.
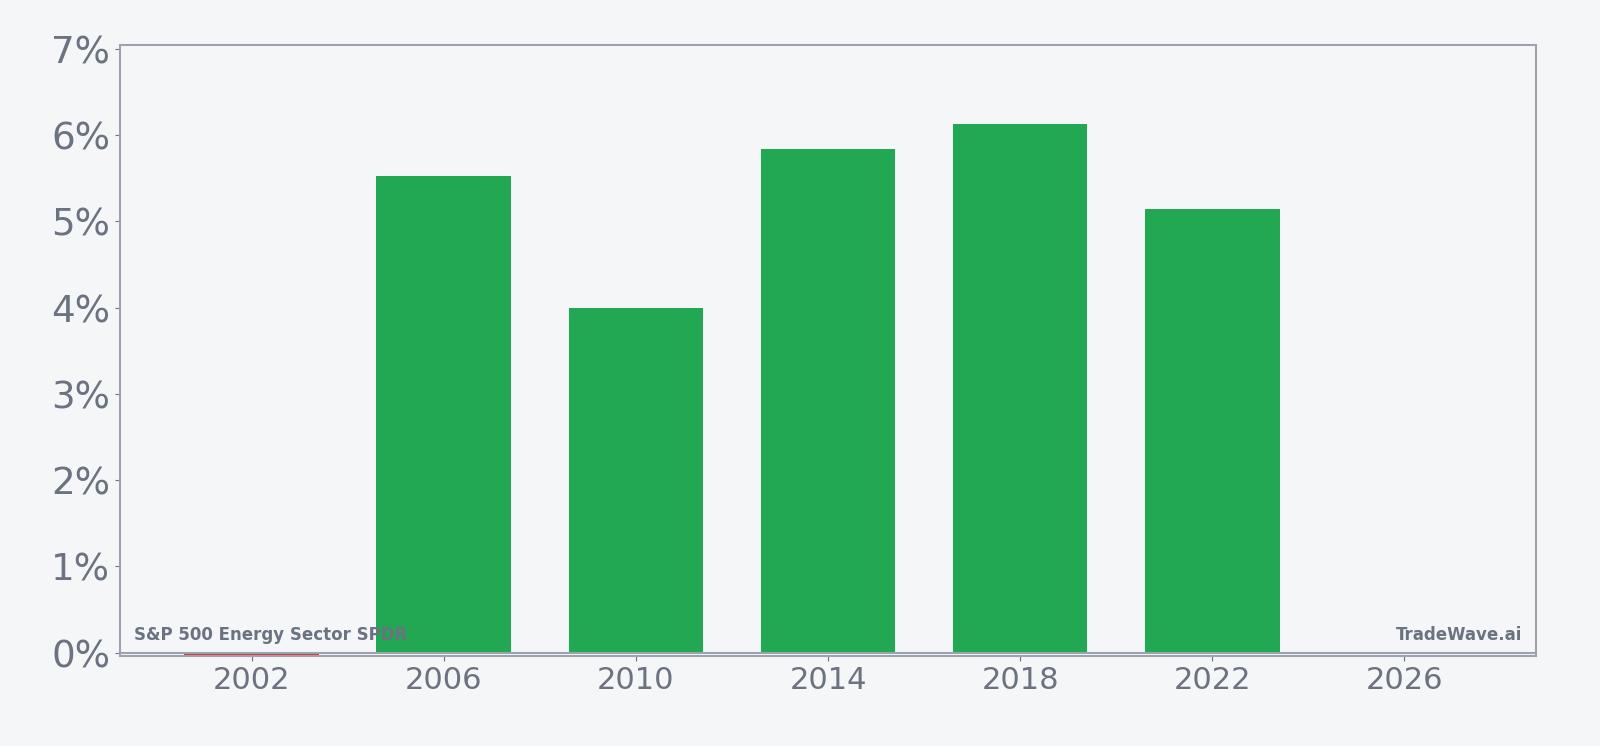
The per-year breakdown shows how consistent that pattern has been. In 2006, the window delivered a 5.53% gain, while 2014 and 2018 posted 5.84% and 6.13% respectively, and 2022 added 5.14%. The weakest outcome in the sample was 2002, which finished essentially flat at about a 0.04% loss despite a respectable intraperiod rally.
The historical seasonal average suggests that gains in this window tend to build steadily rather than in a single spike, with the path showing a firm upward drift across most of the 24 days. That steady climb fits with the idea of a midterm-year environment where policy noise is high but energy fundamentals and positioning quietly support the sector.
Yearly net and peak moves highlight upside persistence amid typical drawdowns.
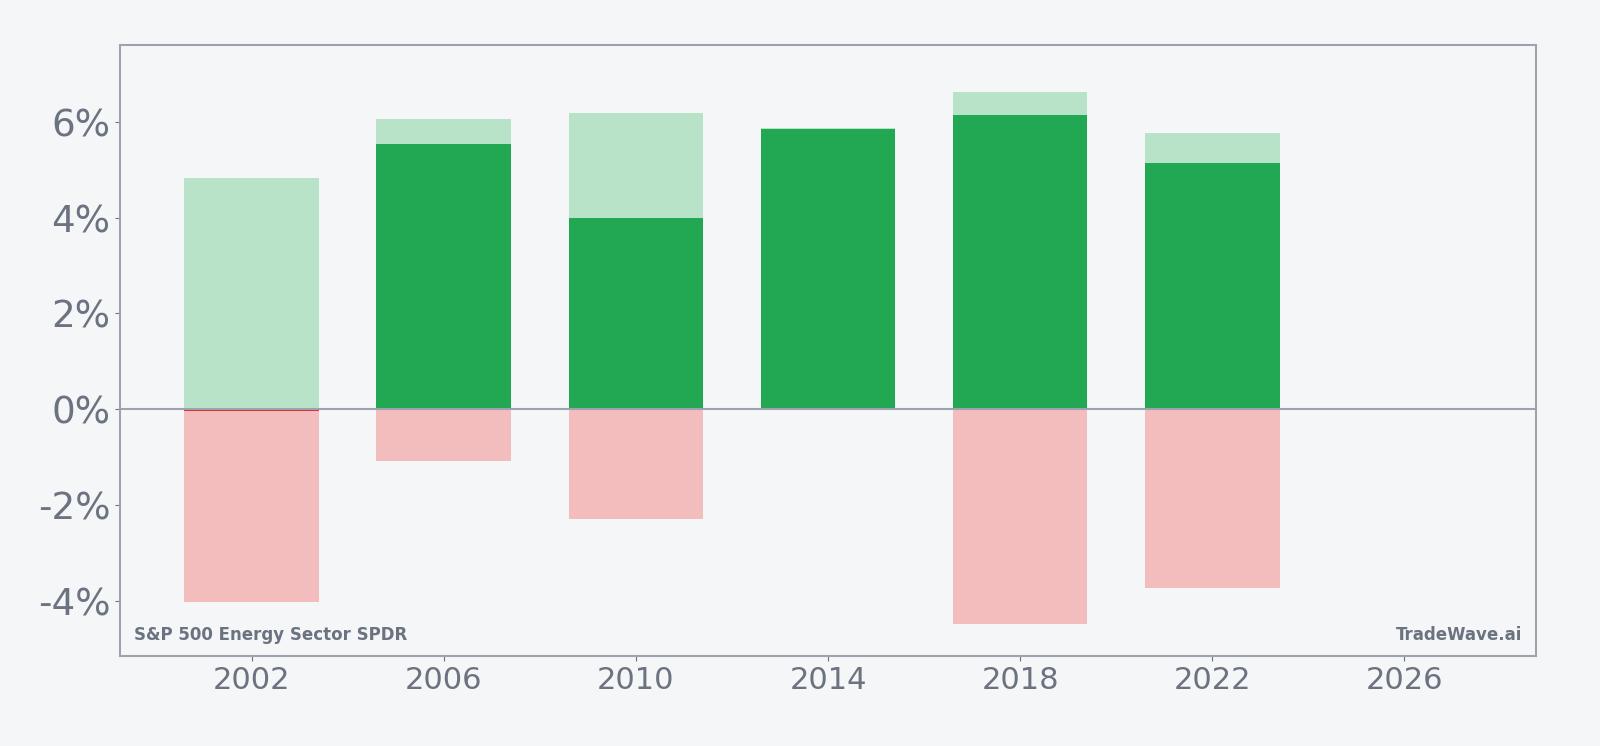
The bar chart that combines net returns with peak favorable moves and worst drawdowns shows why this window has attracted tactical traders. In strong years like 2018, XLE’s best intraperiod run-up exceeded the final gain, while the worst drawdown stayed contained relative to that upside. In softer years such as 2002, the ETF still saw a sizable peak rally of about 4.83% but also endured a roughly 4.01% adverse move from entry before finishing flat, underscoring that even “good” seasonal windows can involve uncomfortable swings.
History does not guarantee future results; adverse excursions (MAE) can be large even in winning windows.
Price and near-term drivers
S&P 500 Energy Sector SPDR last traded around 89, with the past month delivering a 6.35% gain as the ETF climbed out of its recent consolidation and pushed further above its 50-day moving average near 51.39. That move has unfolded alongside a surge in retail buying, with investors pouring millions into XLE around U.S.-Israeli strikes on Iran as a hedge against potential supply shocks and shipping disruptions.[4][5]
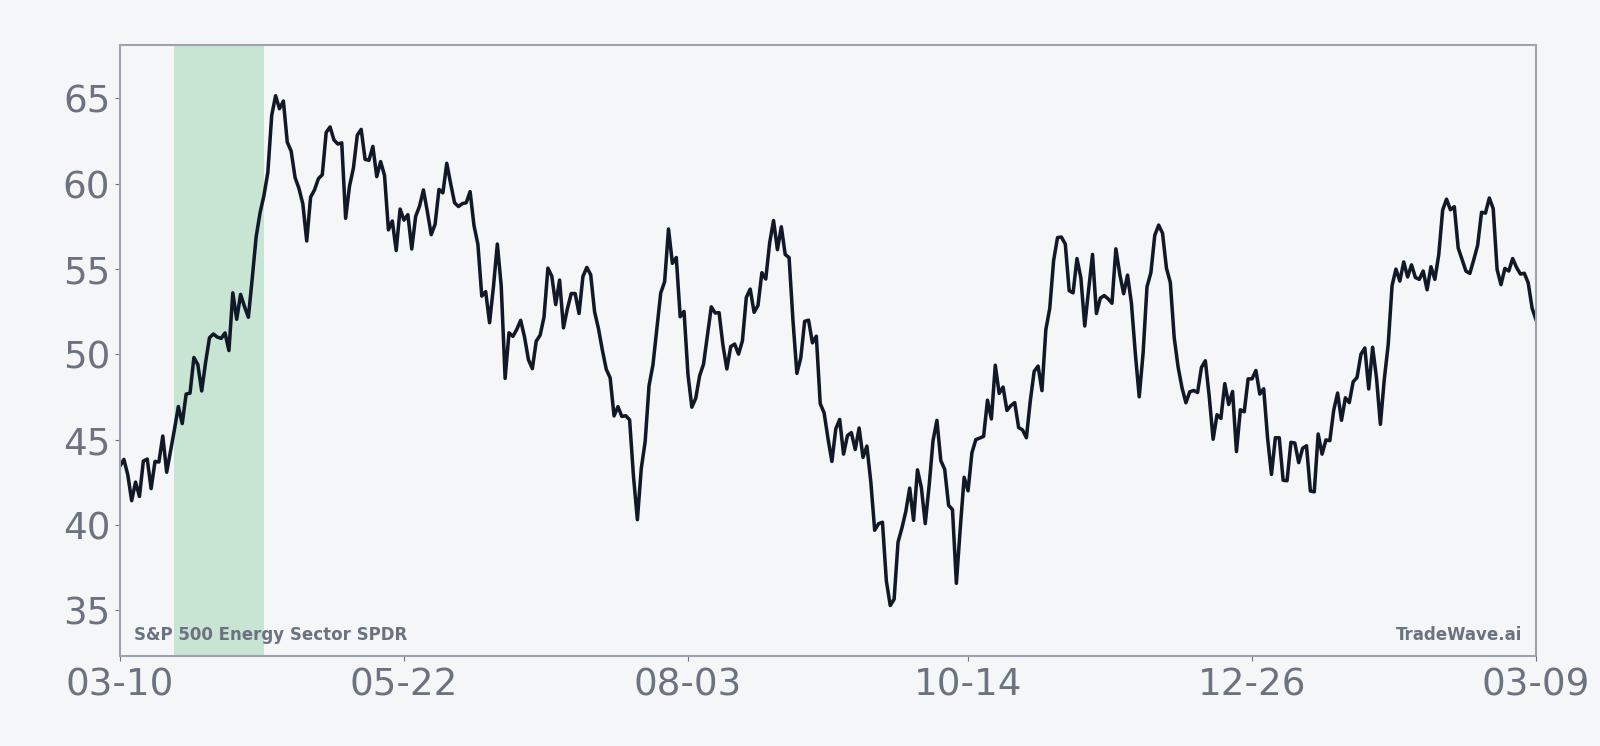
The chart below situates the latest move in its recent multi-month context.
Sector specialists describe XLE as sitting at an inflection point, with converging trendlines and a potential breakout backdrop tied to stronger midstream and downstream earnings and robust LNG exports.[2][3] That technical setup has encouraged options strategies that lean into upside, including risk-reversal structures that sell downside puts to finance calls on the ETF.[1] At the same time, U.S. oil executives have warned that disruptions in key shipping lanes such as the Strait of Hormuz could deepen the global energy crunch, a scenario that would keep volatility elevated across the energy complex.[5]
Those cross-currents mean the upcoming seasonal window will not trade in a vacuum. If geopolitical tensions stay high and supply fears persist, the historical midterm-year bias toward gains could intersect with a market already positioned for higher energy prices. If tensions ease or policy headlines shift toward regulation and windfall taxes instead, the same window could test how durable that seasonal pattern really is.
What to watch as the window opens
For the 24-day stretch starting Mar 24, the first thing to watch is whether XLE respects the historical script of steady, grind-higher behavior or instead delivers a choppier path with deeper intraperiod drawdowns. The seasonal record shows that even in winning years, the ETF has often pulled back several percentage points from entry before finishing higher, so traders will be watching how any early weakness compares with past maximum adverse moves.
Second, the policy calendar around midterm years can quickly change the tone for energy. Hearings on drilling permits, export rules or refinery emissions, along with any fresh commentary from U.S. oil CEOs on supply risks, could either reinforce or undercut the sector’s current breakout narrative.[3][5] Headlines that tighten the outlook for supply or ease regulatory pressure would rhyme with the historical upside bias, while surprise moves toward stricter rules could make this iteration of the window more volatile than the average.
Third, positioning will matter. Retail inflows into XLE around the Iran-related strikes and the use of options risk reversals to express bullish views give traders a clear tell to monitor.[1][4] If call buying and net inflows stay strong as the window progresses, that would signal that investors are leaning into the seasonal pattern. If options activity flips toward downside protection or flows reverse, it would suggest that the market is fading the historical tendency despite the strong track record.
Finally, price levels inside the window will offer a simple scoreboard. A continuation of the recent 6.35% one-month advance, especially if accompanied by contained drawdowns relative to prior midterm years, would line up with the 83% win rate that has defined this slice of the calendar. A sharp break lower or a flat outcome despite supportive macro headlines would mark this as one of the rare cycles where the midterm-year spring playbook did not deliver.
Sources
- Options trading on XLE suggested as a strategy to capture energy sector upside, focusing on a risk reversal trade (date unavailable)
- Energy sector breakout analysis highlighting XLE at an inflection point (date unavailable)
- Q3 performance review of the energy sector, including XLE, with focus on LNG exports and refining margins (date unavailable)
- Retail investors buy XLE amid U.S.-Israeli strikes on Iran, driving strong ETF inflows (Mar 2, 2026)
- U.S. oil CEOs warn of worsening global energy crisis and shipping-route risks (Mar 15, 2026)