Trust VIX Short-Term Futures ETF (VIXY) Has Dropped 10 of 10 Times in This 60-Day Spring Window
Trust VIX Short-Term Futures ETF is heading toward a 60-day spring stretch that has historically punished long volatility, even as the ETF trades well above its 52-week low.

What is the seasonal pattern for Trust VIX Short-Term Futures ETF (VIXY)?
Trust VIX Short-Term Futures ETF has fallen in 10 of 10 years during this April–June window, with an average gain of 21.97% for short positions in winning years.
- 10 for 10 in this window, with short positions averaging 21.97% profit across winning years.
- The 60-day pattern starts on Apr 9 and has historically favored short exposure to VIXY.
- Percent Profitable is 100%, with 10 winners and 0 losers over the past decade.
- Annualized return for the pattern is 21.49%, with a Sharpe ratio of 1.92 for end-of-window outcomes.
- The TradeWave Ratio of 3.02 signals that price typically travels meaningfully in the trade direction within the window.
- Intraperiod swings have included sharp rallies and deep drawdowns, underscoring that volatility ETPs can move hard even in “winning” seasonal years.
According to historical data from TradeWave.ai, this upcoming spring stretch has behaved very differently from an average month for VIXY. The next section walks through how that pattern has played out and what it could mean for volatility traders watching this Trust VIX Short-Term Futures ETF trading window.
How has Trust VIX Short-Term Futures ETF (VIXY) traded in this April–June window?
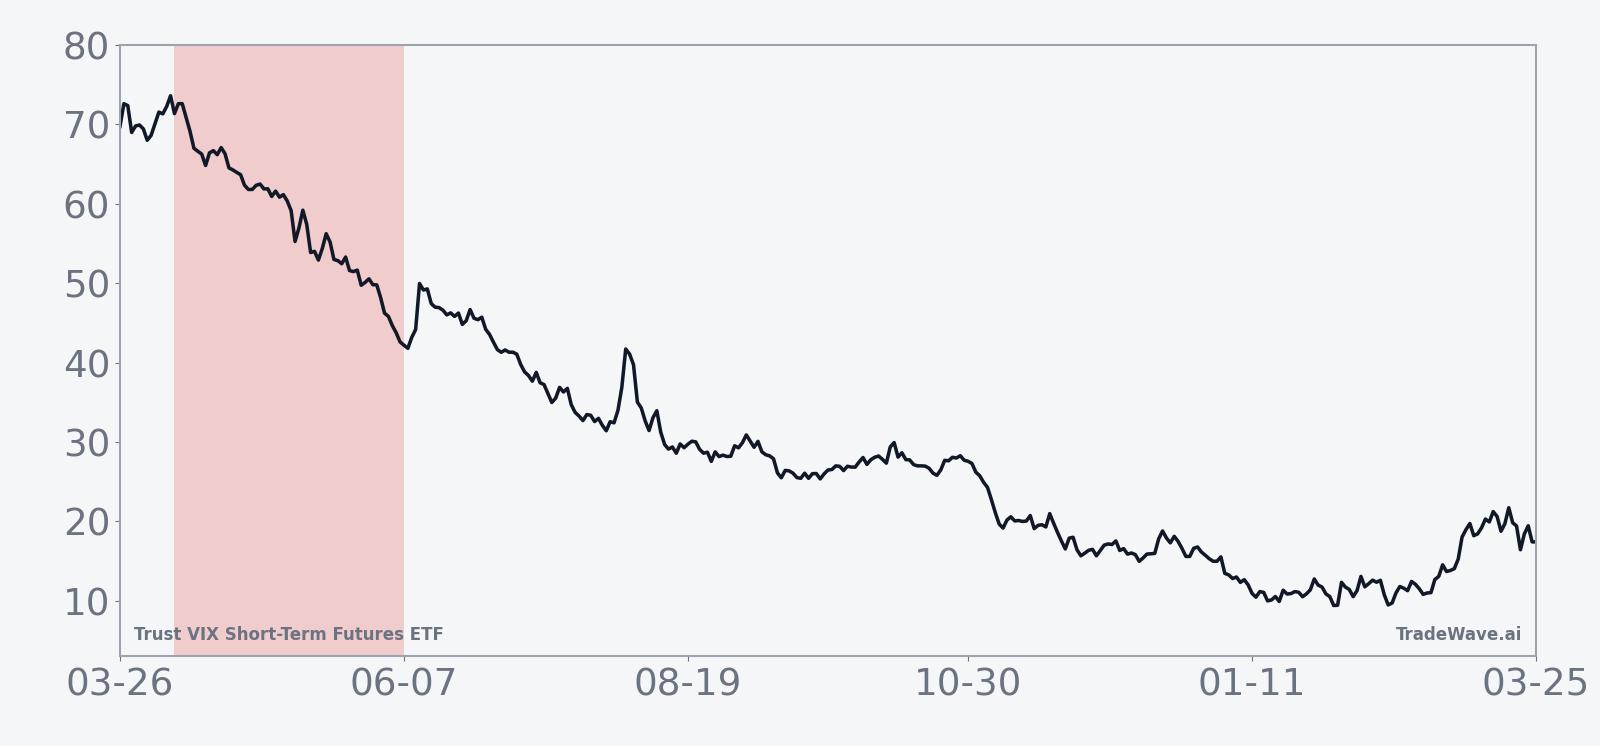
Trust VIX Short-Term Futures ETF has delivered profits for short positions in every single iteration of this 60-day April–June window over the past decade, averaging 21.97% gains for those shorts. The next window begins on Apr 9, with VIXY coming off a 25.13% one-month jump and trading between a 52-week low of 24.81 and a 52-week high of 89.14, a reminder of how violently volatility products can swing. For traders who use VIXY as a hedge or speculative vehicle, that combination of a strong short-side seasonal trend and a still-elevated recent move makes this slice of the calendar hard to ignore.
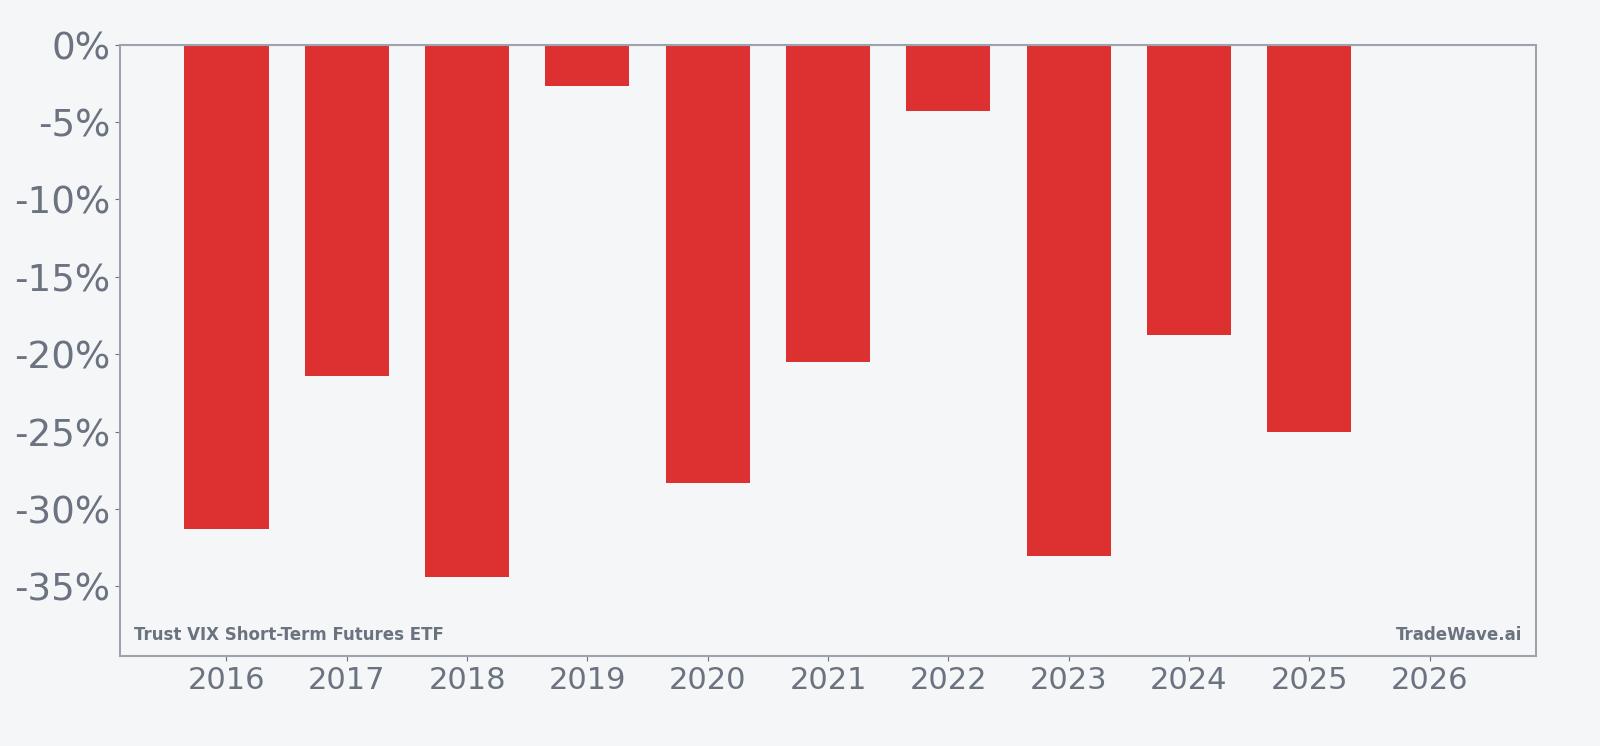
Year-by-year net returns and intraperiod swings show how consistently VIXY has drifted lower in this stretch, even with sharp countertrend spikes along the way.
The trade direction for this pattern is explicitly short, which fits the profile of a volatility ETF that tends to decay when equity markets are calm. Across the 10-year lookback, Percent Profitable is 100%, with 10 winners and 0 losers, and the cumulative return for the pattern clocks in at 600% for short exposure. Average profit of 21.97% per year in the window is large for a 60-day trade, and the annualized return of 21.49% with a Sharpe ratio of 1.92 points to a historically strong risk-adjusted edge for traders who were short VIXY during this slice of the calendar.
The per-year table shows that some windows have been standout winners for shorts, such as 2018 and 2023, where net returns for the pattern were around -34% and -33% respectively for VIXY, meaning sizable gains for those betting against the ETF. Even the softer years, like 2019 and 2022, still finished with VIXY lower by a few percentage points, keeping the win streak intact. That consistency is unusual for a product tied to volatility, which is often thought of as chaotic and hard to time.
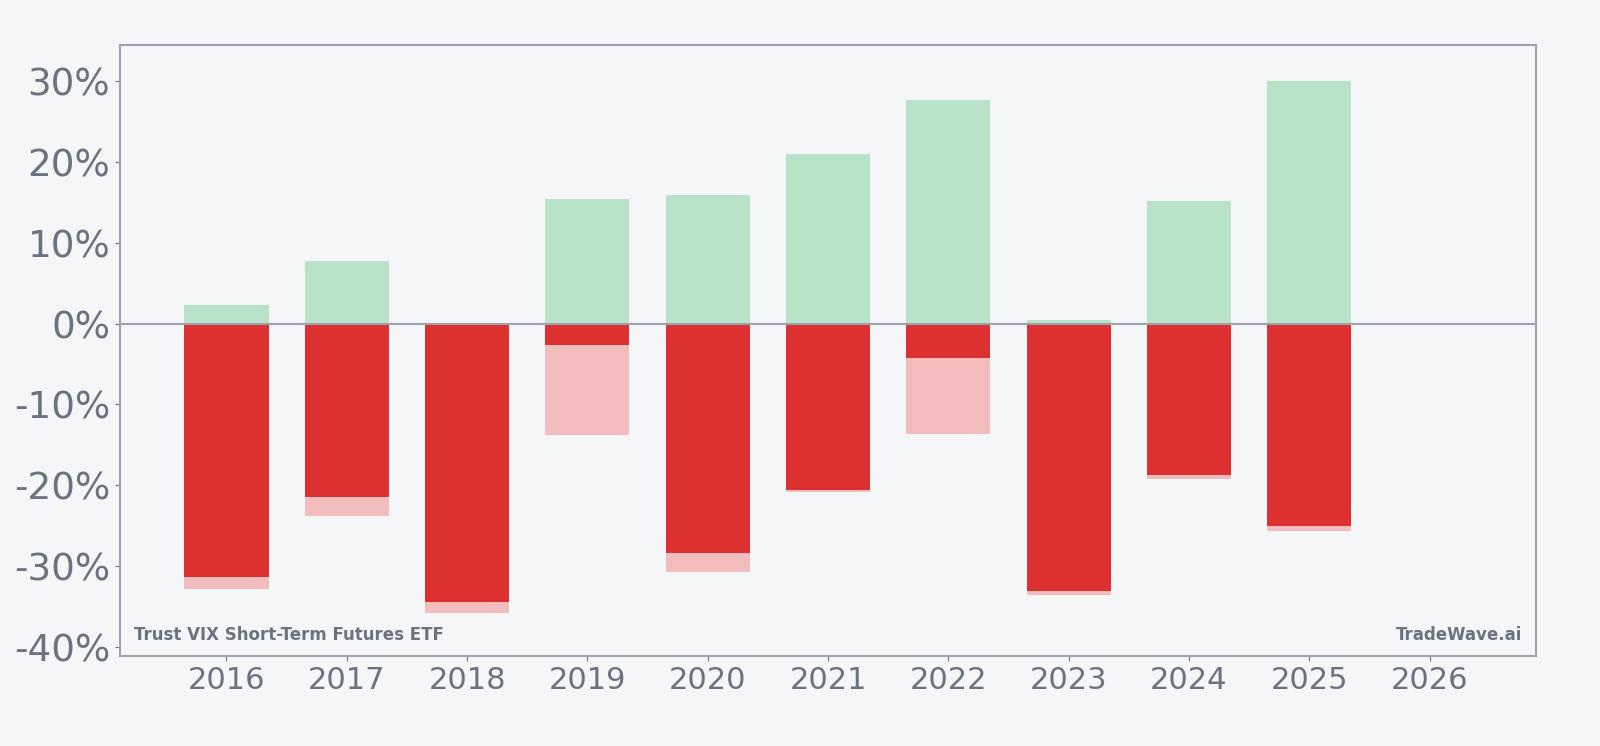
MFE/MAE behavior inside the window underlines how bumpy the ride can be even when the final outcome favors shorts. In 2022, for example, the maximum favorable move for the short side reached roughly 27.61%, but the worst intraperiod drawdown from entry was about 13.69%, meaning traders had to sit through a double-digit squeeze before the pattern finished in their favor. In 2020, the short side saw a maximum favorable excursion near 15.89% and a maximum adverse move of about 30.72%, a reminder that volatility ETPs can spike hard before resuming their typical decay.
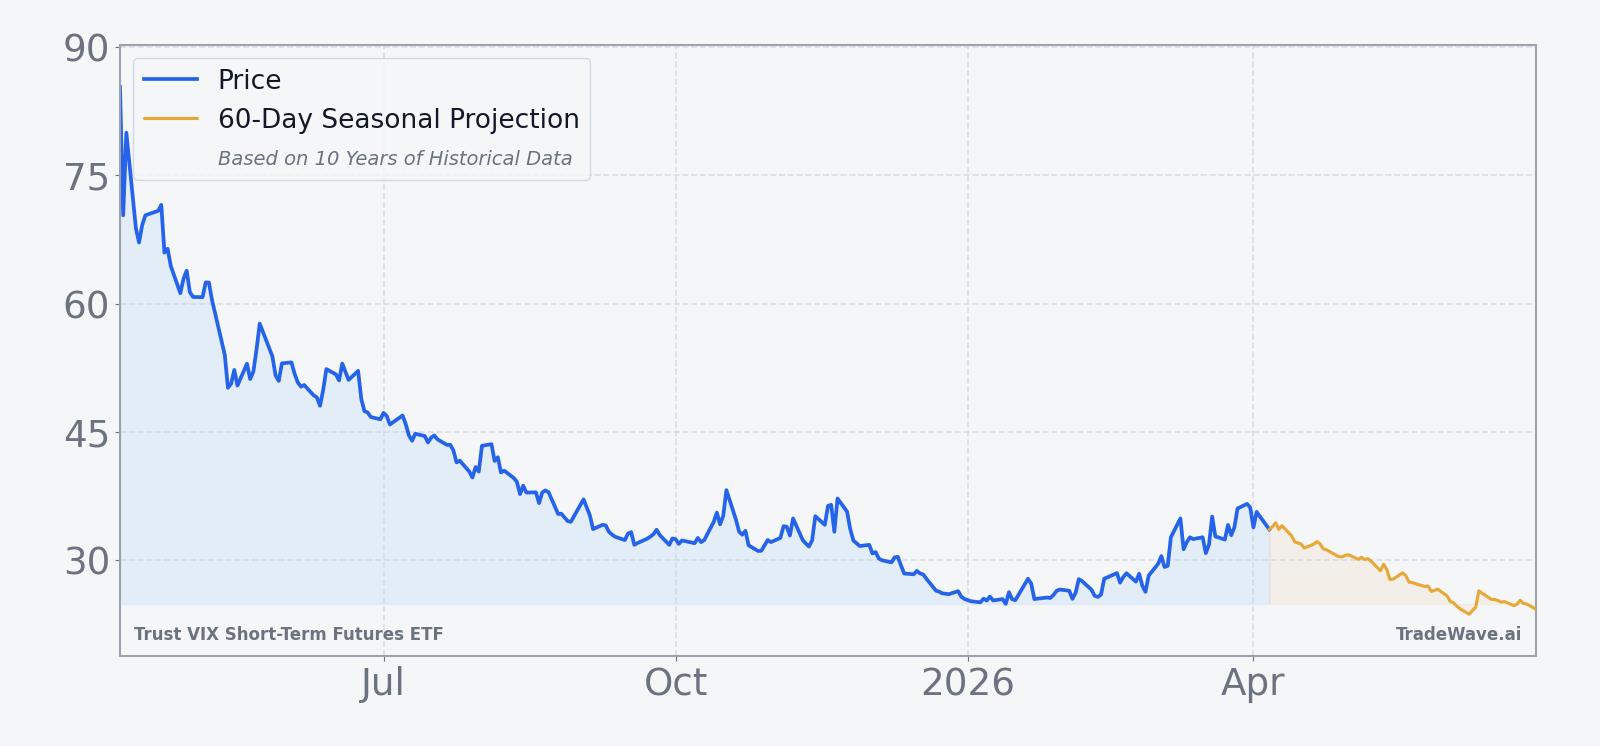
The 10-year average seasonal trend suggests that much of the short-side profit tends to accrue gradually rather than in a single crash. The curve slopes lower for VIXY across most of the 60 days, with a tendency for sharper drops in the middle of the window and some choppiness toward the end. That fits a backdrop where equity markets often stabilize after early-year shocks, implied volatility bleeds lower, and the roll cost in short-term VIX futures weighs on long-volatility products like Trust VIX Short-Term Futures ETF.
Looking at the stacked net/MFE/MAE bars, the pattern is clear: in most years, the maximum favorable move for shorts has been meaningfully larger in magnitude than the worst squeeze against them, but the adverse spikes are still large enough to matter. Years like 2016 and 2018 show deep negative net returns for VIXY with MAE readings in the -30% to -36% range, which would have been painful for anyone long the ETF but rewarding for disciplined short-volatility strategies that could withstand the noise. Add it up: 10 for 10 winning windows and a 600% cumulative gain for the short side across a decade is a rare level of consistency for a volatility-linked ETF.
History does not guarantee future results; adverse excursions can be large even in winning windows, and volatility products like VIXY can move sharply against seasonal tendencies.
Why does Trust VIX Short-Term Futures ETF (VIXY) follow this seasonal pattern?
One likely driver is the way equity markets often calm down after the first-quarter macro and earnings noise, which can pull implied volatility lower into late spring. Trust VIX Short-Term Futures ETF holds short-term VIX futures, so when the VIX term structure is in contango, the ETF faces a steady drag from rolling into cheaper contracts. This April–June seasonal pattern may reflect that combination of post-earnings volatility compression and structural roll decay, which together have historically favored traders who are short VIXY during this window.
What is driving Trust VIX Short-Term Futures ETF (VIXY) today?
VIXY’s latest one-month return of 25.13% shows how quickly volatility hedges can snap higher when markets get nervous, even though the ETF’s current price, 50-day moving average of 28.63, and 52-week range between 24.81 and 89.14 all point to a product that has spent much of the past year grinding lower. That mix of a sharp recent bounce and a long-term downtrend is typical for short-term VIX futures strategies, which tend to lose value over time but can spike during risk-off episodes. For traders, the key near-term driver is not a single headline but the broader macro tone around equity volatility, liquidity, and positioning into the second quarter, as investors reassess how much protection they want on the books.
The chart below situates the latest move in its recent multi-month context and overlays the upcoming 60-day seasonal projection.
What should traders watch as this VIXY seasonal window approaches?
First, watch how VIXY behaves as Apr 9 approaches relative to its 50-day moving average around 28.63 and the lower end of its 52-week range near 24.81. A drift back toward the lows would fit the historical seasonality, while a sustained break higher would signal that macro stress is overwhelming the usual spring pattern. Second, monitor realized and implied volatility in the S&P 500, since a quiet tape and steep contango in VIX futures have historically lined up with the strongest short-VIXY outcomes in this window.
Third, pay attention to flows and positioning in volatility ETPs and VIX futures. Heavy demand for hedges into macro events can keep VIXY elevated even in a seasonally weak stretch, while a collapse in demand for protection can accelerate the typical decay. Finally, use the historical record as context rather than a script: the 10-for-10 track record and 21.97% average profit for shorts in this window are striking, but the MAE profile shows that even “good” years have included sharp squeezes. How VIXY trades inside this April–June window will tell traders whether the long-running seasonal trend is still in force or starting to break down.
Sources
About this seasonal analysis
Seasonal pattern data is sourced from TradeWave.ai, which analyzes historical price behavior across annual calendar windows going back up to 30 years. Read the full data methodology or the book The 100-Year Pattern by Afshin Moshrefi (2026 edition). Past performance of seasonal patterns does not guarantee future results. This article is for informational purposes only and does not constitute investment advice.