7-of-8 Midterm Wins: CBOE Volatility Index (VIX) Enters a 185-Day Window Averaging 35% Gains
CBOE Volatility Index is pulling back from a geopolitical spike just as it approaches a midterm-year seasonal window that has historically favored higher volatility for months at a time.
What is the seasonal pattern for CBOE Volatility Index (VIX)?
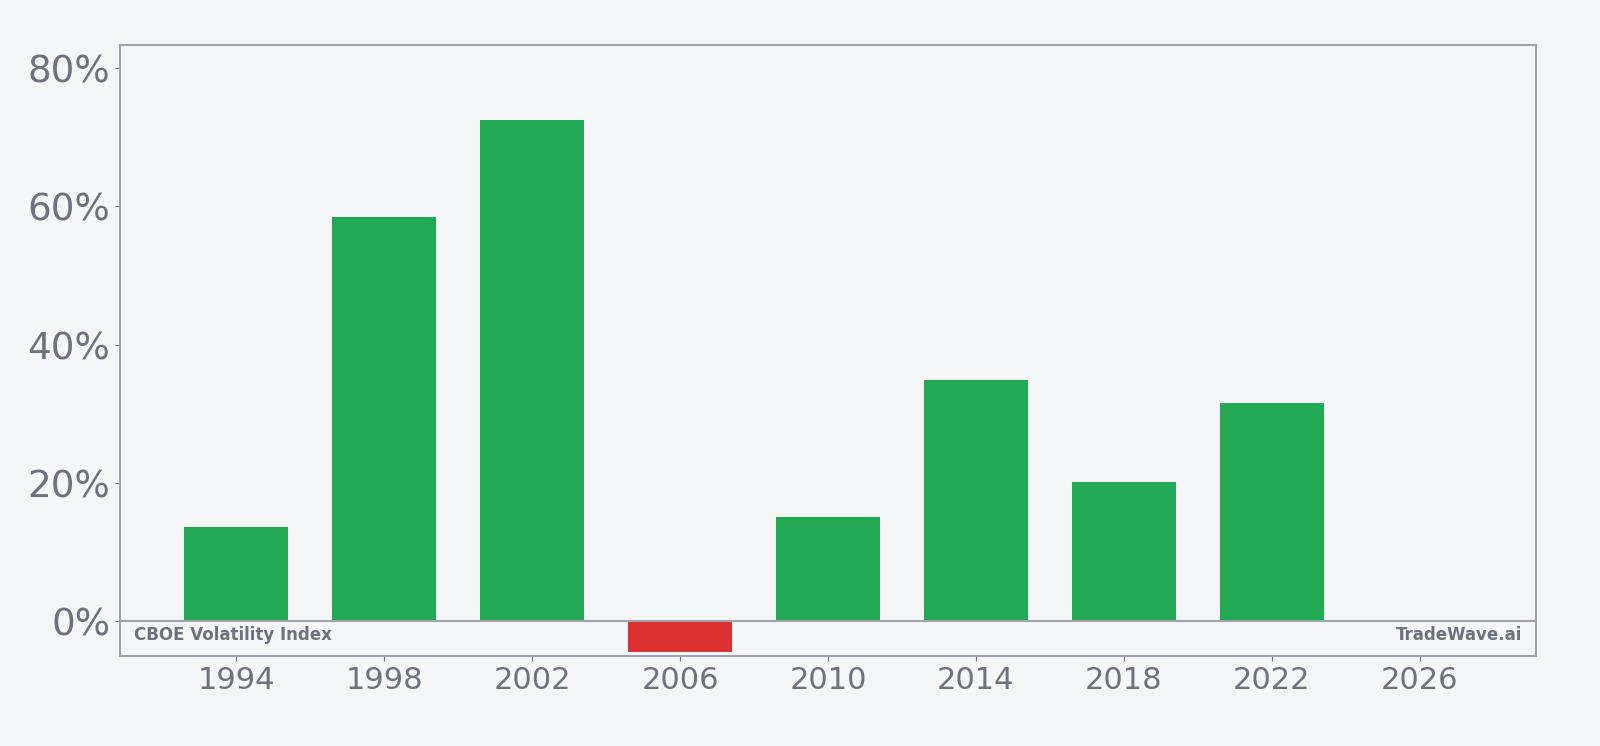
CBOE Volatility Index has risen in 7 of 8 midterm-year windows starting around Apr 21, with an average gain of 35.17% in winning years.
- 7 wins and 1 loss in this 185-day midterm-year window, with winning years averaging 35.17% gains.
- Percent Profitable sits at 88%, with 7 winners and just 1 loser across the last 8 midterm election years.
- Including the lone losing year, Avg Profit - All still comes in at a strong 30%, pointing to a persistent upside bias.
- The trade direction is long, meaning the historical pattern has favored higher VIX levels rather than volatility compression.
- Individual years have seen maximum favorable moves well above 100%, but adverse excursions have at times approached or exceeded 30% drawdowns within the window.
- A Sharpe ratio of 1.13 and a TradeWave Ratio of 1.92 suggest historically attractive risk-adjusted returns when this window has fired.
According to historical data from TradeWave.ai, this midterm-year stretch has behaved very differently from an average six-month span for volatility indices. The next section walks through how that pattern has played out in prior cycles and what it could mean for the coming months.
How has CBOE Volatility Index (VIX) behaved in past midterm-year windows?
CBOE Volatility Index has climbed in 7 of the last 8 midterm election years during the 185 trading days starting around Apr 21, with winning years averaging gains north of 35%. Today VIX closed at 28.32, down 7.5% on the session and sitting about 48.4% below its 52-week high of 54.87 while still more than doubling its 52-week low of 13.38. That combination of a strong historical seasonal tailwind and a pullback from elevated levels gives equity traders a clear volatility regime to watch as the calendar rolls into the heart of the midterm year.
The presidential election cycle matters here because this pattern only looks at midterm election years, when policy uncertainty, fiscal debates and geopolitical noise often collide. Grouping by the cycle strips out cleaner bull or pre-election years and focuses on the part of the calendar when volatility has historically had more room to run.
Trade direction for this setup is long, so higher VIX readings are the favorable outcome in the historical sample. Across the last eight midterm election years, 7 windows finished higher and only 1 ended lower, giving an 88% Percent Profitable record. Average gains in the winning years reached 35.17%, while including the single losing year still leaves Avg Profit - All at 30%, which is unusually strong for a volatility index over a roughly six-month span.
The per-year table shows how wide the range of outcomes has been. The weakest year in the sample was 2006, when the window finished down 4.4% despite a maximum favorable move of 105.44% from the entry price before volatility faded. On the other side, 2010 stands out with a net return of 15.07% but a maximum favorable excursion of 195.34%, meaning VIX nearly tripled at its peak during the window before settling back.
The historical seasonal average trend suggests that much of the upside in this window has tended to build in waves rather than in a straight line. In several years, VIX spiked early, cooled off, then re-accelerated later in the window as macro or policy shocks hit, which is consistent with how midterm years often unfold for equities and risk sentiment.
A closer look at yearly net returns alongside best and worst intraperiod swings shows how powerful and volatile this window has been.
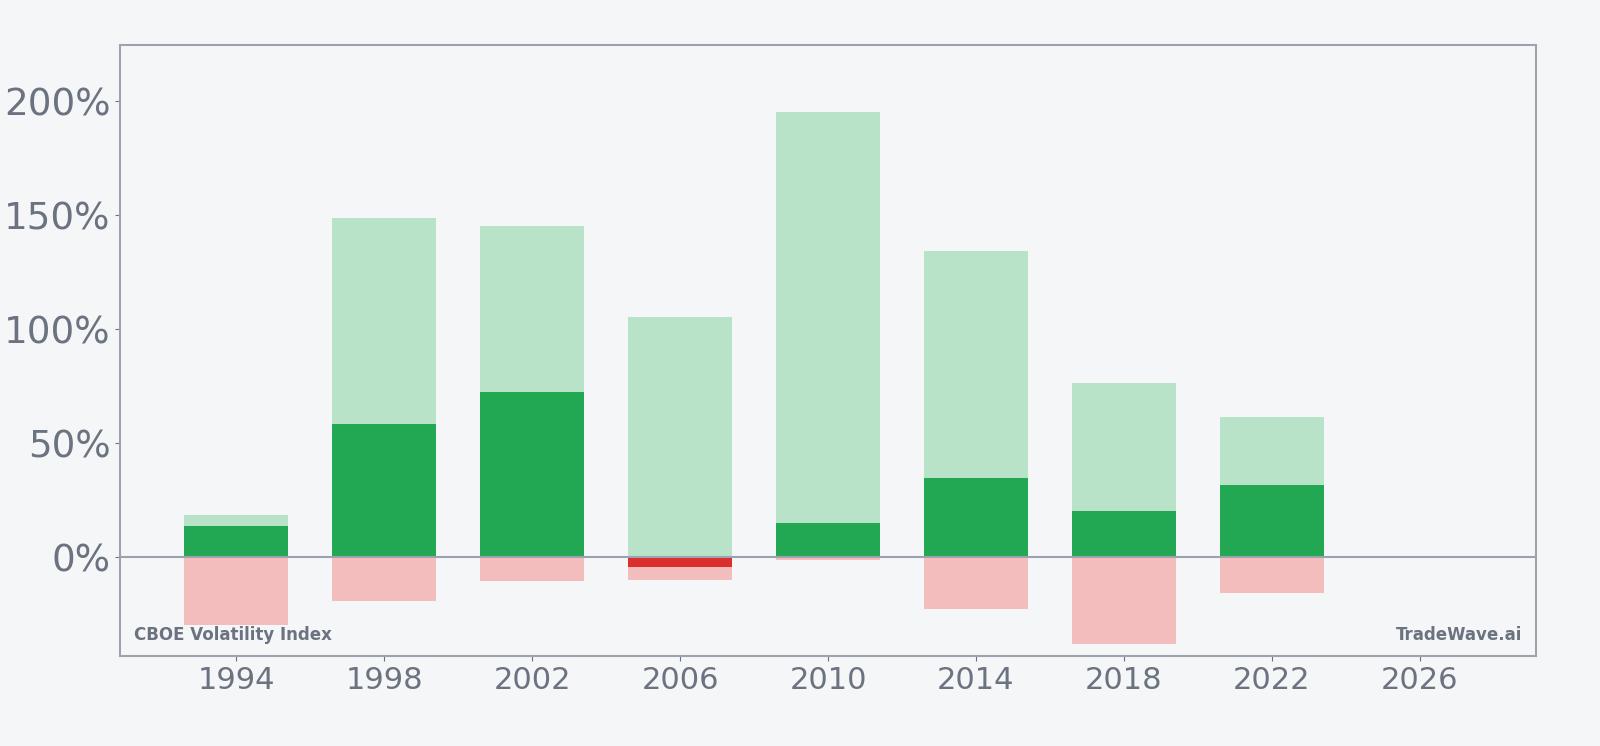
The stacked net, MFE and MAE bars underline how violent this VIX seasonal window can be. In strong years like 1998 and 2002, maximum favorable moves above 140% show how quickly implied volatility exploded from the entry point, while adverse excursions in those same years still ran into double-digit drawdowns before or after the spikes. Even the lone losing year saw a triple-digit peak run-up before VIX gave back gains, a reminder that timing inside the window has mattered as much as the final outcome.
History does not guarantee future results; adverse excursions (MAE) can be large even in winning windows.
Why does CBOE Volatility Index (VIX) follow this seasonal pattern?
This midterm-year pattern may reflect how policy risk and macro uncertainty cluster in the middle of the presidential cycle. Analysts often point to contentious budget fights, shifting regulatory agendas and geopolitical flare-ups that tend to surface as the administration’s agenda meets congressional resistance. Those episodes can drive demand for equity index options, lifting implied volatility and feeding into the VIX seasonal trend seen in this window.
What is driving CBOE Volatility Index (VIX) today?
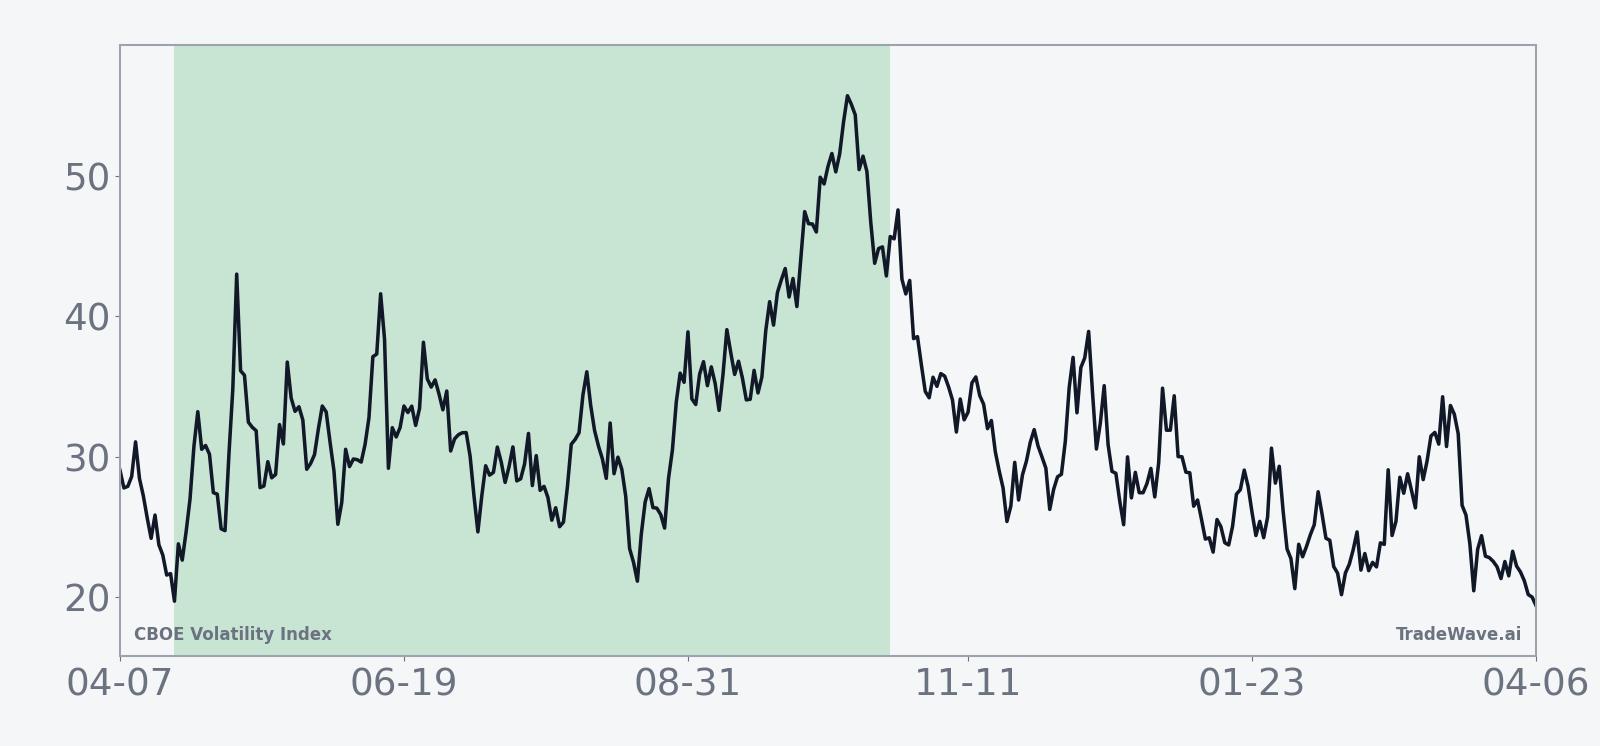
VIX dropped 2.29 points on Tuesday to 28.32, a 7.5% slide that pulled the index back from a recent spike but still left it well above its 50-day moving average of 21.53. The move comes less than two weeks after geopolitical tensions in the Middle East pushed VIX to 23.42, a jump that signaled renewed demand for downside protection across global equities as conflict headlines hit risk assets.[1] In calmer stretches, implied volatility typically compresses as stocks grind higher, but the current level suggests investors are still paying up for insurance relative to the quiet conditions seen near last year’s 13.38 low.
The chart below situates the latest move in its recent multi-month context, alongside a short-term seasonal projection.
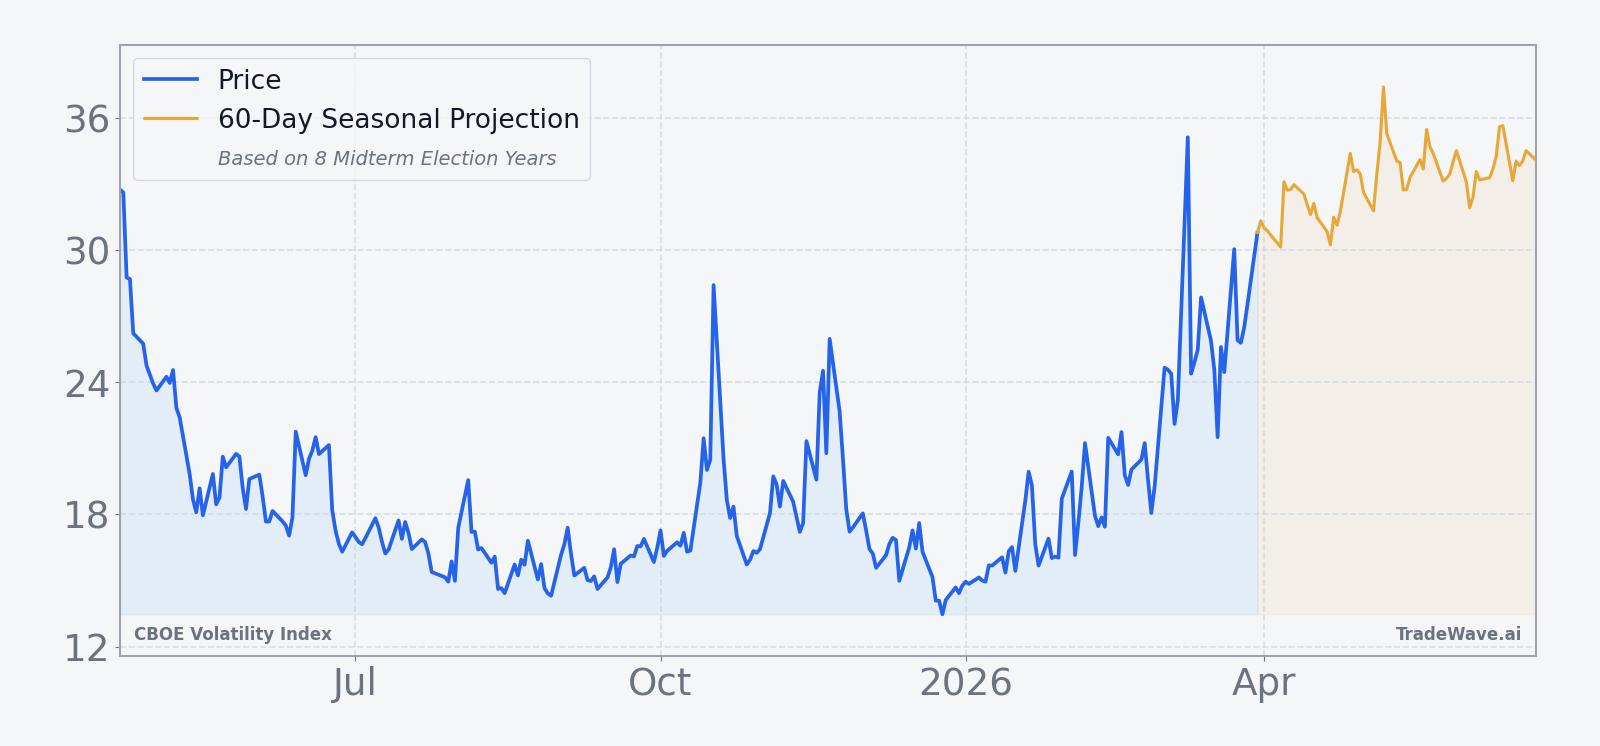
In Apr 2025, one volatility-focused strategy highlighted by Business Insider described investors using VIX options to position around trade-war and policy shocks, underscoring how quickly sentiment can flip when macro risks surface.[2] That backdrop is relevant again as markets weigh conflict risk, shifting central-bank paths and a maturing economic cycle heading into the midterm year, all of which can feed into the kind of multi-month volatility regime this seasonal window has captured in past cycles.
What should traders watch in this VIX seasonal window?
The next iteration of this 185-day window begins on Apr 21, putting the market only a few weeks away from a stretch that has historically favored higher volatility in midterm election years. The first thing to watch is whether VIX holds above its 50-day moving average or quickly sinks back toward the low teens; a sustained floor in the low-to-mid 20s as the window opens would rhyme more with prior strong years than with the lone losing one.
Macro and policy catalysts will matter just as much as levels. Budget negotiations, any surprise shifts in trade policy and further developments in the Middle East conflict could all act as triggers that push investors back into index options, reinforcing the historical pattern of sharp maximum favorable moves inside this window.[1] Conversely, a clean macro tape with steady growth and contained inflation would give equities room to grind higher and could blunt the typical VIX seasonal pop.
Traders should also monitor how intraperiod swings evolve once the window starts. In past cycles, even winning years saw sizable adverse excursions, so a deep drawdown in VIX early in the window would not automatically invalidate the pattern as long as demand for protection re-emerges later. The key tell will be whether volatility spikes are being sold aggressively or whether they hold and build into multi-week regimes, which is what drove the largest historical maximum favorable excursions.
Finally, options positioning around VIX and equity indices will be a useful cross-check. In Apr 2025, investors used VIX options to lean into volatility spikes tied to trade and policy uncertainty, a playbook that could resurface if similar risks flare during this midterm year.[2] If options flow shows persistent interest in volatility exposure as the window opens, it would align with the long-biased seasonal record; if hedging demand dries up quickly, it would be an early sign that this cycle may diverge from the historical script.
Sources
About this seasonal analysis
Seasonal pattern data is sourced from TradeWave.ai, which analyzes historical price behavior across annual calendar windows going back up to 30 years. Read the full data methodology or the book The 100-Year Pattern by Afshin Moshrefi (2026 edition). Past performance of seasonal patterns does not guarantee future results. This article is for informational purposes only and does not constitute investment advice.