Trust VIX Short-Term Futures ETF (VIXY) Has Fallen in 10 of 10 Spring Windows
Trust VIX Short-Term Futures ETF is heading toward a 60-day spring stretch that has historically punished long volatility exposure, even as traders continue to use VIXY as a tactical hedge around equity swings.

Key takeaways
- A 60-day seasonal window for Trust VIX Short-Term Futures ETF starting Apr 9 has seen VIXY fall in 10 of 10 years, a perfect record for short volatility positioning.
- The pattern is short-directed, with an average profit of 21.97% for the short side across those years and a cumulative return of 600% for the strategy.
- Percent Profitable stands at 100%, with 10 winners and 0 losers over the past decade in this specific spring window.
- The TradeWave Ratio of 3.02 suggests VIXY typically travels meaningfully in the trade direction within the window, even before final outcomes are booked.
- Intraperiod swings have been large, with some years showing maximum favorable moves above 25% and maximum adverse excursions deeper than 30%, underscoring the volatility of volatility.
- For equity investors using VIXY as a hedge, this history points to a window where carry costs on long volatility have often been steep.
According to historical data from TradeWave.ai, this upcoming spring stretch has behaved very differently from an average month for VIXY. The next section walks through what that pattern has looked like in prior years and how it frames the backdrop for volatility traders heading into April.
Seasonal window
Trust VIX Short-Term Futures ETF has delivered winning short trades in all 10 of the past years during this 60-day spring window, with an average profit of 21.97% for the short side. The next iteration of that window begins on Apr 9 and runs for roughly two months, a period when VIXY has often bled lower as equity markets stabilized or rallied. For traders who lean on VIXY as a hedge, that combination of a perfect 10-for-10 record and double-digit average declines has made this slice of the calendar one of the most punishing times to be long volatility.
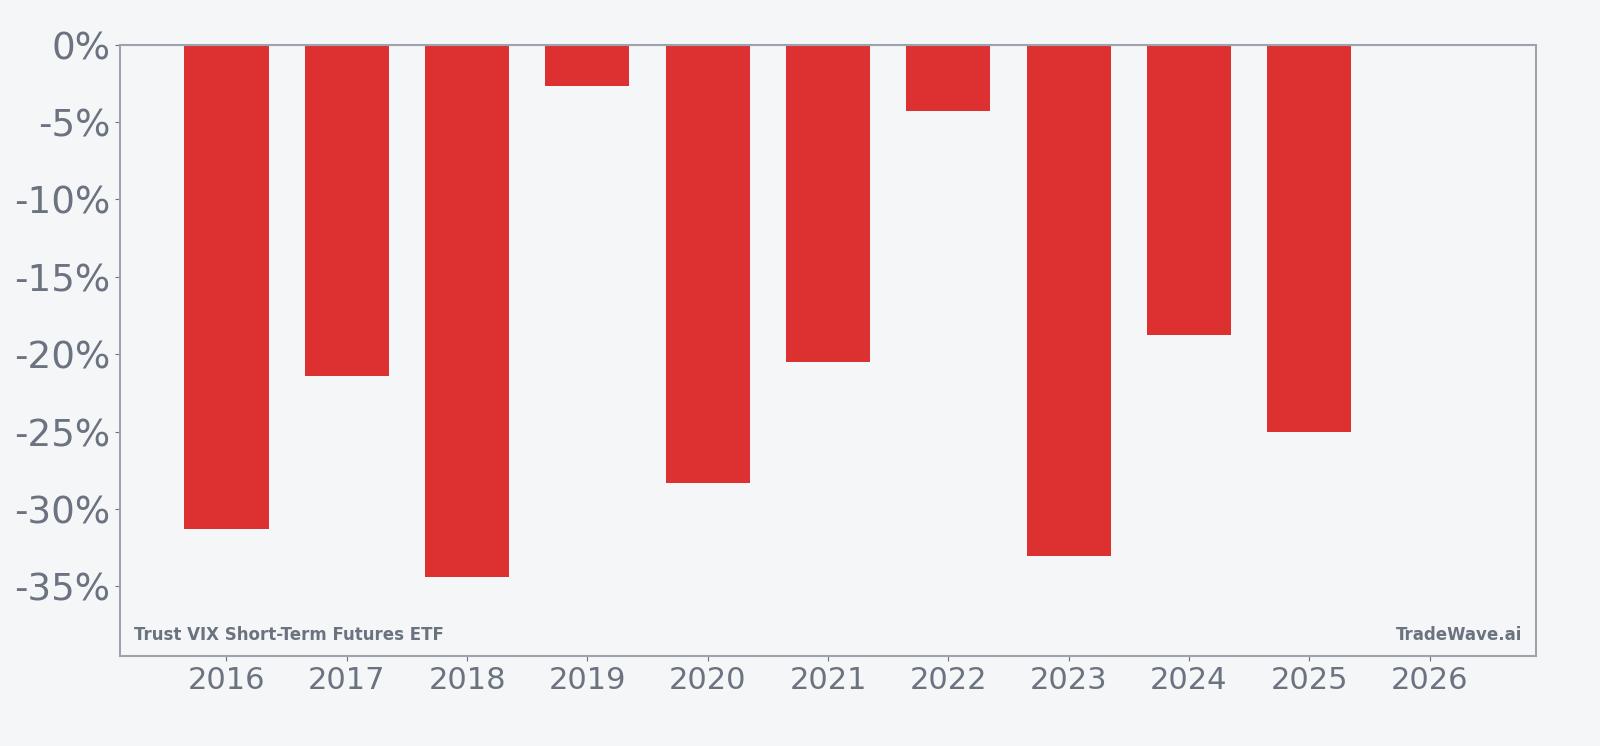
Historically, this 60-day stretch has been a cleanly bearish period for VIXY itself but a favorable one for traders positioned short the ETF or long equities against it. Across the decade-long sample, the strategy of shorting VIXY at the start of the window and covering at the end produced a cumulative return of 600%, with annualized returns of 21.49%. The median outcome for the short side was a 23.2% gain, which lines up closely with the average, suggesting the pattern has not been driven by a single outlier year.
The per-year breakdown shows how consistent that pressure has been. The weakest year for the short strategy was 2019, when VIXY slipped only 2.66% over the window, while the strongest years saw declines north of 30% for the ETF, including 2016, 2018 and 2023. In each case, the net return for the short side was positive, but the path to that outcome varied, with some years featuring early spikes in volatility before the decay phase took over.
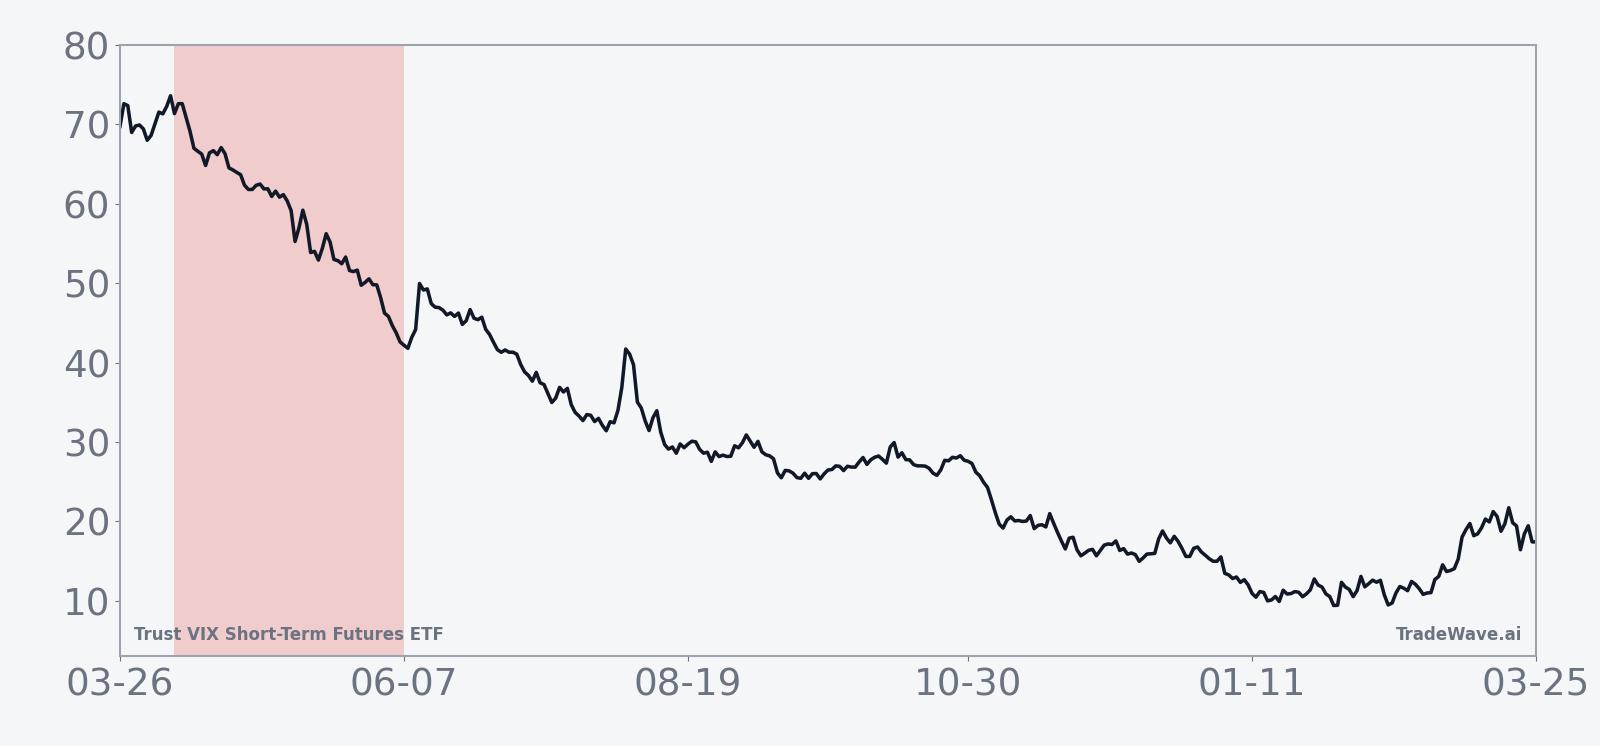
The historical seasonal average trend for this window slopes steadily lower, with much of the typical decline accruing in the middle third of the period. Early days often show choppy action as volatility reacts to lingering macro headlines, followed by a more persistent grind lower as realized volatility fades and the futures curve reasserts its usual contango. Late in the window, the average path flattens, reflecting a tendency for the easy part of the move to be over by then.
A stacked view of net returns alongside peak favorable and adverse moves highlights how far VIXY has tended to swing inside the window before settling at its final level.
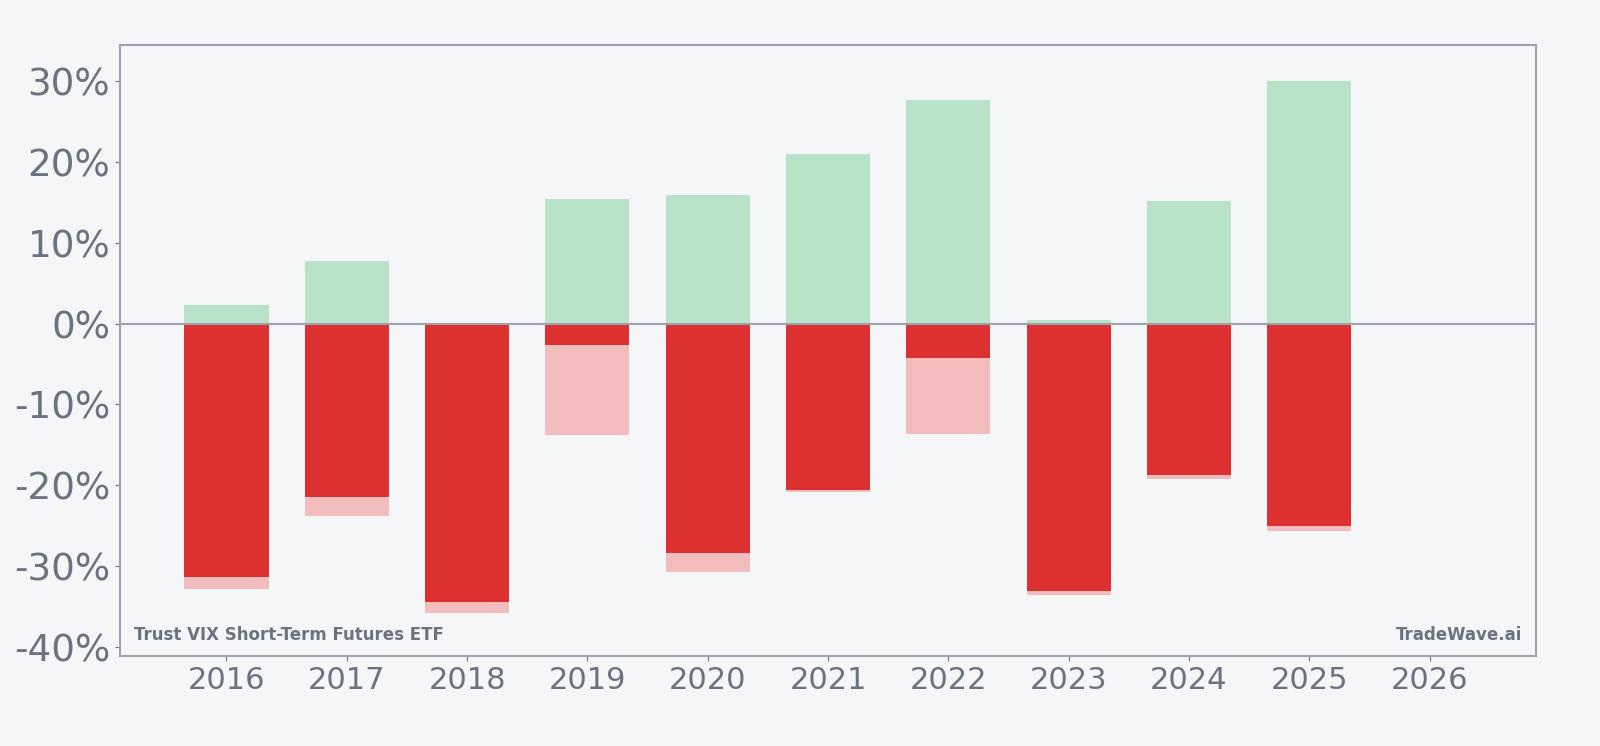
The maximum favorable excursion profile shows that in several years, including 2021, 2022 and 2025, VIXY rallied more than 20% at some point during the window before ultimately finishing lower. On the flip side, maximum adverse excursions for the ETF itself, which correspond to the best intraperiod gains for the short side, reached beyond 30% in years like 2016, 2018 and 2023. That combination of large positive and negative swings inside a window that still finished lower every time underscores how volatile the path can be even when the final direction has been consistent.
History does not guarantee future results; adverse excursions can be large even in winning windows, and traders using this pattern still face the risk of sharp volatility spikes along the way.
Price and near-term drivers
Trust VIX Short-Term Futures ETF is designed to track a rolling position in short-term VIX futures, giving investors a liquid way to express views on equity volatility rather than on the S&P 500 itself. Because the fund holds futures instead of spot VIX, its day-to-day moves reflect both changes in implied volatility and the cost of rolling exposure along the curve, which is often in contango and can steadily erode the value of long positions. That structural drag is a key reason VIXY has historically struggled during calmer stretches for equities, especially when realized volatility drifts lower after a shock.
Flows into and out of VIXY tend to spike around macro events such as Federal Reserve meetings, inflation releases and geopolitical shocks, as investors reach for protection or unwind hedges. In quiet periods, assets under management can shrink as traders rotate back into risk assets and no longer feel the need to pay for volatility insurance. The upcoming 60-day window sits squarely in the heart of the spring data calendar, when earnings season, central bank communication and the first look at midyear growth expectations can all influence how much protection investors want to carry.
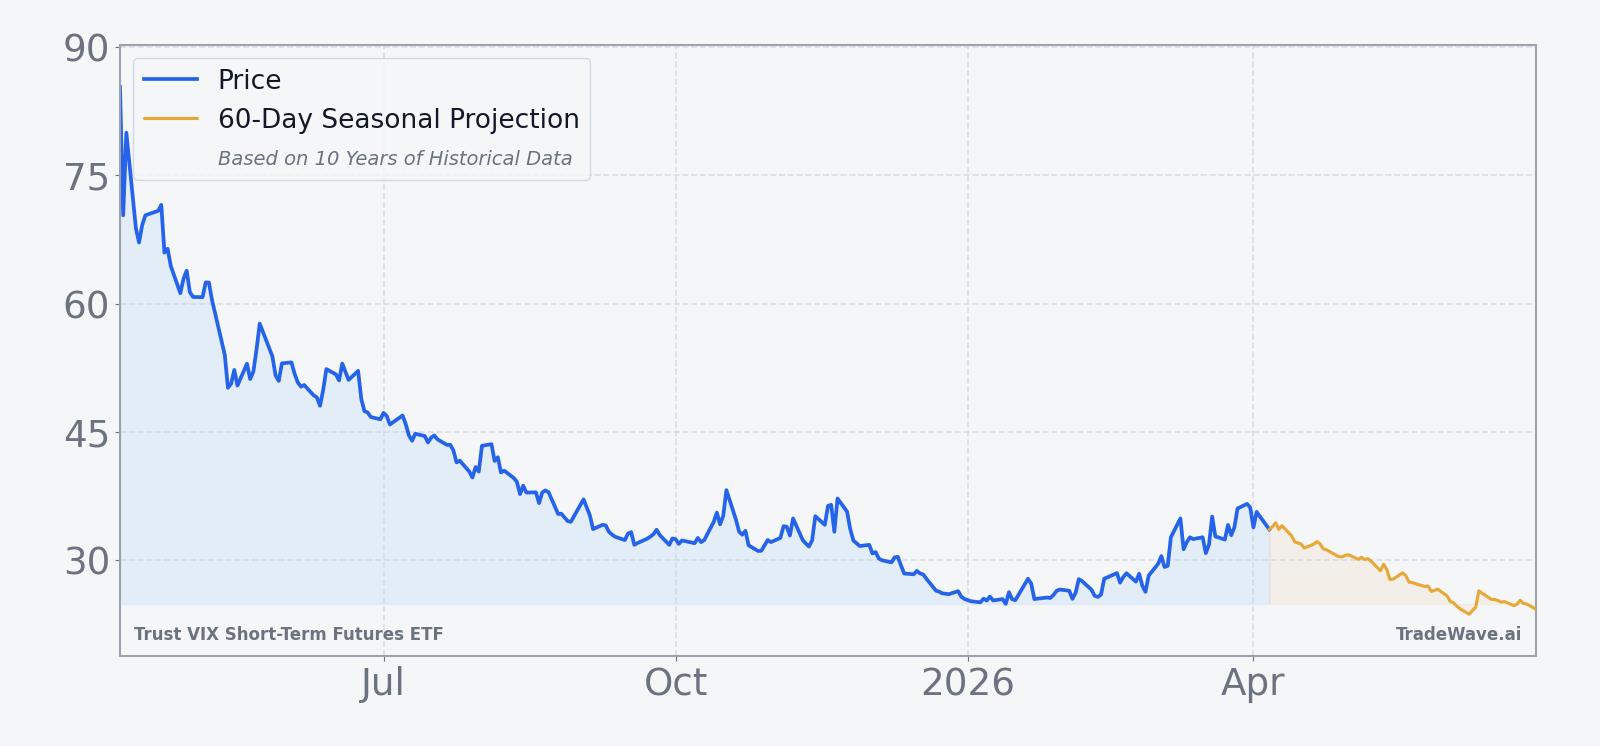
The chart below situates VIXY’s recent behavior against its 12‑month history and overlays the upcoming 60‑day seasonal projection.
Macro backdrop and exposure
VIXY’s performance is tightly linked to the behavior of the Cboe Volatility Index and, by extension, to swings in the S&P 500. When equities grind higher in a low-volatility regime, the VIX futures curve typically slopes upward, and the cost of rolling long exposure from cheaper front-month contracts into pricier back-month contracts weighs on VIXY. In contrast, during equity sell-offs, the curve can invert, and VIXY can spike as both spot VIX and near-term futures surge.
Because of that structure, VIXY is often used as a short-term tactical tool rather than a buy-and-hold investment. Many institutional desks and active traders will pair VIXY with S&P 500 futures or broad equity ETFs, using it as a hedge that can be dialed up or down around key risk events. The historical spring pattern suggests that, on average, this is a period when those hedges have decayed in value, rewarding investors who were willing to run lighter protection or even lean short volatility once the immediate shock phase passed.
Tracking error is another consideration. VIXY does not track spot VIX directly but a basket of short-term futures, so its moves can diverge from the headline index, especially when the curve is steep. Fees and the daily rebalancing process also contribute to performance drag over time. For traders looking at the seasonal window, the key is that these structural headwinds have tended to line up with a calmer macro backdrop in prior years, amplifying the downside bias for the ETF during this specific 60‑day stretch.
What to watch as the window opens
The upcoming spring window for VIXY is less than two weeks away, and the historical record is unusually one-sided. For traders, the first thing to watch is how equity markets behave into early April. If stocks remain firm and realized volatility stays contained, the backdrop will look similar to prior years when VIXY drifted lower throughout the window. A sudden equity shock or policy surprise, by contrast, could produce one of the large intraperiod rallies that have shown up in the maximum favorable excursion data, even if the ETF ultimately resumes its typical decay.
Flows into VIXY will be another key tell. Heavy inflows around early earnings reports or macro events would signal that investors are paying up for protection again, which can fuel short-term spikes in the ETF even in a seasonally weak period. Light or negative flows would suggest that investors are comfortable running with less hedge, which historically has lined up with smoother downside paths for VIXY during this window.
Finally, traders should keep an eye on the shape of the VIX futures curve as Apr 9 approaches. A steep contango has historically coincided with some of the largest adverse excursions for VIXY itself, which translated into the strongest gains for the short side. A flatter or inverted curve would point to a more fragile environment where volatility can stay elevated for longer, increasing the odds that this iteration of the window deviates from the 10‑for‑10 pattern. The history is clear, but how VIXY trades through this spring will depend on whether the macro backdrop cooperates with that script or challenges it.