Volatility Picks Up in Trane Technologies (TT) as Midterm Spring Weakness Window Approaches
Trane Technologies is heading into an 11-day midterm-year stretch that has usually leaned lower, just as the stock trades off recent highs and volatility picks up.

Key takeaways
- An 11-day seasonal window for Trane Technologies tied to midterm election years begins on Mar 20 and has historically favored downside moves.
- Across the last 10 midterm cycles, the pattern finished profitable for shorts in 9 years and unprofitable in 1 year, a 90% hit rate.
- Average gains in winning short years were 3.47%, while including the lone losing year brings the all-years average to 3% in favor of the short side.
- The Trade Direction is short, with a TradeWave Ratio of 2.01 and a Sharpe ratio of 1.07, pointing to a historically efficient bearish window.
- Intraperiod swings have been meaningful, with several years showing sharp favorable drops but also notable adverse rallies before the move played out.
- TT is trading at 421.50, about 12.1% below its 52-week high, after a 9.41% slide over the past month, which could interact with this historically weak stretch.
According to historical data from TradeWave.ai, this upcoming midterm-year window for Trane Technologies has behaved very differently from an average month on the calendar, and the next iteration is only days away.
Seasonal window
Trane Technologies has delivered profitable short trades in 9 of the last 10 midterm election years during this 11-day March window, with average winning moves of 3.47%. The new window begins on Mar 20 and runs through the start of April, with TT currently at 421.50 after a 9.41% one-month drop and sitting about 12.1% below its 52-week high of 479.37. That combination of a historically bearish slice of the calendar and a stock already backing off highs gives traders a clean test of whether this midterm pattern still matters.
The pattern groups only midterm election years, not consecutive calendar years, which matters for a name like Trane that is tied to industrial spending, construction cycles and policy-driven infrastructure demand. Midterm years often bring budget fights and regulatory noise that can hit capital spending plans, and this window sits in the early part of that phase, before the typical pre-election-year tailwind kicks in.
Historically, this window has been defined by steady downside rather than violent crashes. The median profit for shorts is 2.33%, and the all-years average of 3% suggests that even when the pattern has not produced outsized drops, it has still tended to lean in favor of the short side. The lone losing year in the sample, 2022, saw TT rise 1.45% over the window, which clipped shorts but did not fully erase the broader pattern.
Looking at individual years, some of the strongest short outcomes came in 2002 and 2018, when TT fell 8.32% and 6.53% respectively over the 11-day span. In those years, the maximum favorable move from entry reached 0.22% and 1.27%, while the worst intraperiod rallies against the short position, the maximum adverse excursions, stretched to 8.77% and 7.9%. That profile shows how the stock has sometimes squeezed higher before ultimately breaking lower by the close of the window.
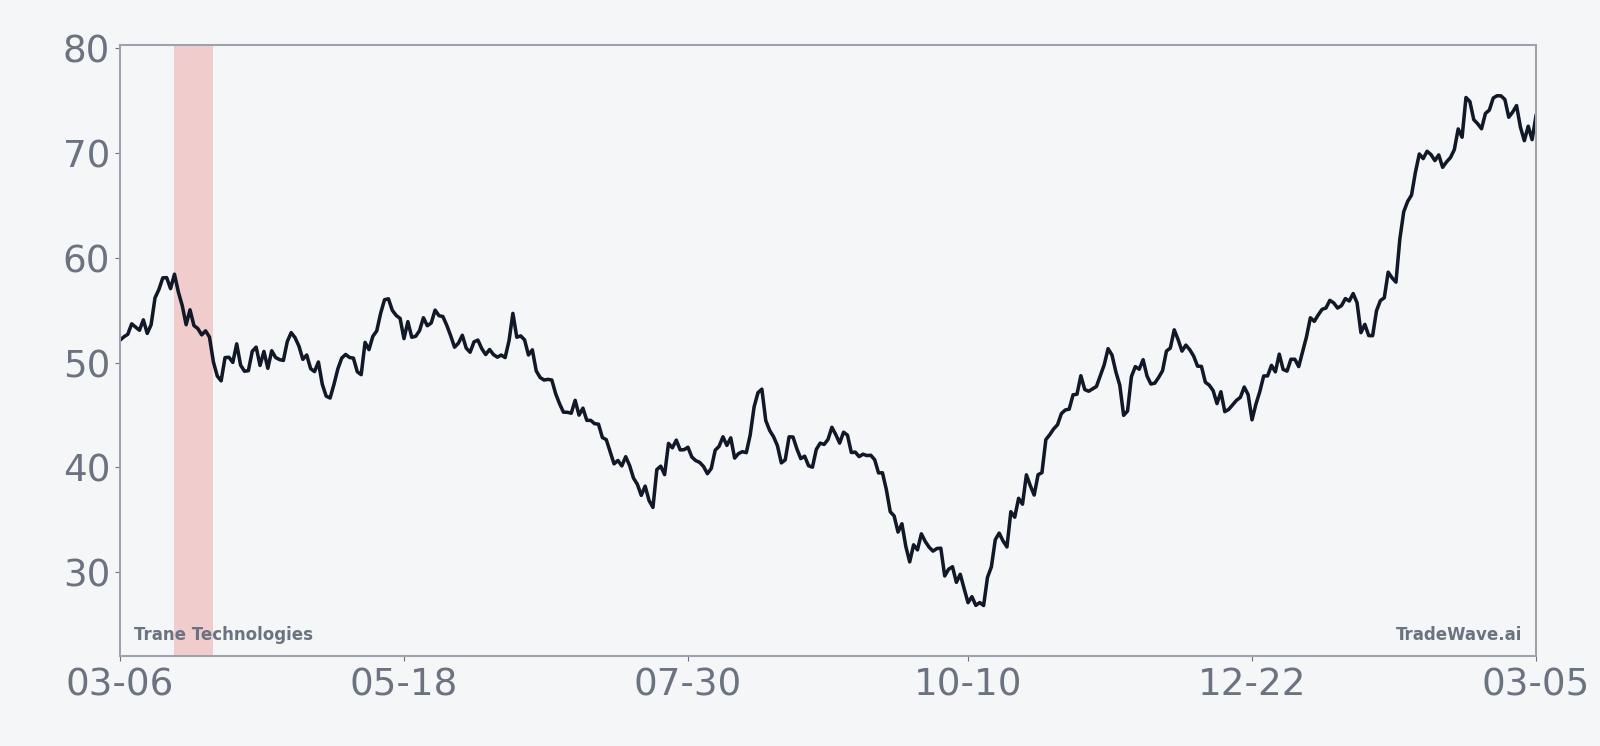
The historical seasonal trend chart shows a fairly consistent downward drift across the window, with much of the move often occurring in the middle days rather than right at the start. That timing nuance matters for traders who might otherwise expect an immediate reaction on day one of the window.
The bar chart of yearly net returns, alongside peak favorable and adverse moves, highlights how often shorts have worked and how large the swings have been inside the window.
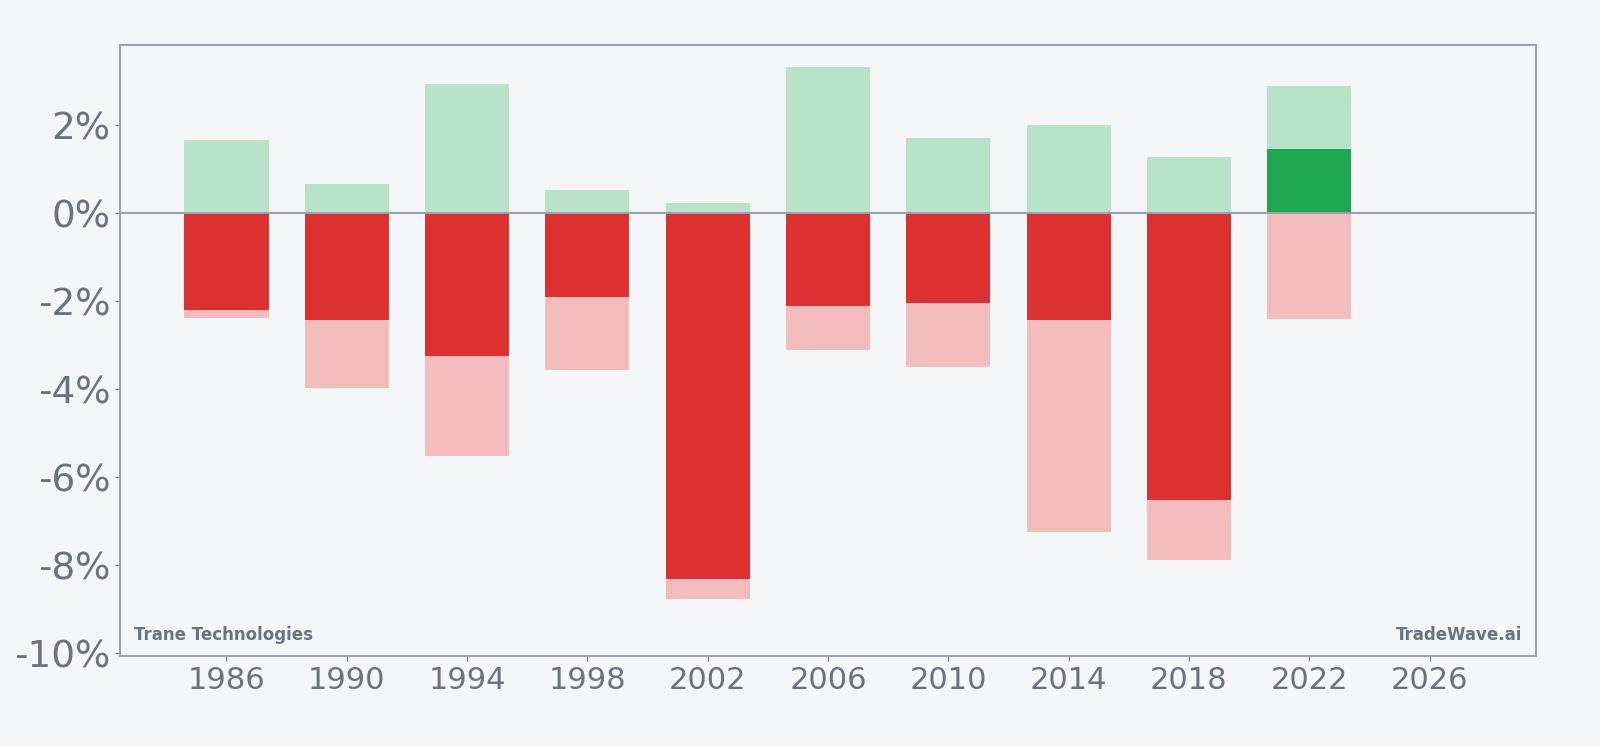
The stacked net, maximum favorable and maximum adverse excursions show a window that has usually rewarded patience on the short side but has not been free of pain. Several years feature adverse rallies of 3% to 7% before the stock rolled over, which lines up with the TradeWave Ratio of 2.01 and a Sharpe ratio above 1. In plain English, when this window has moved, it has tended to move far enough in the trade direction to compensate for the volatility along the way.
History does not guarantee future results; adverse excursions can be large even in winning windows, and traders should size positions with that downside in mind.
Price and near-term drivers
Trane Technologies closed Monday at 421.50, down 0.21% on the day, extending a one-month slide of 9.41% from recent highs. The stock is about 12.1% below its 52-week peak of 479.37 and still well above its 52-week low of roughly 294.13, leaving it in a cooling but intact longer-term uptrend. Average 20-day volume sits near 1.2 million shares, and Monday’s turnover of roughly 1.54 million shares suggests interest is picking up as the stock backs away from its highs.
There is no single earnings or macro headline driving the latest pullback in the data provided, which makes the timing of the seasonal window more interesting. TT has been a beneficiary of multi-year spending on HVAC efficiency, building retrofits and climate-focused infrastructure, themes that tend to be sensitive to both interest rates and policy support. In a midterm election year, those policy levers can become less predictable as lawmakers jockey over budgets and climate-related incentives, and that uncertainty has often translated into choppier trading for industrial names.
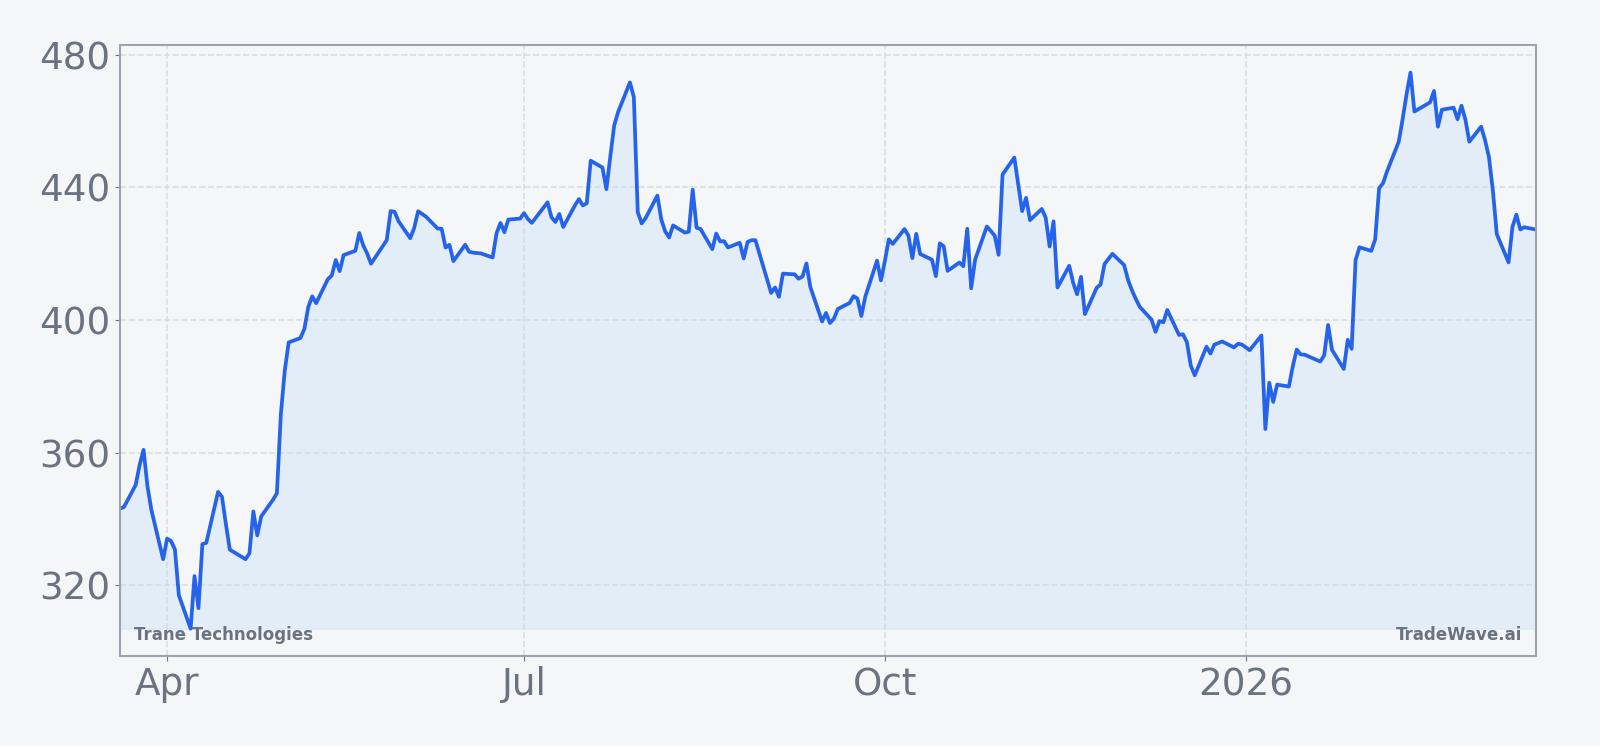
From a technical perspective, TT is hovering just below its 50-day simple moving average of about 425.63, a level it has used as support during prior pullbacks. A sustained break below that band during the upcoming window would fit the historical pattern of midterm-year weakness. A quick reclaim of the 50-day and a push back toward the 52-week high would look more like the 2022 outlier, when the short pattern failed and the stock squeezed higher instead.
The chart below situates the latest move in its recent multi-month context.
What to watch as the window opens
The 11-day midterm-year window for Trane Technologies starts on Mar 20, and the first thing to watch is how the stock behaves around the 50-day moving average. A clean break lower with expanding volume would rhyme with the historical pattern of mid-window weakness, especially if the move accelerates in the middle of the span rather than on day one.
Second, keep an eye on the size of intraperiod rallies against any emerging downside trend. In prior years, shorts have often had to sit through 3% to 7% squeezes before the trade worked, so a sharp bounce inside the window does not automatically invalidate the seasonal tendency. What would contradict the pattern is a sustained push back toward the 52-week high that leaves the stock higher at the end of the 11 days, similar to the 2022 outlier.
Finally, monitor the broader policy and rates backdrop as the midterm year unfolds. Any shift in expectations around infrastructure spending, building efficiency mandates or financing costs for large projects could either reinforce or blunt the usual midterm-year wobble for industrials. For TT, the upcoming window is less about a guaranteed move and more about a historically noisy stretch where direction has tended to favor the short side, and where intraperiod swings have been large enough to matter for position sizing.