S&P 500 Healthcare Sector SPDR (XLV) Has Rallied in 14 of 15 May-July Windows
S&P 500 Healthcare Sector SPDR is approaching a 74-day spring–summer window that has delivered gains in almost every year, just as the ETF emerges from a powerful sector rally and faces fresh policy risk.

What is the seasonal pattern for S&P 500 Healthcare Sector SPDR (XLV)?
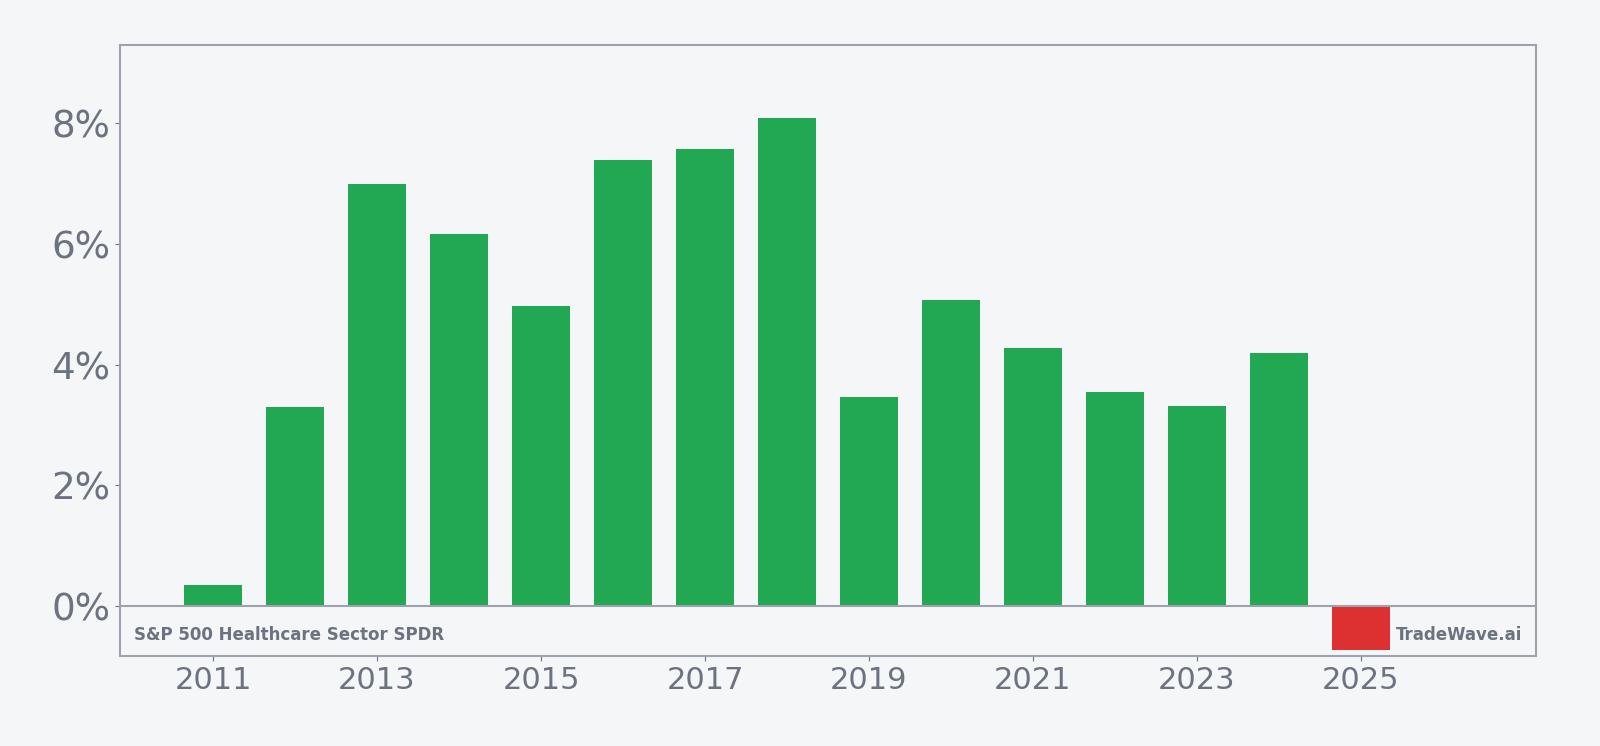
S&P 500 Healthcare Sector SPDR has risen in 14 of 15 years during this May–July window, with an average gain of 4.91% in winning years.
- 14 for 15 in this window, with winning years averaging 4.91% gains over the 74-day stretch.
- Percent Profitable stands at 93%, with 14 winners and just 1 loser across the 15-year lookback.
- Including the lone down year, Avg Profit - All is still 5%, underscoring a strong bullish XLV seasonal trend.
- The trade direction is long, supported by a Sharpe ratio of 1.47 and a TradeWave Ratio of 2.99 that points to meaningful directional travel inside the window.
- Intraperiod swings have featured sizable drawdowns in some years, so maximum adverse moves have at times been several percentage points even when the window finished higher.
- The upcoming 74-day S&P 500 Healthcare Sector SPDR trading window begins on May 9, 2026 and runs into mid-July, overlapping a period that has often seen healthcare leadership within the broader market.
According to historical data from TradeWave.ai, this specific late-spring window in XLV has behaved very differently from an average calendar slice, with a clear directional bias that most investors never see quantified.
How has S&P 500 Healthcare Sector SPDR (XLV) traded in this May–July window?
S&P 500 Healthcare Sector SPDR has posted gains in 14 of the past 15 years during the 74-day window that starts on May 9, averaging 4.91% in winning years. Today the ETF sits between its 52-week low near 123.94 and its 52-week high at 160.59, after a one-month pullback of 2.27% that follows a much larger rally off last year’s lows.[1] That combination of a strong historical season and a market that has cooled slightly from overbought conditions sets up a clean test of whether healthcare’s recent breakout has more room to run.
Historically this has been a long-biased window for XLV. The trade direction is long, and the pattern’s Percent Profitable of 93% means only one year in the 15-year sample finished lower. That lone down year, 2025, saw a modest 0.73% loss despite a maximum favorable move of 4.32% and a maximum adverse move of 4.02%, showing that even the “bad” year did not feature a collapse.
Average winner gains of 4.91% compare with an Avg Profit - All of 5%, which tells you that the single losing year has not dragged down the overall profile. Median Profit of 4.27% sits close to the average, suggesting the typical outcome is a mid-single-digit advance rather than a pattern dominated by one or two outliers. The annualized return of 4.5% for this specific slice of the calendar is notable for a defensive sector ETF.
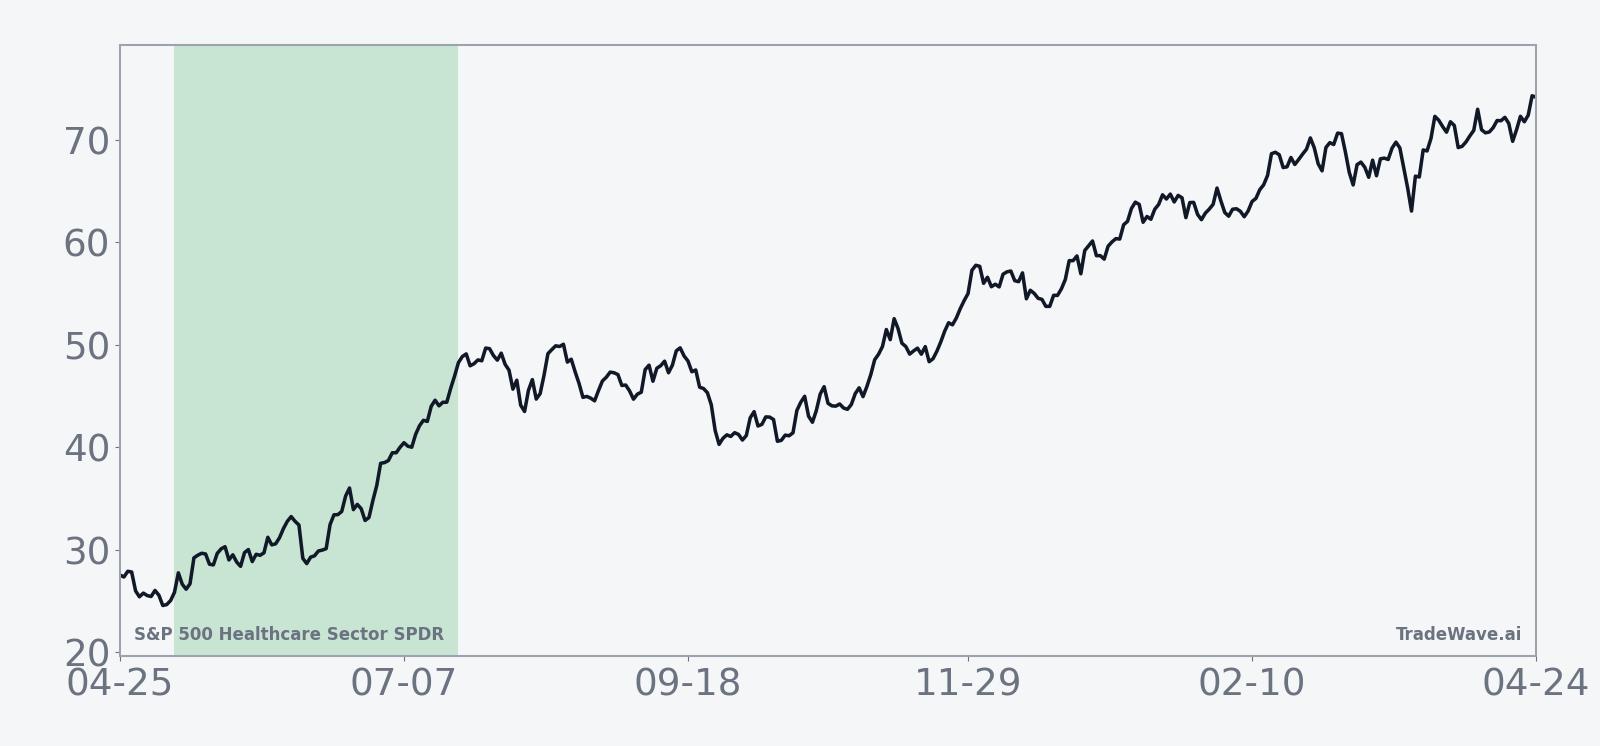
The historical seasonal average trend shows gains that tend to build steadily through the middle of the window rather than spiking only at the end. In several years, including 2016, 2017 and 2018, XLV logged net returns between about 7% and 8%, with maximum favorable moves slightly higher, which lines up with that smooth upward profile. Later years such as 2020 and 2024 also delivered 4% to 5% net gains despite bouts of volatility inside the window.
Year-by-year bars that combine net results with peak run-ups and worst drawdowns show how much XLV has typically moved inside this window before settling at the final outcome.
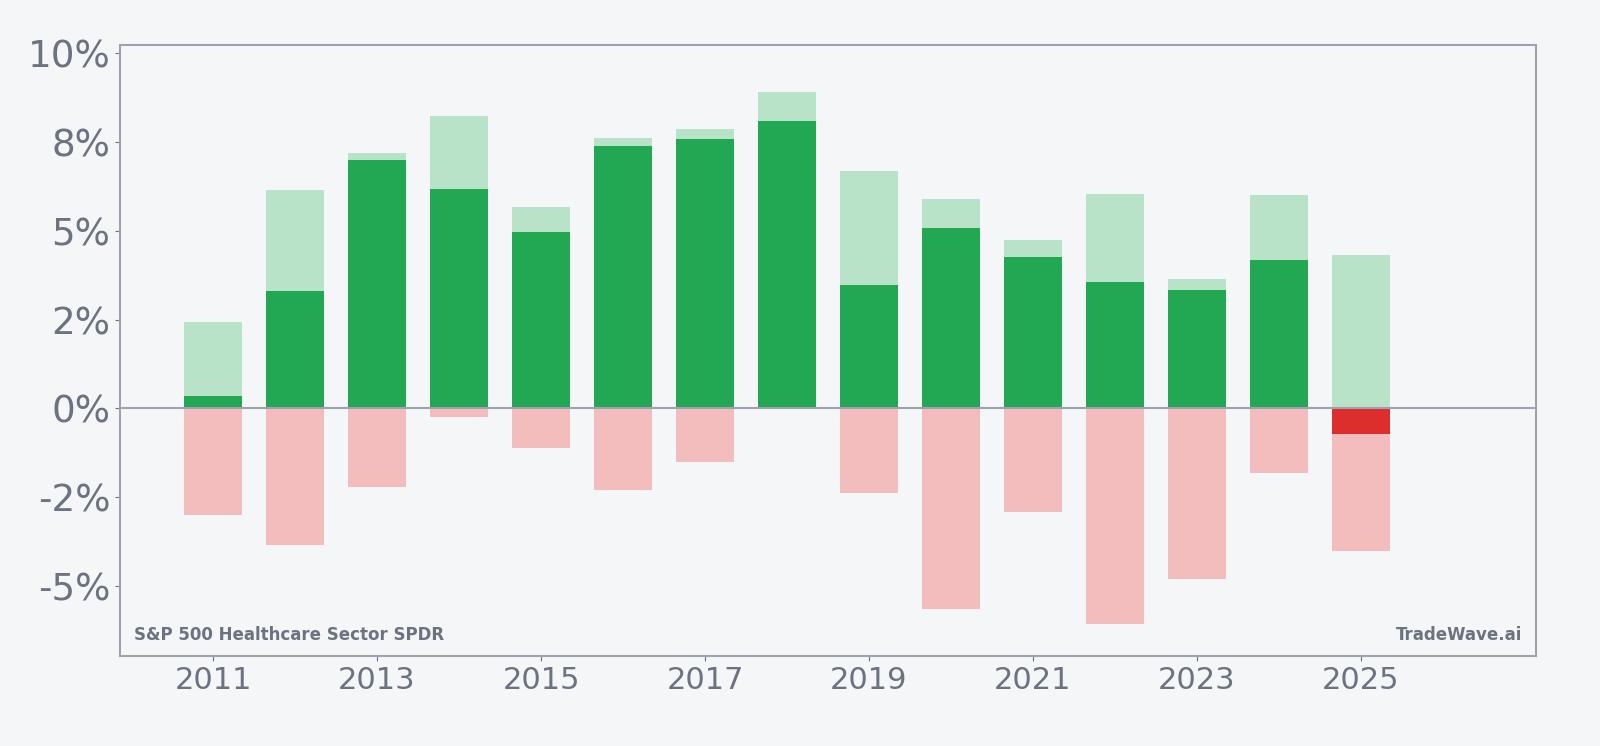
The maximum favorable excursions in strong years often ran ahead of the final net result, with several seasons showing 6% to nearly 9% peak gains before giving back a bit into the close of the window. On the downside, maximum adverse moves have ranged from shallow pullbacks of around 1.5% to deeper drawdowns of roughly 6% in years like 2020 and 2022, even though those windows still finished positive. That mix of solid upside and occasional mid-window shakeouts is consistent with a TradeWave Ratio of 2.99, which signals that XLV typically travels a meaningful distance in the trade direction during this stretch.
The pattern is clear: this window has favored longs in 14 of 15 years, with mid-single-digit gains the norm and volatility that has usually been a detour rather than a destination.
Why does S&P 500 Healthcare Sector SPDR (XLV) follow this seasonal pattern?
One likely driver is the healthcare earnings and policy calendar, which often clusters key drug trial updates, reimbursement decisions and managed-care commentary in late spring and early summer. Analysts have also pointed to institutional portfolio repositioning as investors rotate into defensive growth sectors like healthcare after the first-quarter reporting season. The pattern may further reflect sector rotation away from early-year winners in more cyclical groups, leaving room for XLV to quietly outperform into mid-year.
History does not guarantee future results; adverse excursions can still be sizable inside the window even when the final outcome is positive.
What is driving S&P 500 Healthcare Sector SPDR (XLV) today?
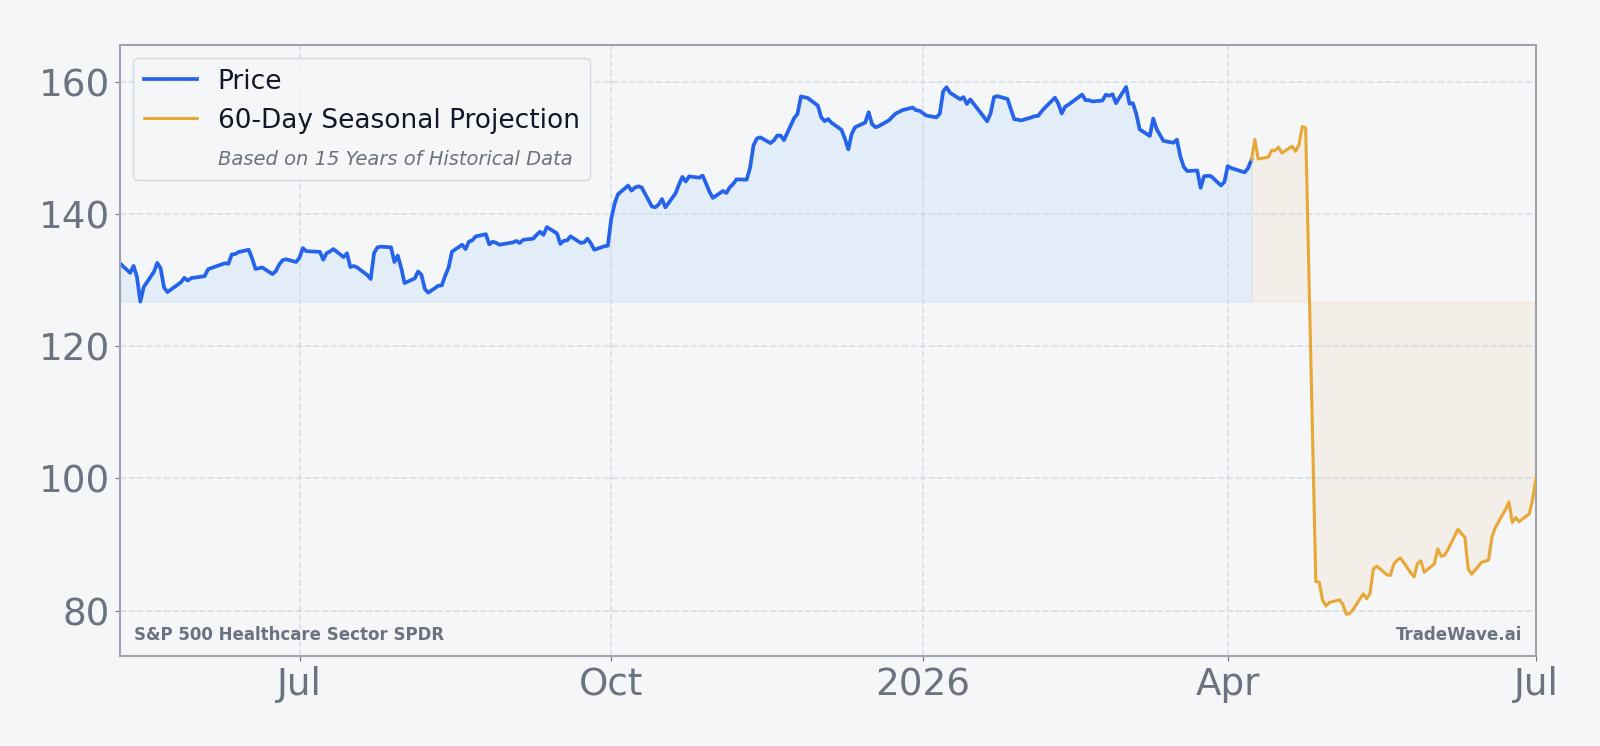
XLV has pulled back about 2.27% over the past month after a powerful advance that left the ETF roughly 29.7% above its 52-week low near 123.94 and within sight of its 52-week high at 160.59.[1] That cooling comes after a roughly 25% surge off an August low, a move that put healthcare back in the leadership column after a long stretch of underperformance versus the broader market.[1] At the same time, macro commentary has flagged potential overbought conditions in the sector, raising the odds of short-term consolidation even as the longer-term trend remains constructive.[1]
The chart below shows XLV’s breakout from last year’s base, the recent pullback, and a 60-day seasonal projection overlay for context.
Under the hood, the S&P 500 Healthcare Sector SPDR tracks large-cap U.S. healthcare names, with heavy exposure to pharmaceuticals, managed care, medical devices and biotech. Sector commentary notes that XLV has led recent healthcare gains after breaking out from a period of underperformance, helped by renewed interest in defensive growth and stable cash flows.[1] That leadership sits against a backdrop of renewed regulatory focus on big pharma, including high-profile political rhetoric about drug pricing that could inject headline risk into the group later this year.[2]
Flows data for XLV are sparse in the latest snapshot, but the combination of a strong price run, elevated 20-day average volume around 14.46 million shares, and a 50-day moving average near 152.61 suggests the ETF has attracted steady institutional participation.[1] With price action consolidating near that moving average after a long climb, the upcoming seasonal window will test whether buyers are willing to add exposure into any dips or whether macro and policy worries start to dominate the tape.
What should traders watch as XLV enters this seasonal window?
For traders tracking XLV’s historical seasonality, the first checkpoint is how the ETF behaves as the May 9 window opens. In prior years, stronger seasons often saw early or mid-window rallies that pushed maximum favorable moves well ahead of the final net gain, so a quick push higher in late May or June would be consistent with the established pattern. Conversely, a deeper and more persistent drawdown than the typical 2% to 6% intraperiod pullback would signal that macro or policy forces are overpowering the usual spring–summer tailwind.
On the macro side, watch for fresh headlines around drug pricing and healthcare regulation, which have periodically rattled big pharma and managed-care names inside XLV.[2] Any renewed “ultimatum” tone toward large drugmakers could weigh on the ETF even if the broader seasonal backdrop remains supportive. At the same time, if healthcare continues to act as a relative-strength leader during broader market wobbles, that would reinforce the idea that institutional investors are leaning into the sector as a defensive growth anchor.
Key technical levels include the 50-day moving average near 152.61 and the 52-week high at 160.59.[1] Holding above the moving average and making a sustained push toward or through the high during the window would line up with the historical pattern of mid-single-digit gains. A decisive break below the moving average, especially if accompanied by heavier-than-normal volume, would argue that this cycle’s May–July stretch may diverge from the usual script.
Finally, because XLV is a sector ETF built on large-cap healthcare stocks, traders should monitor how its performance stacks up against the broader S&P 500. Outperformance during the window would echo the historical seasonal bias and suggest that healthcare is reclaiming a leadership role. Underperformance, particularly if tied to policy shocks, would be a clear sign that this time may be different despite the strong track record of the window.
Sources
About this seasonal analysis
Seasonal pattern data is sourced from TradeWave.ai, which analyzes historical price behavior across annual calendar windows going back up to 30 years. Read the full data methodology or the book The 100-Year Pattern by Afshin Moshrefi (2026 edition). Past performance of seasonal patterns does not guarantee future results. This article is for informational purposes only and does not constitute investment advice.