6-for-6 Midterm Run: S&P 500 Healthcare Sector SPDR (XLV) Averages 9.18% Gains
S&P 500 Healthcare Sector SPDR is nearing a midterm-year seasonal window that has never lost in this sample, even as the ETF trades below its 52-week high and options traders lean bullish.

What is the seasonal pattern for S&P 500 Healthcare Sector SPDR (XLV)?
S&P 500 Healthcare Sector SPDR has risen in 6 of 6 midterm-year windows starting around Jul 11 and lasting 155 days, with an average gain of 9.18% in winning years.
- 6 for 6 in this midterm-year window, with winning years averaging 9.18% gains over 155 trading days.
- Percent Profitable is 100%, with 6 winners and 0 losers across the last six midterm election years.
- The upcoming window begins Jul 11, 2026 and runs roughly through early February, covering a key stretch from late midterm year into the pre-election ramp.
- Average gains cluster around a 9.0% median, suggesting a relatively tight upside profile rather than one or two outlier years.
- Historical intraperiod swings have included double-digit drawdowns in some years, so the path has not been a straight line even when the final result was positive.
- A TradeWave Ratio of 3.09 and a Sharpe ratio of 3.88 point to strong, historically efficient upside in this XLV seasonal trend.
According to historical data from TradeWave.ai, this midterm-year stretch for XLV has behaved very differently from an average half-year on the calendar, and the next iteration is less than a month away.
How strong is the upcoming seasonal window for S&P 500 Healthcare Sector SPDR (XLV)?
The seasonal window that begins on Jul 11 and runs 155 trading days has produced gains for S&P 500 Healthcare Sector SPDR in all six of the last midterm election years, averaging 9.18% per cycle. XLV closed Friday at 149.68, down 0.7% on the day and about 6.0% below its 52-week high of 159.28, leaving room above if the historical pattern repeats.[1] That combination of a clean win streak, moderate distance from the highs, and a bullish options skew has traders eyeing this healthcare seasonal trend as a potential second-half tailwind.[2]
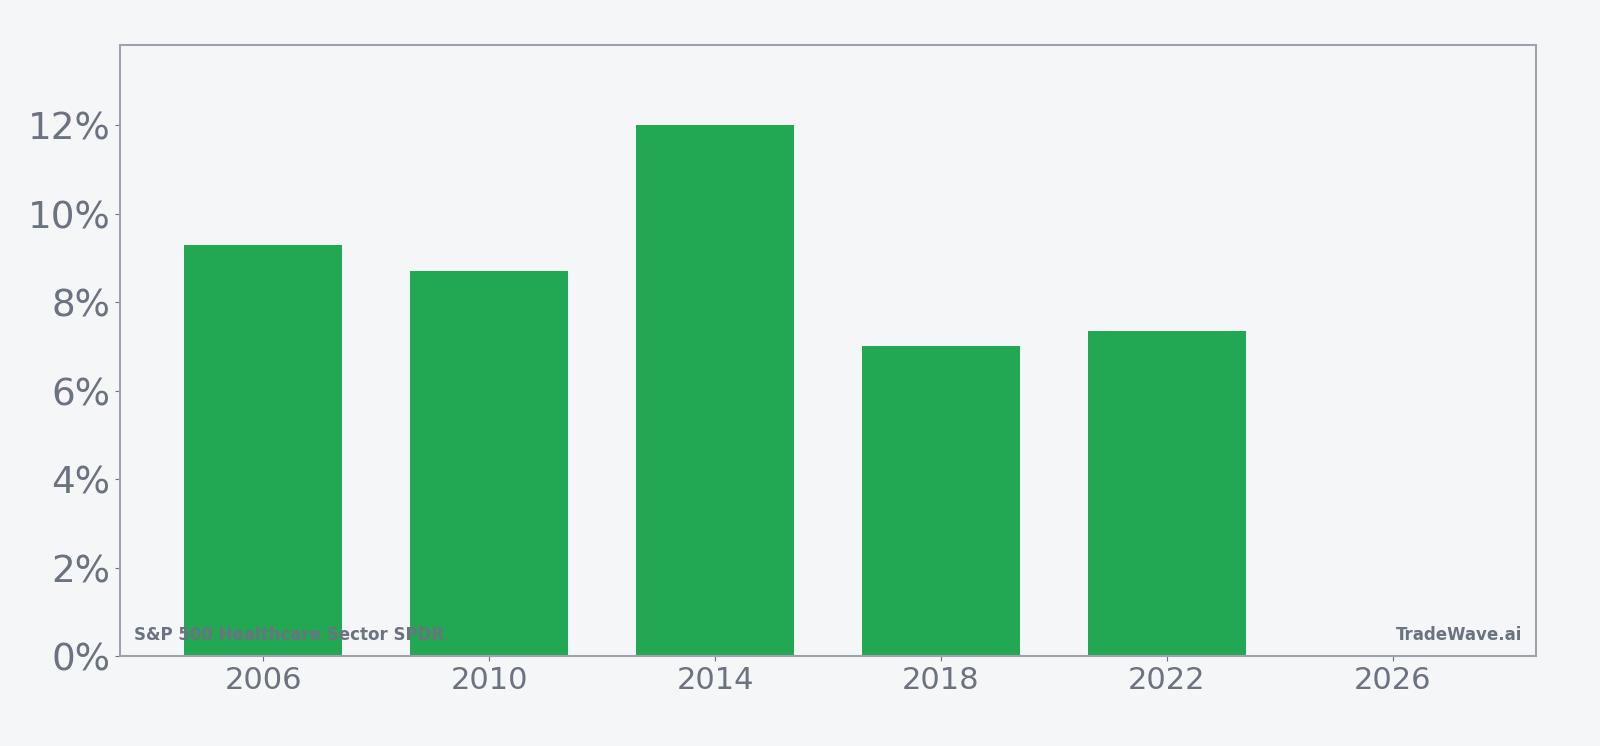
Grouping the data by the presidential election cycle matters here because this window straddles the back half of the midterm election year and the early part of the year before the presidential election, a phase that has often seen policy clarity improve and risk appetite return. For a defensive growth sector like healthcare, that mix of macro uncertainty fading and portfolio rebalancing has historically lined up with steady inflows into XLV during this specific stretch.
Across the last six midterm election years in the sample, the trade direction for this XLV seasonal pattern is long, and every instance finished in the green. Percent Profitable sits at 100%, with 6 winners and 0 losers, and the median profit of 9.0% is very close to the 9.18% average, which suggests the gains have been relatively consistent rather than driven by a single blockbuster year. The strongest outcome came in 2014, when the ETF returned 12.02% over the window, while the softest still delivered a 7.01% gain in 2018.
Looking under the hood, the average profit of 9.18% reflects all years in the sample because there were no losing cycles. That makes this XLV seasonal trend unusual: many sector windows show a mix of big winners and painful losers, but here the distribution is tight and entirely positive. For a long-only pattern, that kind of uniformity across different macro backdrops and policy regimes stands out.
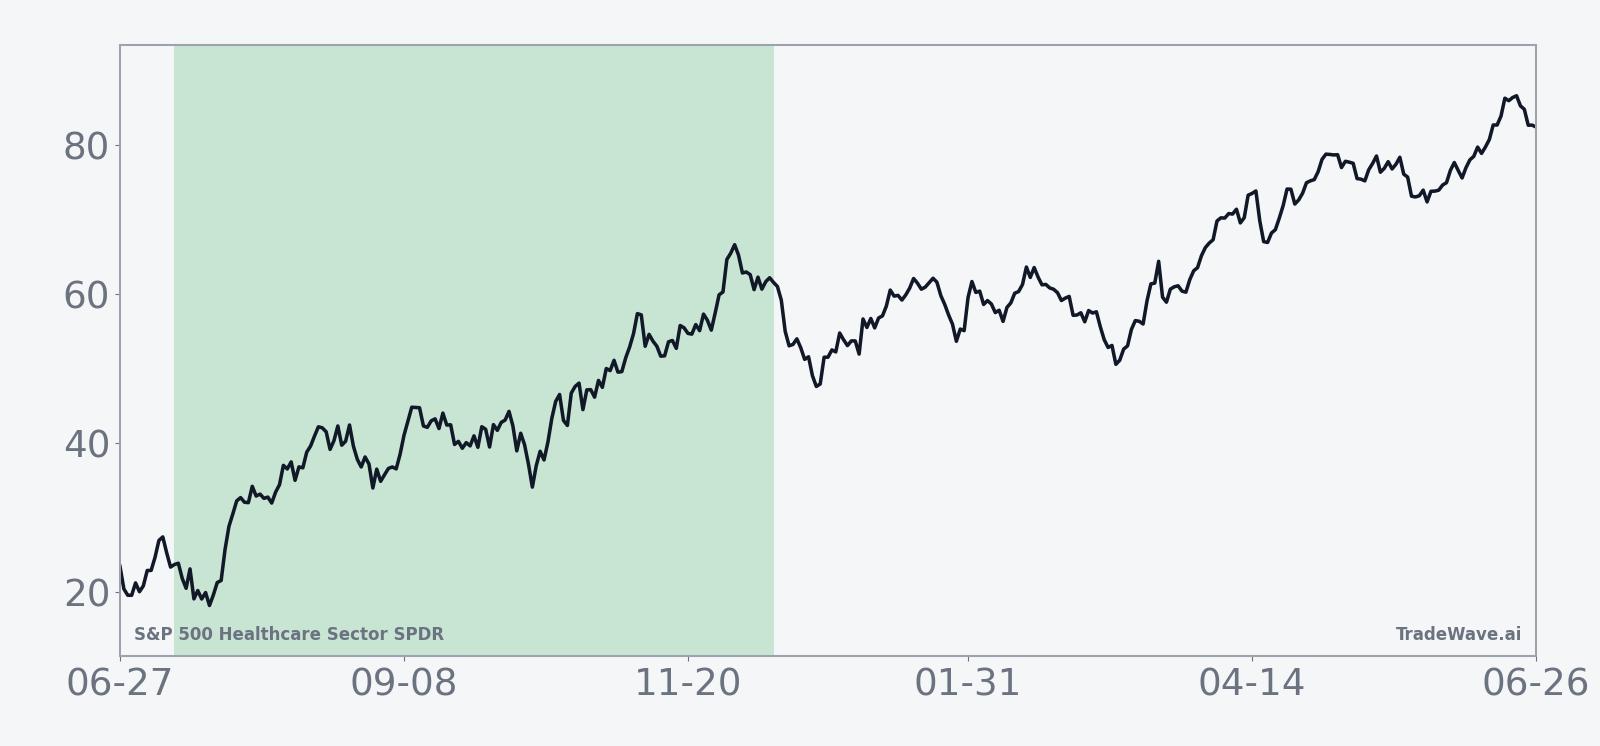
The historical seasonal average path shows XLV tending to grind higher rather than spike, with gains accruing steadily through the middle of the window and consolidating toward the end. That profile fits a healthcare sector that often benefits from rotation and defensive buying as the macro narrative evolves, rather than from one-off event shocks. The cumulative return curve across cycles climbs in a relatively smooth line, reinforcing the idea that this has been a persistent, not episodic, pattern.
A closer look at yearly net returns alongside peak run-ups and worst drawdowns shows how much XLV has typically moved inside the window before settling at its final gain.
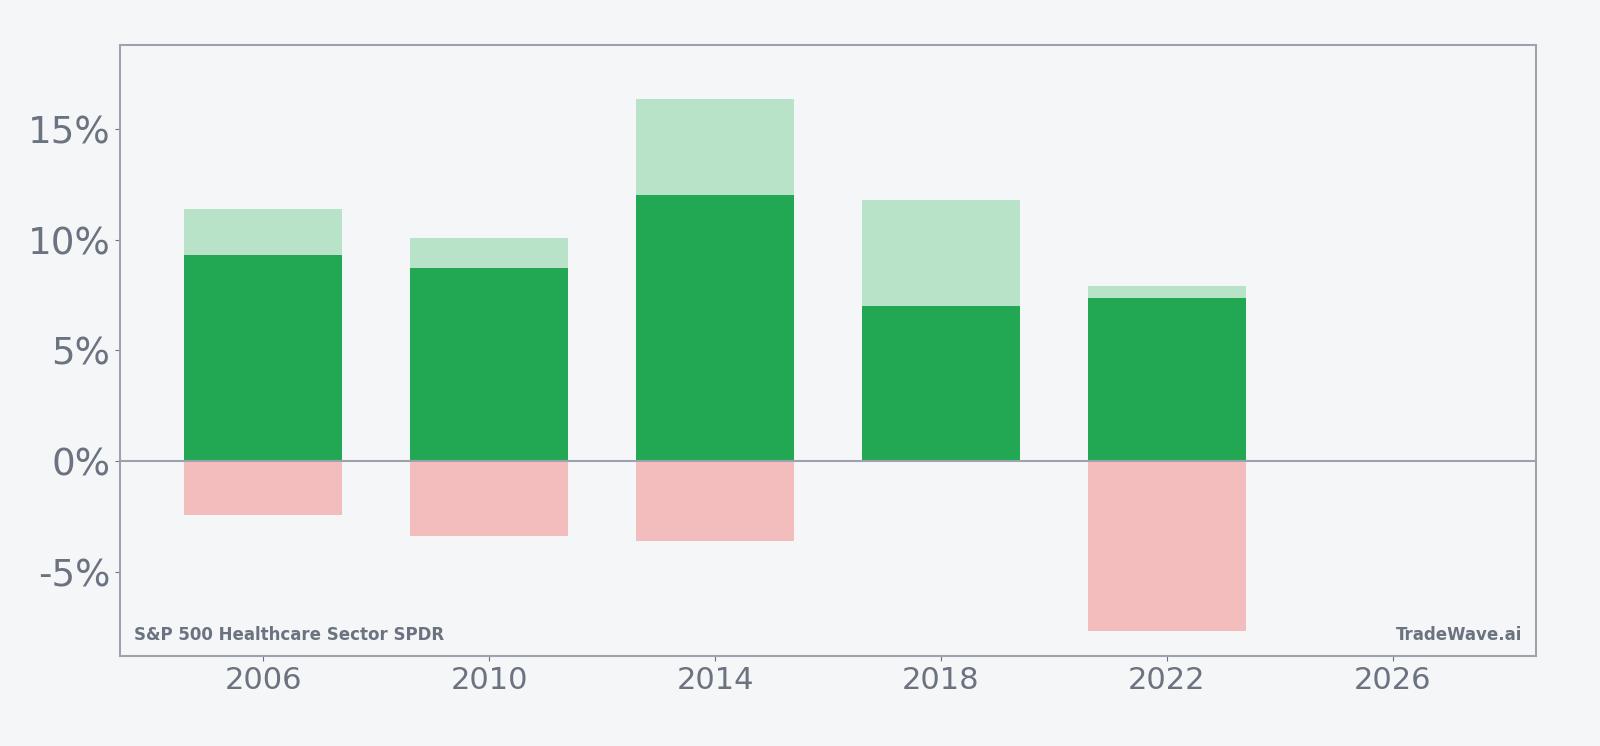
The per-year bars with maximum favorable and adverse excursions show that even in winning years, XLV has not moved in a straight line. In 2002, for example, the ETF finished the window up 10.72% but experienced a best point-to-peak move of 16.44% and a worst drawdown of -11.92% from the entry, illustrating how rallies and pullbacks can both be sizable inside the same trade. By contrast, 2018 saw a 7.01% net gain with a maximum favorable move of 11.77% and almost no adverse excursion, just 0.27%, underscoring that some cycles have been much smoother than others.
Put together, the pattern is clear: this 155-day midterm-year window has favored long exposure in XLV in every instance in the sample, with mid-single to low-double-digit gains and intraperiod swings that can be sharp but have historically resolved higher by the end of the stretch.
Why does S&P 500 Healthcare Sector SPDR (XLV) follow this seasonal pattern?
One likely driver is the way healthcare earnings, regulatory headlines, and fiscal debates cluster in the back half of the midterm election year and into the year before the presidential election. Analysts have pointed to institutional portfolio repositioning in this phase, as managers rotate toward defensive growth sectors like healthcare when policy visibility improves and rate expectations stabilize.[1] This XLV seasonal trend may also reflect index rebalancing and sector rotation flows that tend to favor healthcare once early-year volatility in midterm cycles has passed.
History does not guarantee future results, and even in a 100% winning window, adverse excursions can be large enough to challenge risk management before the seasonal tendency plays out.
What is driving S&P 500 Healthcare Sector SPDR (XLV) today?
XLV finished Friday at 149.68, down 0.68% on the session, after trading between 148.80 and 151.27, with the ETF up 1.54% over the past month and sitting modestly above its 50-day moving average of 147.91 on lighter-than-average volume of about 7.8 million shares versus a 20-day average near 10.9 million.[1] The pullback comes after a powerful rebound that saw XLV climb roughly 25% off its August low into late 2025, completing what technicians described as a textbook bottoming pattern and multi-month breakout that reasserted the ETF’s long-term uptrend.[1] More recently, healthcare has led sector gains during broader market rallies as investors rotated away from crowded tech trades, giving XLV a relative-strength boost within the S&P 500.[2]
Options positioning has added another layer to the story. On Jun 5, 2026, options traders bought roughly 5,300 XLV calls against about 1,000 puts, with about $11 million of $13 million in notional tied to calls, signaling a clear bullish tilt in derivatives markets.[2] That kind of call-heavy flow can reflect both outright upside bets and hedges against short healthcare exposure, but in either case it points to investors treating XLV as a potential outperformer rather than a laggard heading into the midterm-year summer.
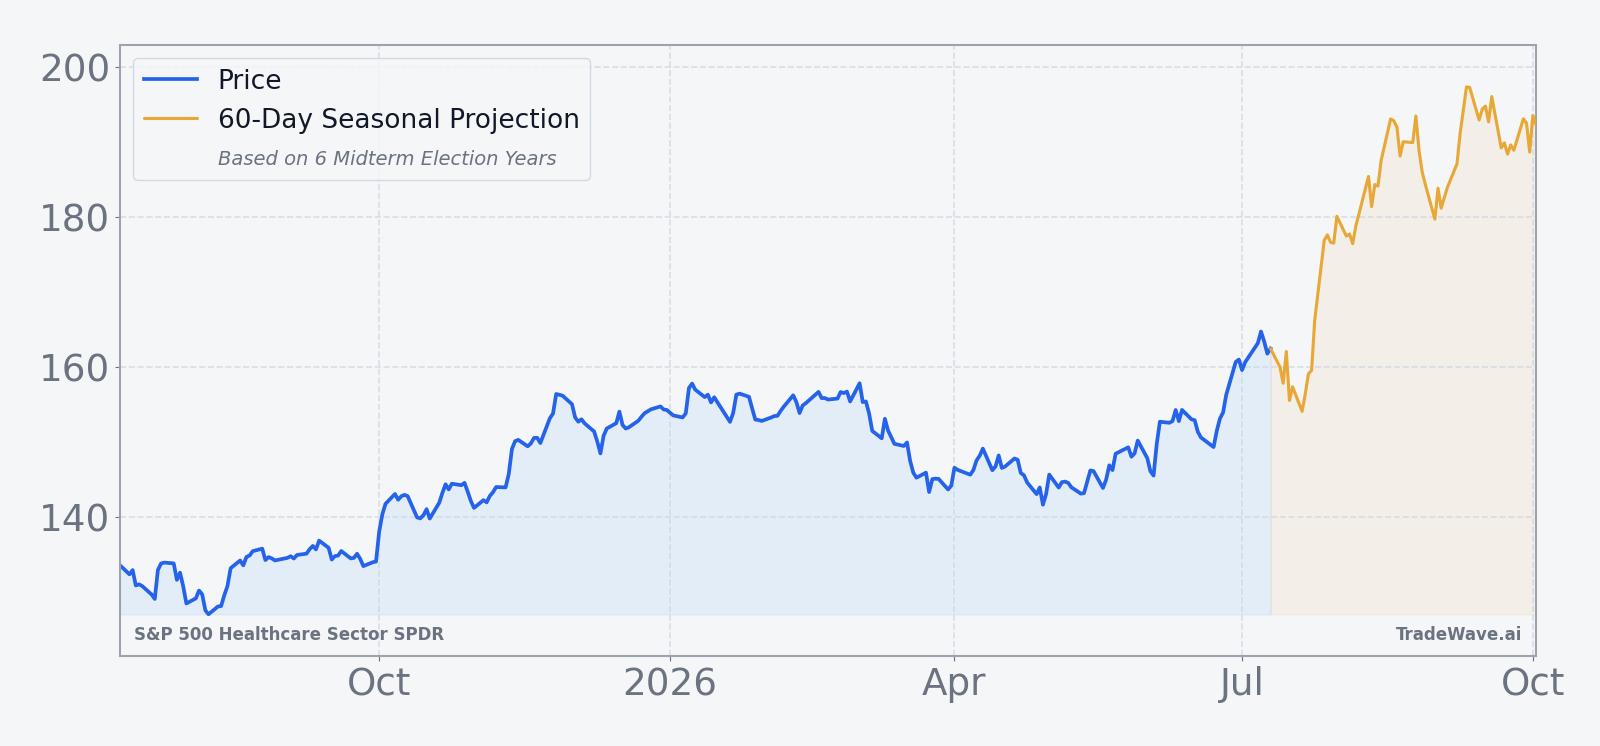
The chart below situates the latest move in its recent multi-month context, alongside a short-term seasonal projection.
What should traders watch as this XLV seasonal window approaches?
First, the calendar: the 155-day XLV seasonal window opens on Jul 11, placing its early weeks squarely in the late midterm election year and its back half in the year before the presidential election, a phase that has often coincided with improving risk appetite. Traders will be watching whether healthcare continues to attract rotation flows as policy debates around spending, drug pricing, and regulation evolve into year-end.[1]
Second, price levels matter. With XLV about 6.0% below its 52-week high and trading just above its 50-day moving average, a sustained push back toward the 155–160 zone would signal that buyers are leaning into the historical seasonality rather than fading it.[1] Conversely, a break back below the 50-day average on rising volume would suggest that this midterm-year setup could start from a weaker technical base than prior cycles.
Third, options and sector flows will be key tells. If the heavy call buying seen in early June persists or builds, it would confirm that institutional traders are continuing to position for upside in XLV into the seasonal window, potentially amplifying moves if the ETF starts to trend.[2] A reversal toward put-heavy flow or a sharp drop in options activity would hint that the Special Insight from earlier this month was more of a one-off than the start of a sustained positioning shift.
Finally, behavior inside the window will be the real test of this XLV seasonal trend. Historically, the ETF has delivered mid-single to low-double-digit gains with occasional double-digit drawdowns along the way, so traders will be watching whether any early weakness is bought quickly or whether pullbacks deepen and linger. If XLV can hold higher lows while healthcare remains a leadership group in sector performance tables, that would line up with the six-for-six record this window carries into the 2026 midterm cycle.
Sources
About this seasonal analysis
Seasonal pattern data is sourced from TradeWave.ai, which analyzes historical price behavior across annual calendar windows going back up to 30 years. Read the full data methodology or the book The 100-Year Pattern by Afshin Moshrefi (2026 edition). Past performance of seasonal patterns does not guarantee future results. This article is for informational purposes only and does not constitute investment advice.