Nasdaq 100 (NDX) Has Dropped in All 6 Midterm Spring Windows as a New One Begins
Nasdaq 100 is entering a 69-day midterm-year stretch that has historically leaned lower even as the tech benchmark trades near record territory.

Key takeaways
- A 69-day seasonal window for Nasdaq 100 tied to midterm election years begins on Mar 12, 2026.
- Across the last 6 midterm cycles, this window has produced losses for NDX in all 6 years, a 100% hit rate for the short side.
- Average profit for winning short trades in the window is 5.91%, with a cumulative 40% gain across the sample.
- The trade direction is short, and the TradeWave Ratio (TWR) of 1.51 signals meaningful travel in the trade direction inside the window.
- Intraperiod swings have been sharp: best point-to-trough moves reached as much as 24.88% in 2002, while some years saw rallies of up to 17.01% before rolling over.
- With NDX trading about 4.6% below its 52-week high, the pattern flags a historically choppy and downside-biased stretch for a benchmark that anchors global risk appetite.
According to historical data from TradeWave.ai, this midterm-year spring period has behaved very differently from an average month for the Nasdaq 100. The next section walks through how that pattern has played out in prior cycles and what it implies for the coming weeks.
Seasonal window
Nasdaq 100 has declined in all 6 midterm election years during this 69-day spring window, averaging 5.91% gains for short positions. The new iteration starts Mar 12, 2026, with the index last quoted at 24,965.01, about 4.6% below its 52-week high of 26,182.10 and roughly 51.0% above its 52-week low of 16,542.20. That mix of elevated levels and a clean sweep of prior short-side wins makes this slice of the calendar unusually important for traders who anchor risk to the tech benchmark.
The presidential election cycle matters here because the Nasdaq 100 tends to trade differently in midterm years than in election or pre-election years, as policy uncertainty, regulation risk and liquidity shifts often peak in the middle of the cycle. This window sits in the early part of the midterm election year, a stretch that has historically been more fragile for growth assets even when the broader four-year pattern remains bullish.
Across the last six midterm election years in this pattern, the trade direction is short and every instance has finished profitable for that stance. Average profit of 5.91% for the winners compares with a cumulative 40% gain across the sample, while the median outcome is a 3.18% move in favor of shorts. The Sharpe ratio of 1.01 points to a reasonably strong risk-adjusted profile based on end-of-window results rather than a lottery-style payoff.
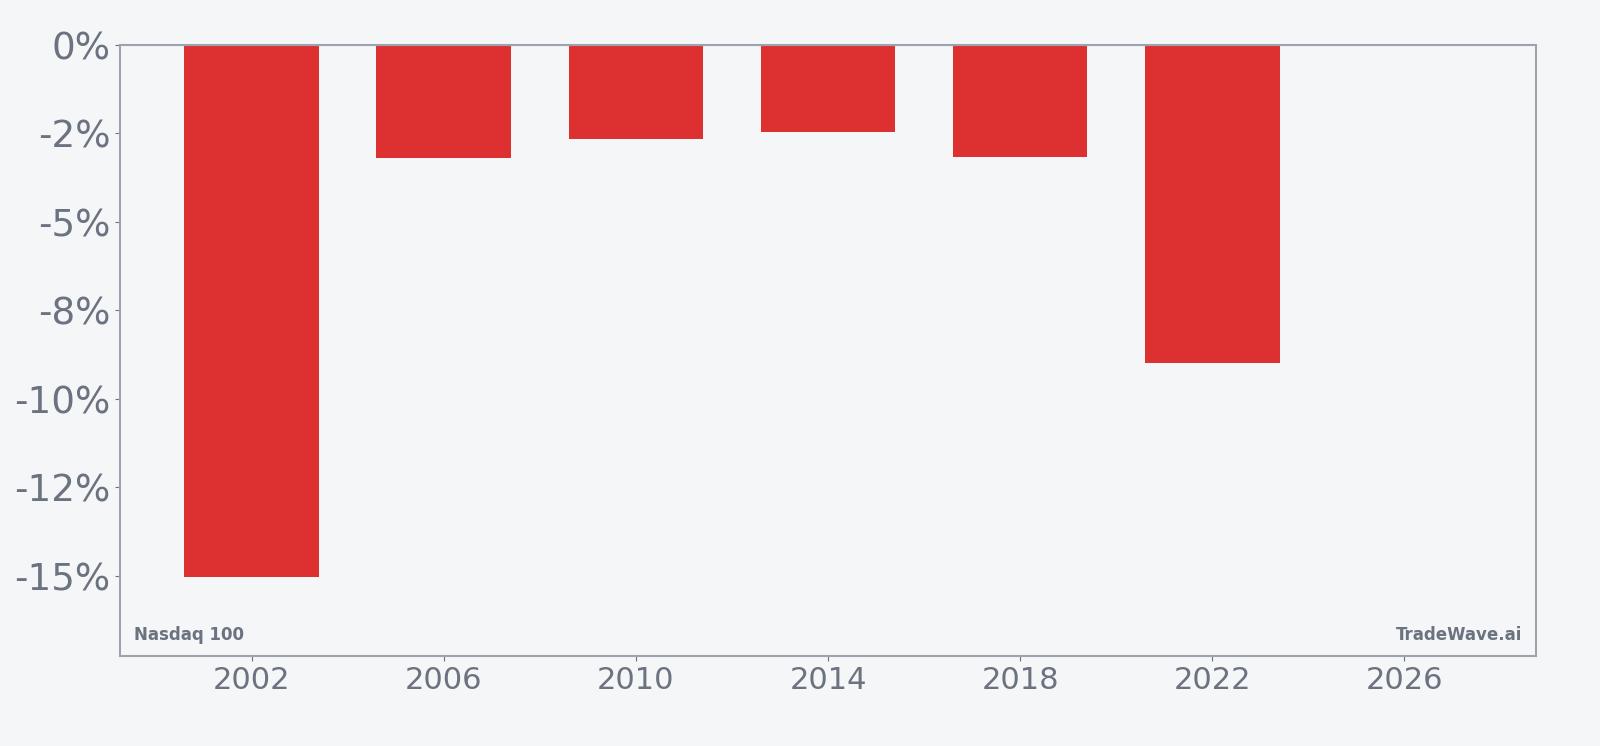
The per-year table shows how that has played out in practice. In 2002, a short entered at 1,520.54 and exited 69 trading days later at 1,292.21, a 15.02% net gain for the short side with a worst intraperiod drawdown of 24.88% from entry and only a 0.18% best countertrend rally. In 2022, the pattern captured an 8.98% net decline from 13,046.64 to 11,875.63, but not before the index rallied as much as 17.01% above the entry level and then reversed, underscoring how violent squeezes can be inside a window that still ends lower.
Those swings show up clearly in the maximum favorable and adverse excursions. MFE/MAE, defined as the best and worst intraperiod excursions from the entry, reveal that even in winning years the Nasdaq 100 has often moved sharply against shorts before rolling over. Years like 2010 and 2018 saw rallies of 7.01% and 0.77% against the trade at some point, paired with adverse moves for shorts of 8.94% and 11.34% respectively, before the index ultimately finished down for the window.
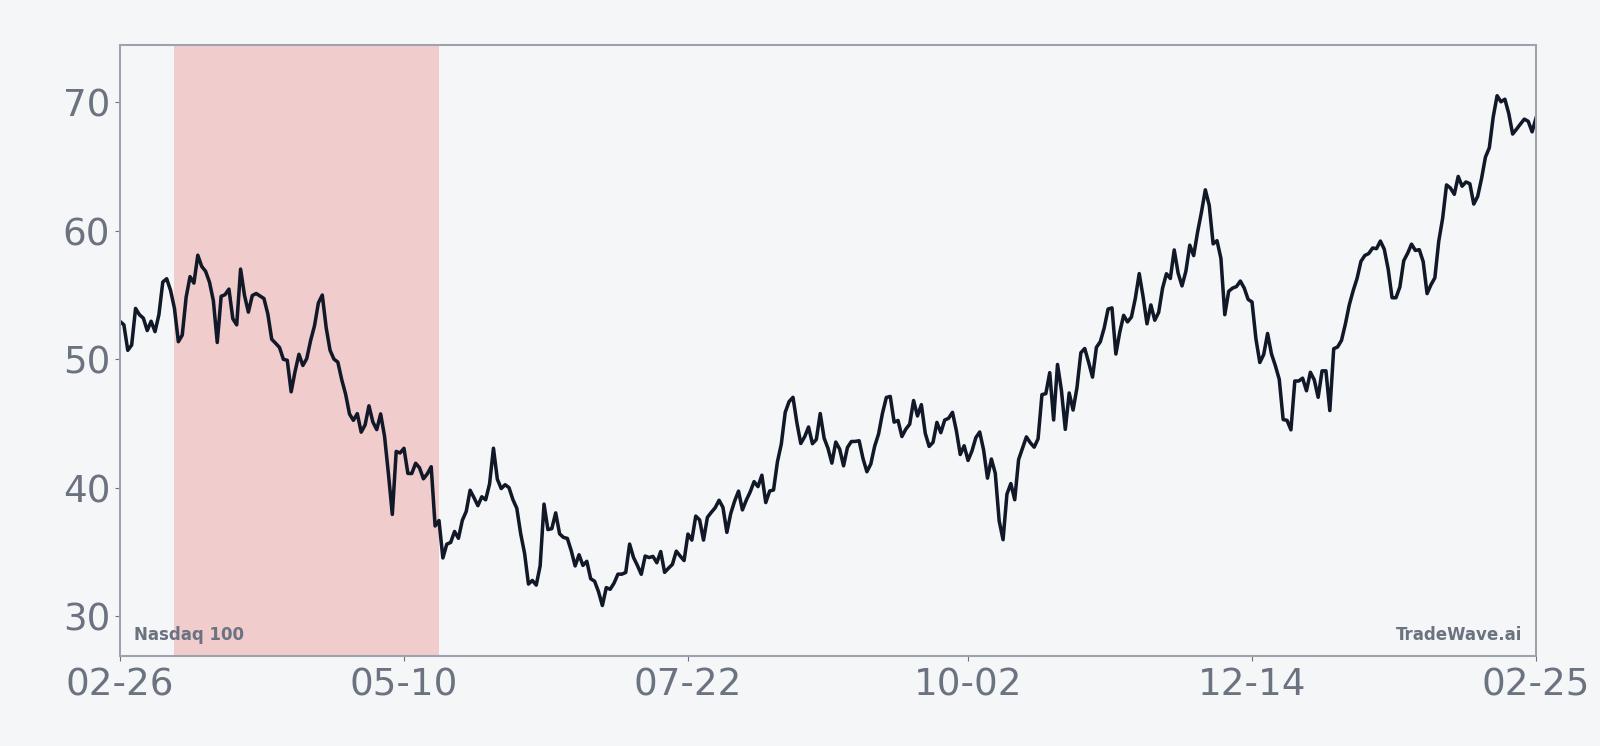
The historical seasonal trend chart for this window slopes lower on average, with much of the downside accruing in the middle third of the 69-day span rather than in a straight line from day one. Early days have tended to be choppy, with the typical path showing modest noise before a more decisive drift lower, then a flattening into the final weeks as the market transitions toward the back half of the midterm year and investors start to look ahead to the pre-election year.
A combined view of net returns with best and worst intraperiod swings shows how far NDX has tended to travel inside this window.
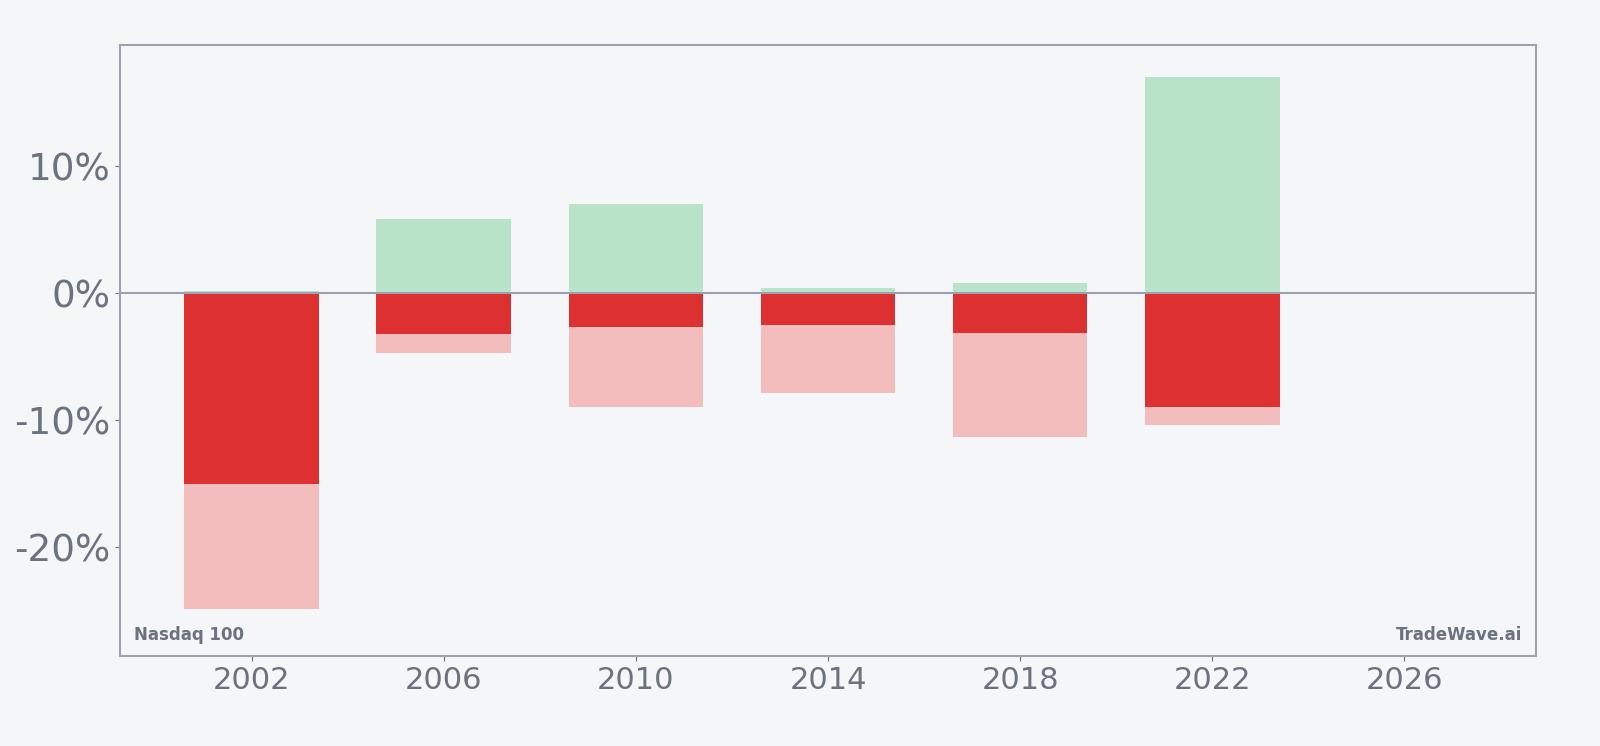
The stacked net/MFE/MAE bars highlight a key point: this has been a downside-biased but high-variance window. Shorts have ultimately won in every sampled year, yet intraperiod rallies have sometimes been large enough to pressure risk management before the broader pattern reasserted itself. Add it up: six for six winning short windows, but with enough two-way travel that position sizing and tolerance for swings have mattered as much as direction.
History does not guarantee future results, and adverse excursions can be large even in windows that have always finished in the trade direction.
Price and near-term drivers
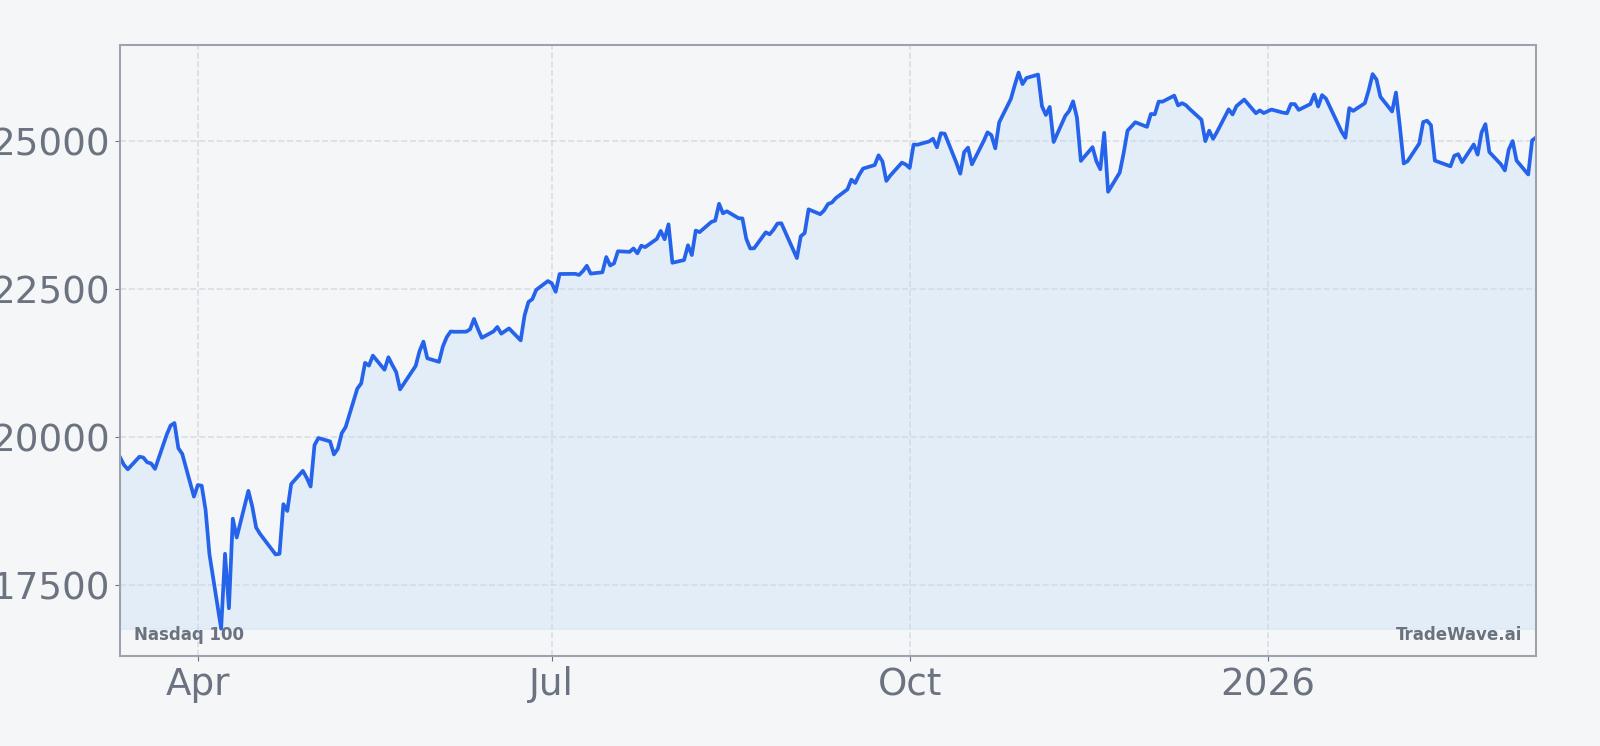
Nasdaq 100 closed Thursday at 24,965.01, up 0.03% on the day, after trading between 24,856.60 and 25,152.12 on volume of roughly 996 million shares across its constituents. The index sits modestly below its 50-day simple moving average of 25,248.47 and about 4.6% under its 52-week high, while remaining far above its 52-week low, a setup that leaves it elevated but not stretched in the very short term.
Over the past month, NDX has slipped 0.65%, a small giveback after a powerful multi-quarter run that carried the benchmark to fresh highs earlier in the year. The 20-day average volume of roughly 6.42 billion shares across the index points to still-healthy liquidity, even as day-to-day ranges have narrowed compared with the more volatile stretches of 2022 and 2023. With no single macro headline dominating the tape this week, the index has been trading more on positioning and sector rotation than on a specific catalyst.
That calm surface sits on top of a more complex backdrop. The Federal Reserve is still navigating the late stages of its inflation fight, and investors are debating how quickly policy can shift from restrictive to neutral without reigniting price pressures. At the same time, mega-cap tech earnings have remained broadly solid, but expectations are high after several years of outperformance, leaving less room for error as the midterm election year unfolds.
The chart below situates the latest move in its recent multi-month context.
What to watch in this window
The next 69 trading days line up with the early part of the midterm election year, when Washington’s policy agenda often looks muddled and markets start to price both regulatory risk and the eventual pivot toward the pre-election year. Historically, this has been a tougher stretch for the Nasdaq 100, with shorts winning in all six prior midterm-year windows in this pattern.
Traders will be watching three things in particular. First, how NDX behaves around its 50-day moving average and the 26,000 area: sustained strength above those levels would look different from the typical midterm-year pattern, while a failure there would rhyme more closely with prior cycles. Second, the reaction to upcoming macro data and any shifts in Fed communication, which could either reinforce or blunt the usual midterm-year volatility in growth assets. Third, the path of earnings revisions for the largest index members, since even small guidance cuts from mega-cap tech can quickly change the tone of the entire benchmark.
Inside the window, behavior that matches the historical pattern would likely feature choppy trading early on, followed by a more decisive drift lower in the middle third of the period before stabilizing. A clean break to new highs without the usual midterm-year wobble would be a clear departure from the last six cycles. Either way, the record is clear: this has been a seasonally fragile stretch for the Nasdaq 100, and how the index trades through it will say a lot about whether the current bull trend can shrug off one of the trickier calendar windows in the four-year election cycle.