Dow Jones Industrial Average (DJI) Near Records as 134-Day Bullish Window Opens Jun 25
Dow Jones Industrial Average is hovering near record territory as it approaches a 134-day summer-fall window that has historically delivered steady gains and limited pullbacks.

What is the seasonal pattern for Dow Jones Industrial Average (DJI)?
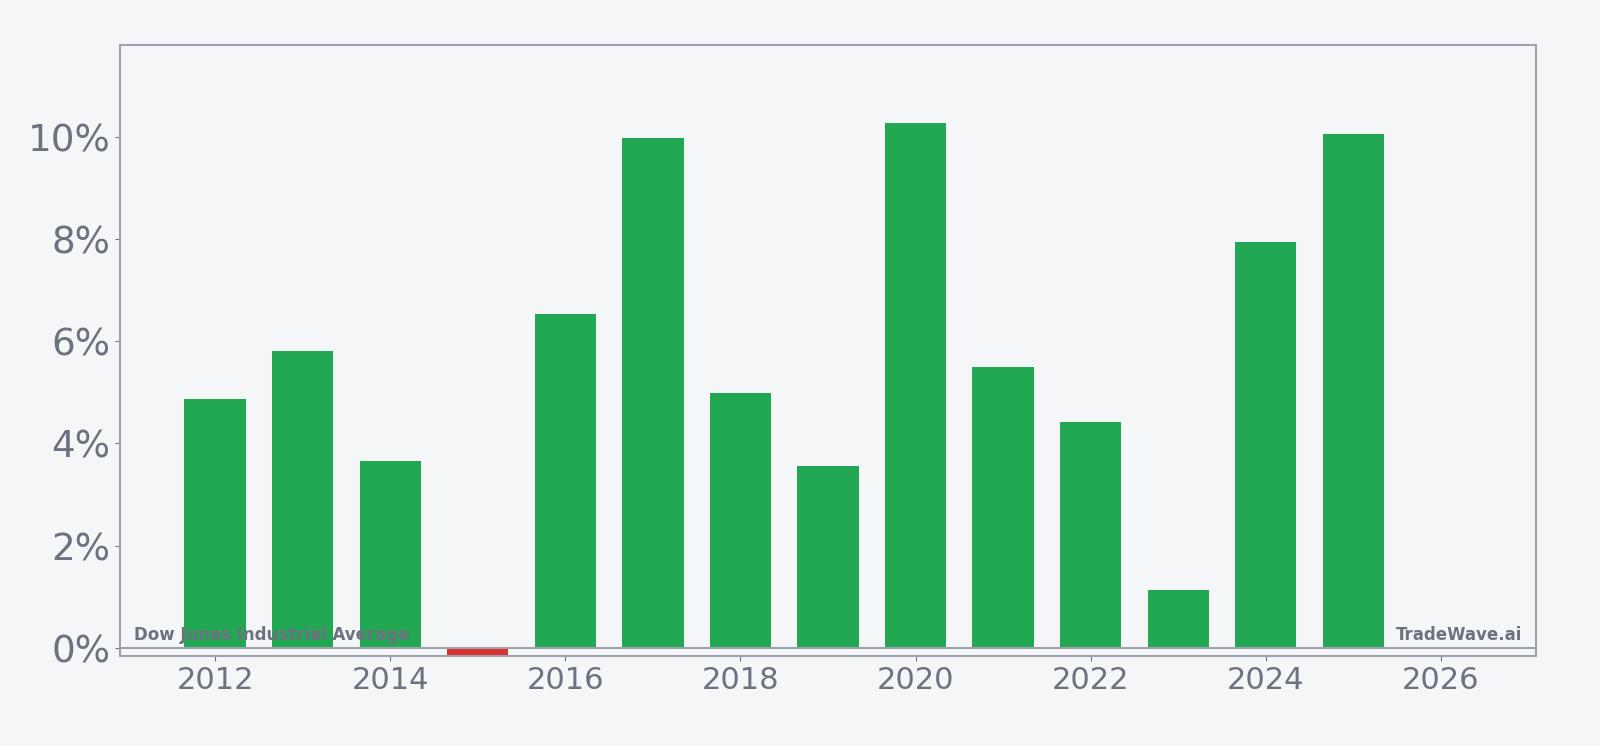
Dow Jones Industrial Average has risen in 13 of 14 years during this late-June-to-fall window, with an average gain of 6.06% in winning years.
- 13-for-14 record in this 134-day window, with winning years averaging 6.06% gains and only one losing year in the sample.
- Percent Profitable stands at 93%, with 13 winners and 1 loser across the past 14 years in this DJI seasonal trend.
- Average profit across all years, including the lone down year, is still 6%, underscoring how consistently this Dow Jones Industrial Average trading window has leaned higher.
- Maximum favorable moves inside the window have often stretched into double digits, while the typical worst drawdowns have been modest relative to the upside.
- The pattern is aligned with a long trade direction, meaning historical strength has come from staying long rather than fading rallies.
- This upcoming Jun 25 start date runs through early November, overlapping earnings season and key macro checkpoints when institutional portfolio repositioning is common.
According to historical data from TradeWave.ai, this stretch of the calendar has behaved very differently from an average quarter for the Dow. The next section walks through how that pattern has played out over the past 14 years and what it implies for the coming summer and fall.
How has Dow Jones Industrial Average (DJI) traded in this upcoming summer-fall window?
Dow Jones Industrial Average has finished higher in 13 of the past 14 iterations of this 134-day summer-fall window, averaging a 6.06% gain in winning years. The next run of this historical seasonality begins on Jun 25 with the index trading around 52,024, roughly 0.1% above its 52-week high of 51,945.89.[1] That combination of a strong win rate and near-record levels makes this Dow Jones Industrial Average seasonal pattern hard for index traders to ignore.
Historically, this Dow Jones Industrial Average trading window has been a straightforward long setup. With a Percent Profitable reading of 93%, the pattern has produced 13 winners against just 1 loser, and even when that lone down year is included, the average outcome across all 14 years is still a 6% gain. The typical winning year has delivered a 6.06% advance from entry to exit, while the median result of 5.24% shows that the gains have not been skewed by a single outlier.
The per-year breakdown shows how consistent that behavior has been. In 2020, the index gained 10.27% across the window, with a best intraperiod run-up of 13.41% from the starting level before any pullback. In 2025, the Dow added 10.07% between late June and early November, with the strongest point-to-peak move reaching 11.77% and almost no adverse excursion at all, as the worst drawdown from entry was just 0.24%.
Even the softer years have tended to grind higher. In 2019, the Dow finished the window up 3.56% after a maximum favorable move of 3.81%, but it also endured a worst intraperiod drawdown of 4.55% from the starting point. The weakest outcome in the sample came in 2023, when the index gained only 1.13% by the end of the window despite a 5.83% peak run-up and a 4.12% worst drawdown, a reminder that some years have seen choppy back-and-forth trading before finishing only slightly higher.
On the downside, the most notable adverse move occurred in 2022. That year still ended with a 4.42% gain across the window, but the worst intraperiod drawdown reached 8.83% below the entry level before the market recovered. That profile fits a broader pattern in this DJI seasonal trend: even in winning years, investors have occasionally had to sit through meaningful volatility before the gains stuck.
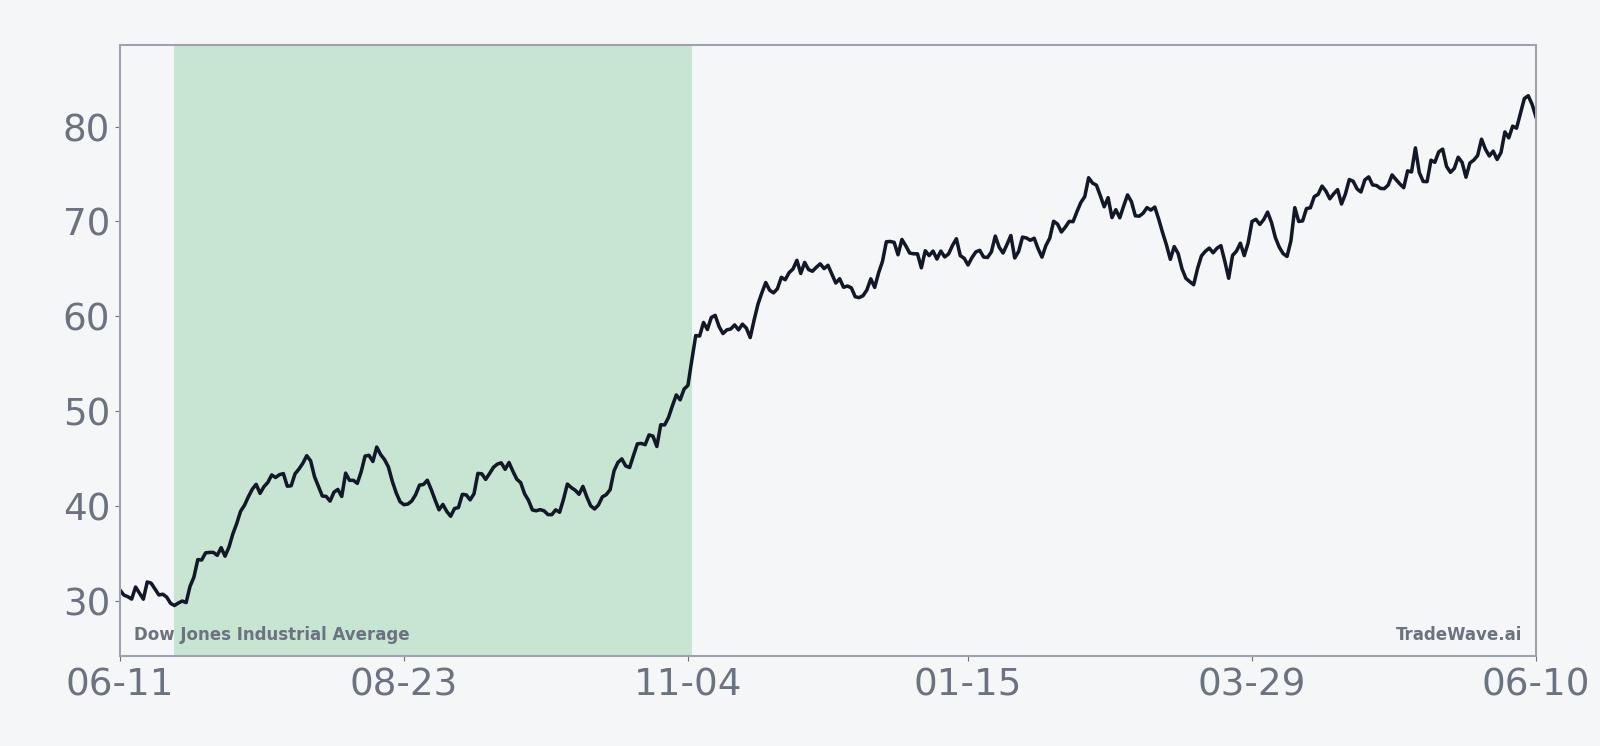
The historical seasonal average suggests that much of the typical gain accrues steadily rather than in a single burst. The curve tends to rise through the first half of the window, pause or consolidate around the middle, then grind higher again into the final weeks as earnings season and year-end positioning kick in. That shape lines up with a long trade direction that benefits from staying invested through mid-window noise.
Year-by-year bars with intraperiod swings show how upside and downside have coexisted inside this otherwise steady pattern.
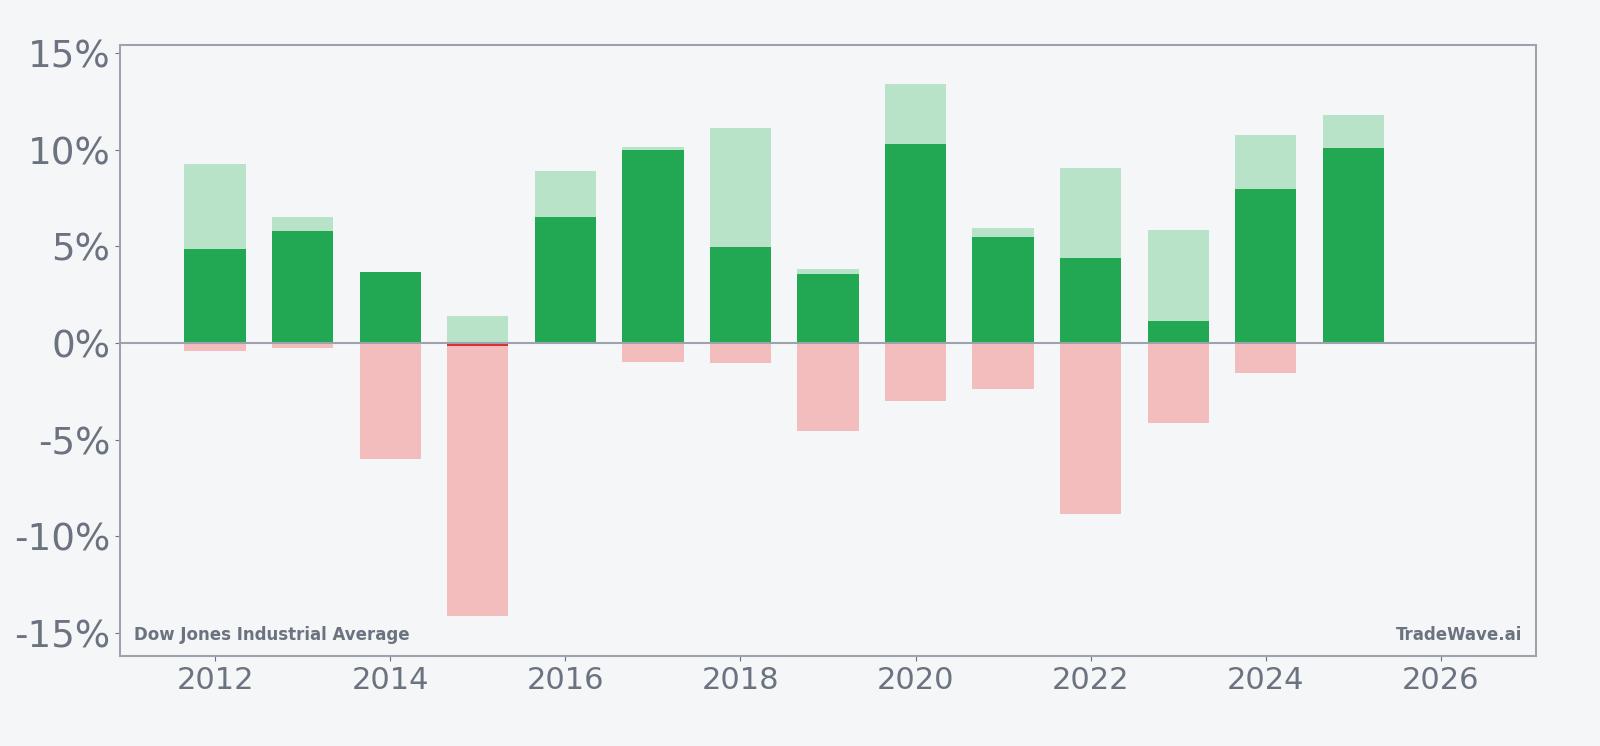
The combined net, peak favorable move and worst drawdown bars underline the trade-off. Maximum favorable excursions have often pushed into the high single digits or low double digits, while maximum adverse excursions have usually stayed in the low- to mid-single digits, with only a few years like 2022 showing deeper temporary damage. Add it up: 13 winners, one small loser, and a long-biased window that has historically rewarded patience more often than not.
History does not guarantee future results; adverse excursions can still be large inside this window even when the final outcome is positive.
Why does Dow Jones Industrial Average (DJI) follow this seasonal pattern?
This pattern may reflect how earnings season and institutional portfolio rebalancing cluster between late June and early November. Analysts have pointed to summer reporting cycles, buyback execution and fiscal year-end positioning as drivers that keep steady demand under large-cap industrial and financial names in this stretch. Consumer and business spending patterns into back-to-school and early holiday planning can also support the index’s sector mix during this period.
What is driving Dow Jones Industrial Average (DJI) today?
Dow Jones Industrial Average closed at 52,023.53 on Jun 17, up 0.68% on the day and about 24.8% above its 52-week low of 41,981.14, leaving it fractionally above its 52-week high and well above its 50-day moving average of 49,661.90.[1] The move extends a spring rally that has been fueled by broad earnings strength, with late-April reports helping push the index to record highs as corporate results beat expectations across sectors.[1] Geopolitics have been a secondary but important backdrop, with calmer Middle East headlines in April supporting risk appetite and keeping volatility contained.[1]
The chart below situates the latest move in its recent multi-month context alongside a short-term seasonal projection.
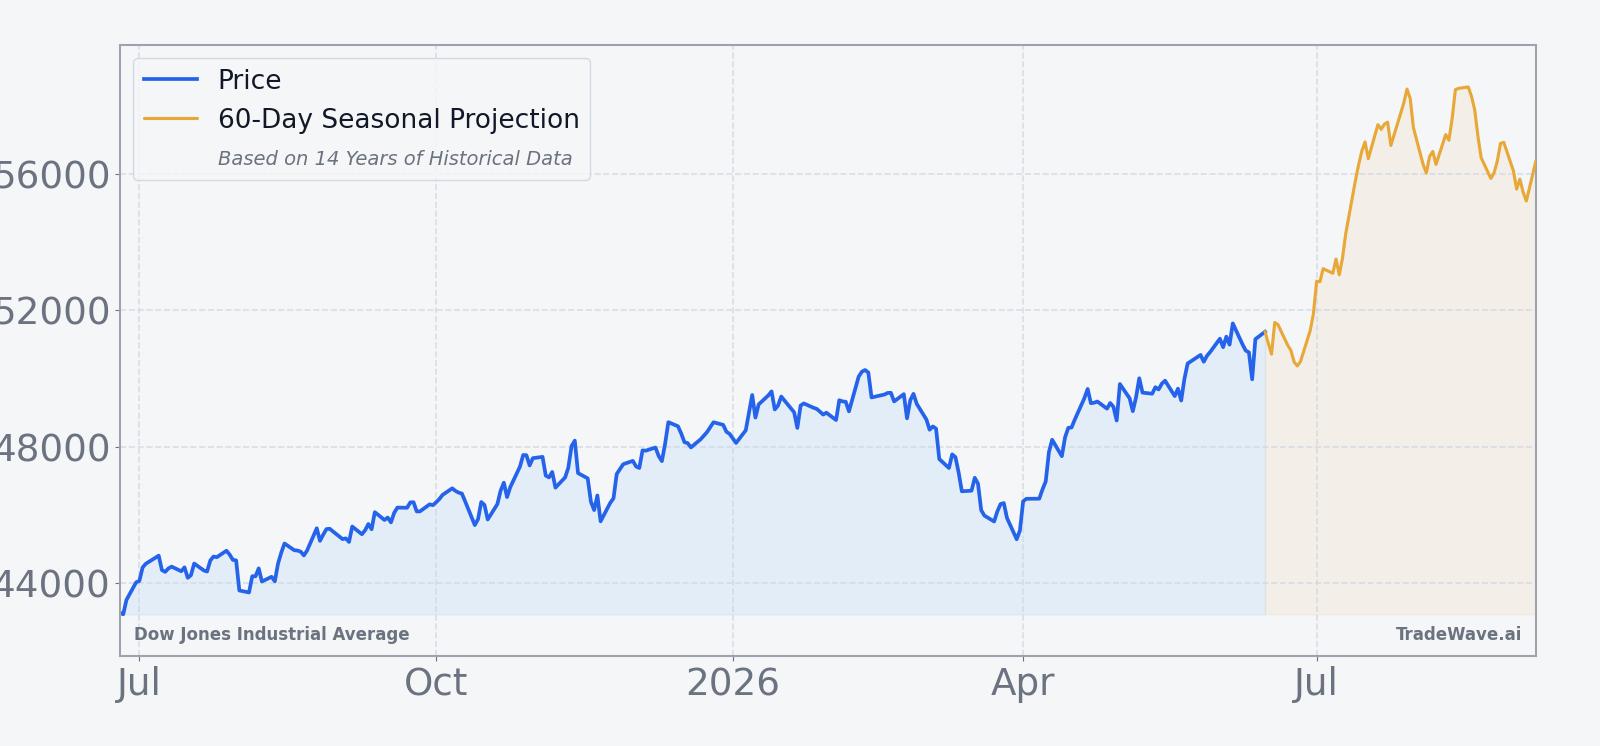
From here, the key question for traders is whether a market that is already near records can still respond to a historically bullish Dow Jones Industrial Average seasonal pattern. The index is entering the window with strong momentum, a supportive earnings backdrop and relatively calm macro conditions, which in prior years have often coincided with further gains rather than sharp reversals.[1] If the pattern repeats, pullbacks inside the window may look more like consolidation than the start of a deeper correction, but the 2022 experience shows that even winning years can involve uncomfortable drawdowns before the trend reasserts itself.
What should traders watch as this DJI seasonal window opens?
First, watch how the Dow behaves around the Jun 25 start date and into the first month of the window. In prior years, early strength has often set the tone, so a quick rejection from record territory would be an early sign that this cycle may diverge from the historical script. Second, earnings season will again be critical: strong reports from industrials, financials and consumer names have historically lined up with the better years in this pattern, while softer guidance has tended to show up in the choppier outcomes.
Third, monitor breadth and leadership inside the index. The strongest historical windows have usually featured broad participation rather than a narrow group of mega-cap winners, so traders will want to see a healthy advance/decline line and a rising share of Dow components holding above their 50-day moving averages. Finally, keep an eye on intraperiod swings: if maximum favorable moves build while worst drawdowns stay contained, the window will be tracking close to its long-run profile; if downside excursions deepen without a corresponding recovery, that would be a sign that this year’s Dow Jones Industrial Average seasonal trend is breaking from the past.
Sources
About this seasonal analysis
Seasonal pattern data is sourced from TradeWave.ai, which analyzes historical price behavior across annual calendar windows going back up to 30 years. Read the full data methodology or the book The 100-Year Pattern by Afshin Moshrefi (2026 edition). Past performance of seasonal patterns does not guarantee future results. This article is for informational purposes only and does not constitute investment advice.