18 of 19: Nasdaq 100 (NDX) Has Rallied in This Late-June 25-Day Window, Averaging 4.35%
Nasdaq 100 is trading just below record highs as it heads into a late-June 25-day window that has historically delivered steady upside and limited average drawdowns.

What is the seasonal pattern for Nasdaq 100 (NDX)?
Nasdaq 100 has risen in 18 of 19 years during this late-June 25-day window, with an average gain of 4.35% in winning years.
- 18-for-19 record in this window, with winning years averaging 4.35% gains over 25 trading days.
- Percent Profitable sits at 95%, with 18 winners and just 1 loser across the 19-year lookback.
- The all-years average return, including the lone losing year, is still a strong 4% for the Nasdaq 100.
- Trade Direction is long, supported by a TradeWave Ratio of 2.07 and a Sharpe ratio of 1.46 for this pattern.
- Historical paths show upside persistence, but adverse moves inside the window can still be meaningful before rallies resume.
- The next iteration begins on Jun 28, 2026, giving traders a defined late-June to late-July Nasdaq 100 trading window to track.
According to historical data from TradeWave.ai, this late-June stretch has behaved very differently from an average month on the Nasdaq 100 calendar, and the next iteration is just days away.
How has Nasdaq 100 (NDX) traded in this late-June seasonal window?
Nasdaq 100 has posted gains in 18 of the past 19 years during the 25 trading days starting Jun 28, with winning years averaging 4.35% and an all-years average of 4% for this long-biased setup. The index last closed at 29,446.18, up 3.29% on the day and sitting about 4.3% below its 52-week high of 30,762.20.[1]
The trade direction for this pattern is explicitly long, and the win-loss record backs that up. Percent Profitable is 95%, with 18 winners and just 1 losing year across the 19-year sample. Average gains in the winning years come in at 4.35%, while the all-years average, which includes the single down year, is still a solid 4%.
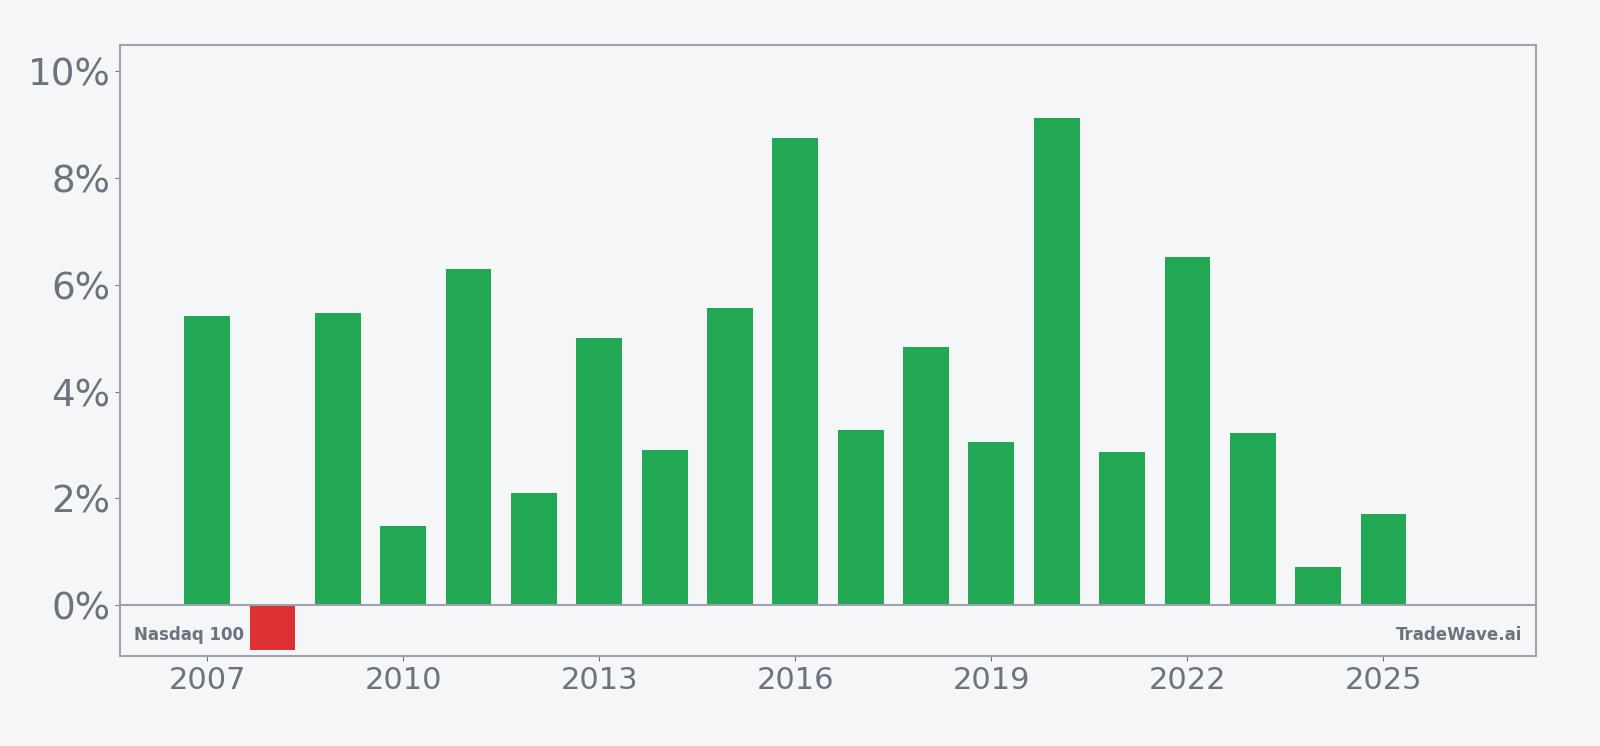
The per-year breakdown shows that the strongest outcome in the recent decade was 2020, when the Nasdaq 100 gained 9.13% in the window, with a maximum favorable move of 11.12% and almost no drawdown from entry. At the other end of the spectrum, 2024 delivered only a 0.71% net gain despite a 5.12% peak run-up, underscoring that even “good” years can see rallies fade before the window closes.
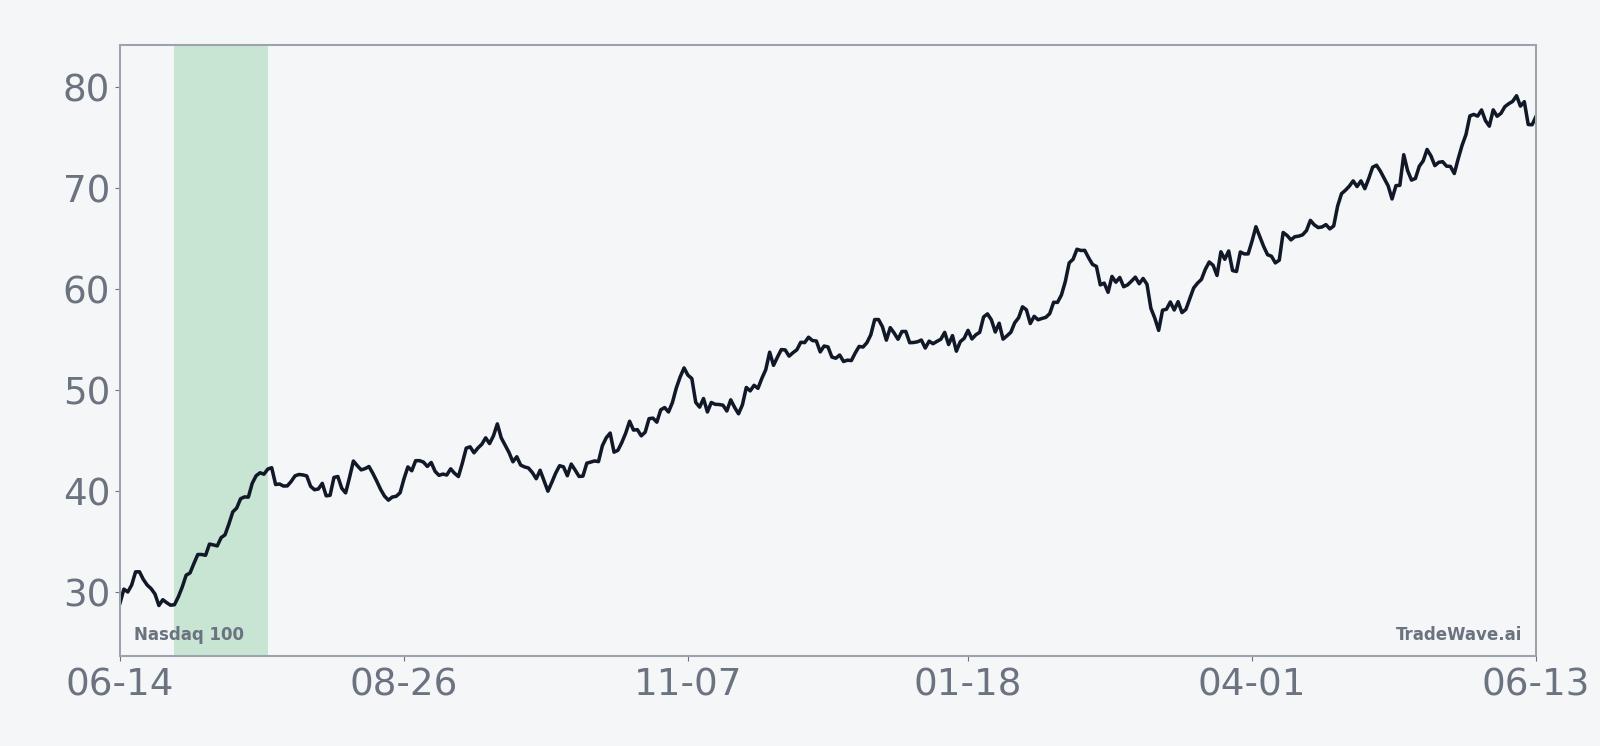
The historical seasonal trend line slopes higher through most of the 25-day stretch, with gains tending to build steadily rather than in a single spike. In many years, the index has pushed higher early in the window, consolidated mid-period, then added a final leg of strength into the last week.
A combined view of net returns and intraperiod swings shows how upside and downside have coexisted inside this bullish window.
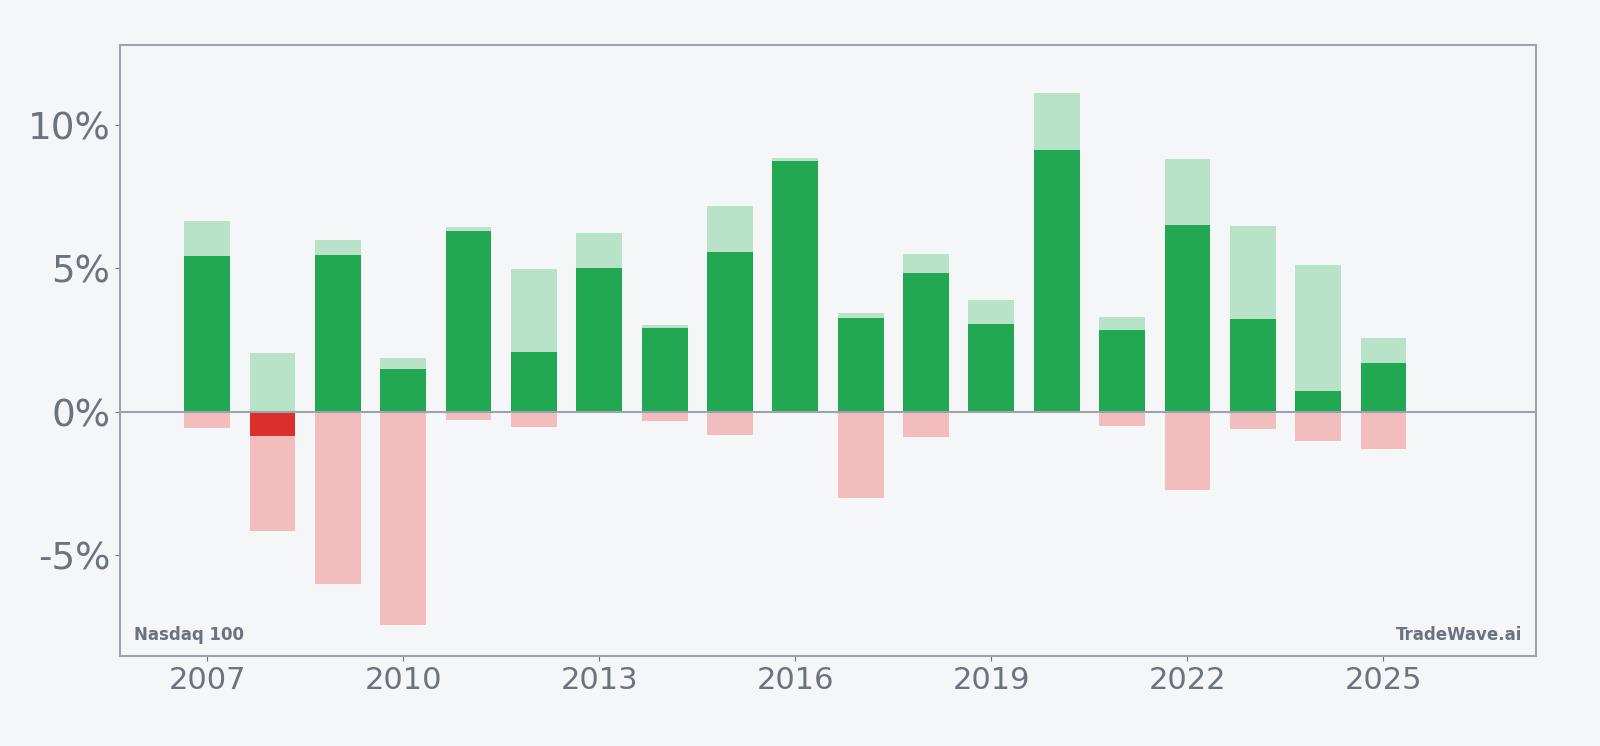
The stacked net, MFE and MAE bars show that in most years the maximum favorable move has comfortably exceeded the worst drawdown, consistent with the long bias, but there are still episodes where the index dipped meaningfully before finishing higher. That mix of strong average gains and non-trivial intraperiod downside is what gives this window both its appeal and its risk.
History does not guarantee future results, and maximum adverse excursions can be large even in years that ultimately finish higher.
Why does Nasdaq 100 (NDX) follow this seasonal pattern?
This late-June to late-July pattern may reflect a cluster of tech and growth earnings pre-positioning, as investors adjust exposure ahead of the heavy reporting season. Analysts have also pointed to index rebalancing and options expiration flows that often hit around quarter-end and early July, which can concentrate buying in Nasdaq 100 leaders. The result has been a recurring tendency for the index to grind higher through this specific slice of the summer calendar.
What is driving Nasdaq 100 (NDX) today?
Nasdaq 100 closed Monday at 29,446.18, up 3.29% on the session, as buyers pushed the tech-heavy benchmark to within about 4.3% of its 52-week high at 30,762.20.[1] The move extends a modest one-month gain of 0.19% and keeps the index comfortably above its 50-day moving average near 28,019, with turnover of roughly 1.43 billion shares versus a 20-day average volume of about 9.94 billion.[1]
The chart below situates the latest surge against the past year of trading and the upcoming seasonal projection.
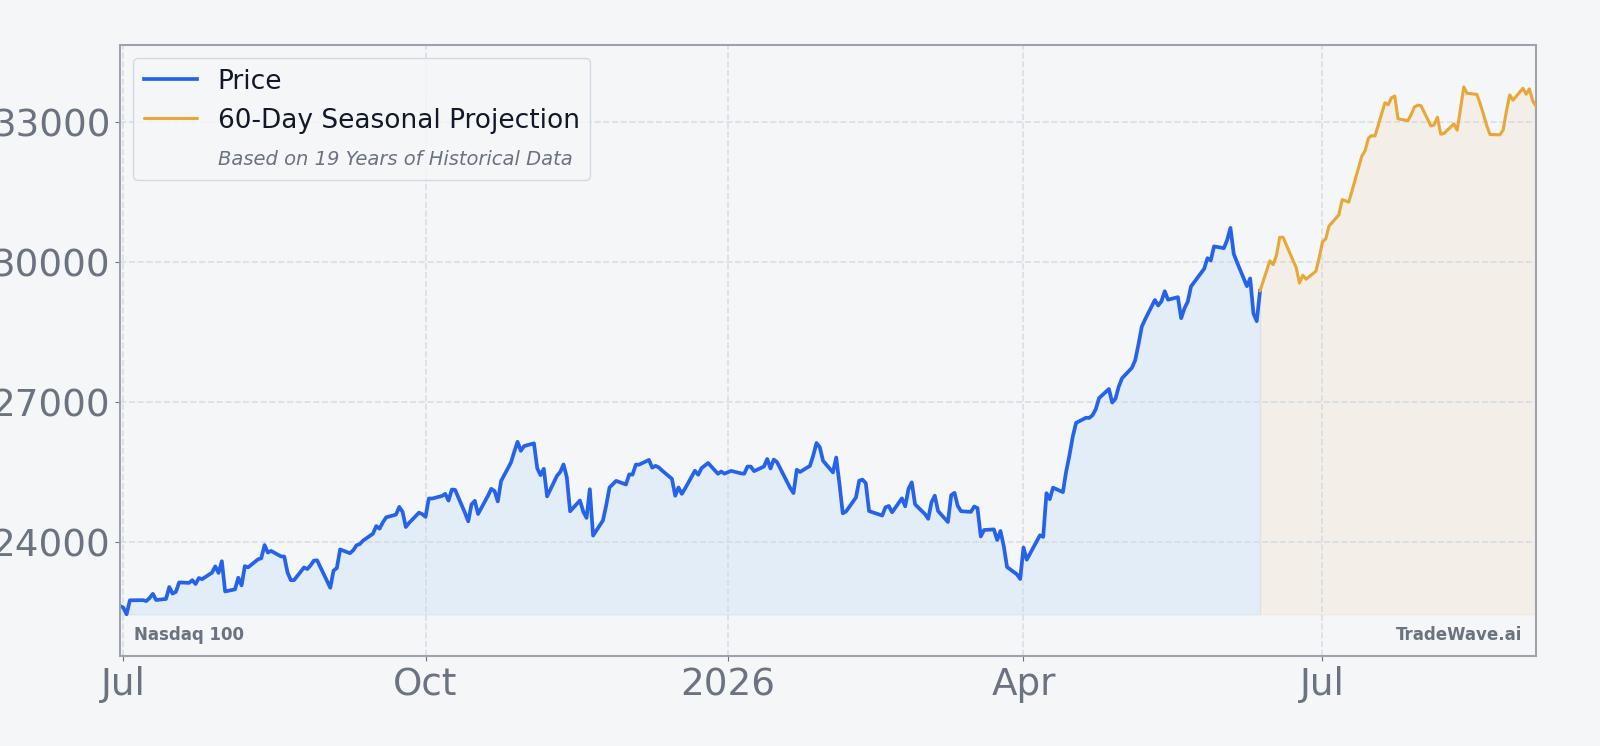
Sector-wise, the Nasdaq 100 remains dominated by mega-cap technology and growth names, so strength here continues to signal a constructive tech-sector seasonal outlook.[2] With the index already near record territory, the approaching late-June seasonal window adds another layer of context for traders watching whether leadership in big tech can carry broader indices higher into mid-summer.
Sources
- [1] Reuters: Nasdaq 100 notches first record high close since February (Jun 24, 2025).
- [2] Reuters: Nasdaq proposes "fast entry" rule to speed up inclusion of large new listings (Feb 4, 2026).
About this seasonal analysis
Seasonal pattern data is sourced from TradeWave.ai, which analyzes historical price behavior across annual calendar windows going back up to 30 years. Read the full data methodology or the book The 100-Year Pattern by Afshin Moshrefi (2026 edition). Past performance of seasonal patterns does not guarantee future results. This article is for informational purposes only and does not constitute investment advice.