CBOE Volatility Index (VIX) Has Dropped in 6 of 10 Late-June Windows, Averaging 15.95% Losses
CBOE Volatility Index is jumping toward the upper end of its 12-month range just as a 23-day seasonal window that has historically favored lower VIX readings approaches in late June.
What is the seasonal pattern for CBOE Volatility Index (VIX)?
CBOE Volatility Index has fallen in 6 of 10 years during this late-June 23-day window, with an average 15.95% gain in winning short-VIX years.
- 6 wins and 4 losses for short VIX in this window over the past decade, with winning years averaging a 15.95% move in the trade direction.
- The upcoming seasonal window starts on Jun 19, 2026 and runs for 23 trading days, a period that has historically leaned bearish for VIX levels.
- Percent Profitable sits at 60%, with 6 winners and 4 losers, while Avg Profit - All across every year in the sample is 8%.
- Avg Profit reflects only the winning short-VIX years, whereas Avg Profit - All blends both the strong down-vol episodes and the losing spikes.
- The TradeWave Ratio of 1.86 suggests VIX has typically traveled meaningfully in the short direction inside the window before final settlement.
- Intraperiod swings have been wide, with some years showing sharp maximum favorable moves alongside deep adverse excursions, underscoring the risk of volatility spikes even in a generally bearish VIX pattern.
According to historical data from TradeWave.ai, this late-June stretch in VIX has behaved differently from an average month on the calendar, and the next iteration is only days away.
How has CBOE Volatility Index (VIX) traded in this late-June window?
CBOE Volatility Index is set to enter a 23-day late-June window that has historically rewarded traders positioned for lower volatility rather than fresh spikes. VIX closed at 22.22 on Jun 10, up 11.83% on the day and sitting well below its 52-week high of 35.30 but far above the 12-month low of 13.38, a reminder that implied volatility has already climbed off the floor.[1] That combination of an elevated starting point and a seasonally bearish VIX pattern gives this year’s window more bite than a typical summer lull.
Historically, this 23-day stretch has leaned in favor of short VIX exposure. Across the past 10 years, the pattern shows 6 winning short-VIX seasons and 4 losing ones, for a Percent Profitable of 60%. In the winning years, VIX has moved an average of 15.95% in the trade direction, while the all-years average, including the losing spikes, comes in at 8%. That gap between Avg Profit and Avg Profit - All reflects how a handful of sharp volatility surges can dent what is otherwise a bearish VIX seasonal trend.
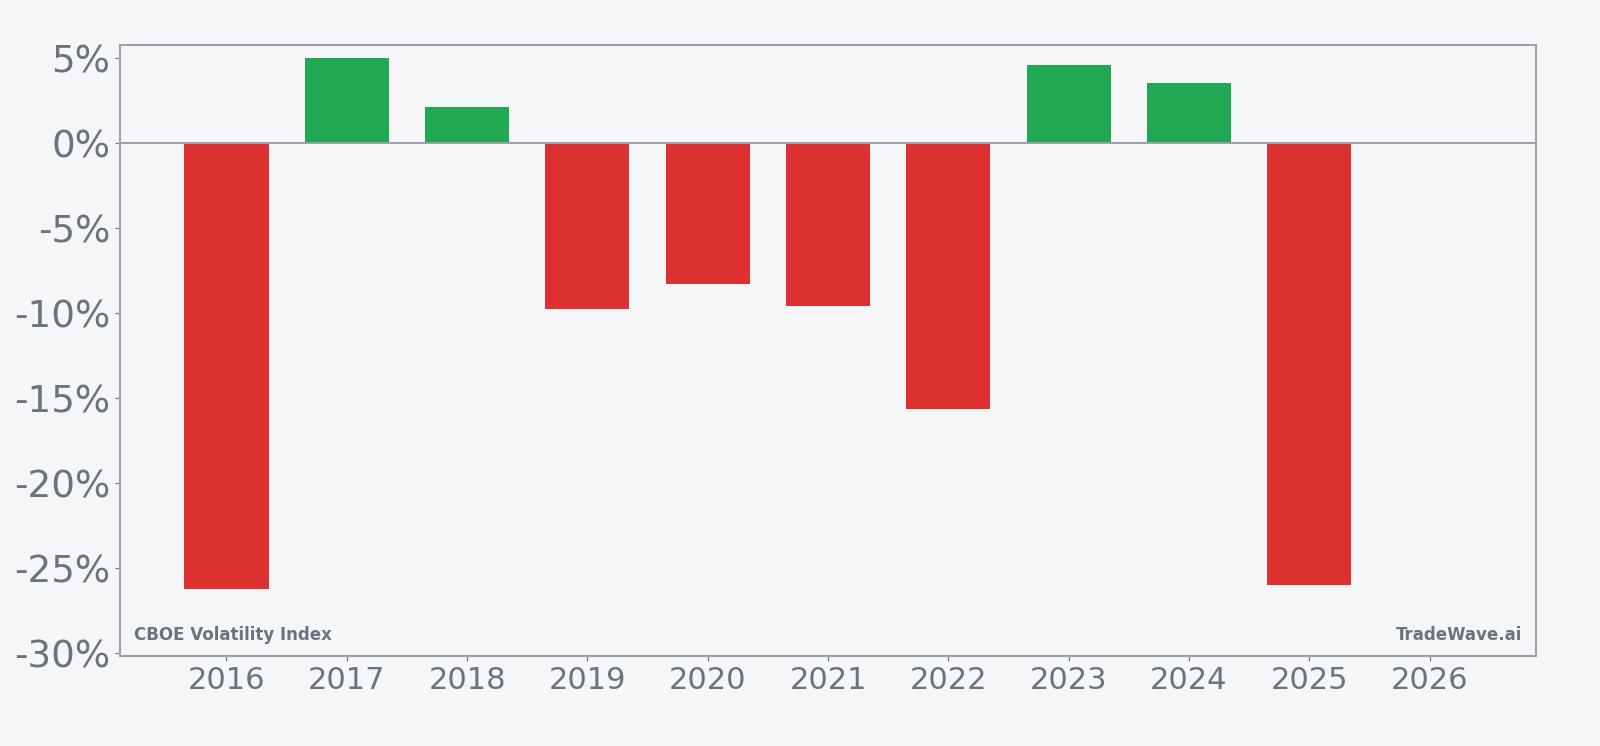
The per-year breakdown shows how uneven those swings can be. In 2016 and 2025, short VIX positions in this window would have been hit hard, with net returns of -26.29% and -26.03% respectively as volatility spiked instead of fading. By contrast, years like 2019 and 2021 delivered more modest but still negative VIX closes for shorts, while 2017, 2018, 2023 and 2024 were small winners or near flat. The pattern is not a one-way bet, but the tilt toward lower VIX into mid-summer is clear across the decade.
The historical seasonal average suggests VIX often drifts lower in the first half of the window, then either stabilizes or snaps higher late in the period. That shape fits the idea of early-summer calm in equities followed by episodic risk-off days as liquidity thins and macro headlines hit. For traders, it means the typical pattern has been a grind lower in implied volatility punctuated by a few years where late-window spikes turned the whole season into a loss for shorts.
Year-by-year bars that combine net results with best and worst intraperiod swings show how far VIX has tended to travel inside this window.
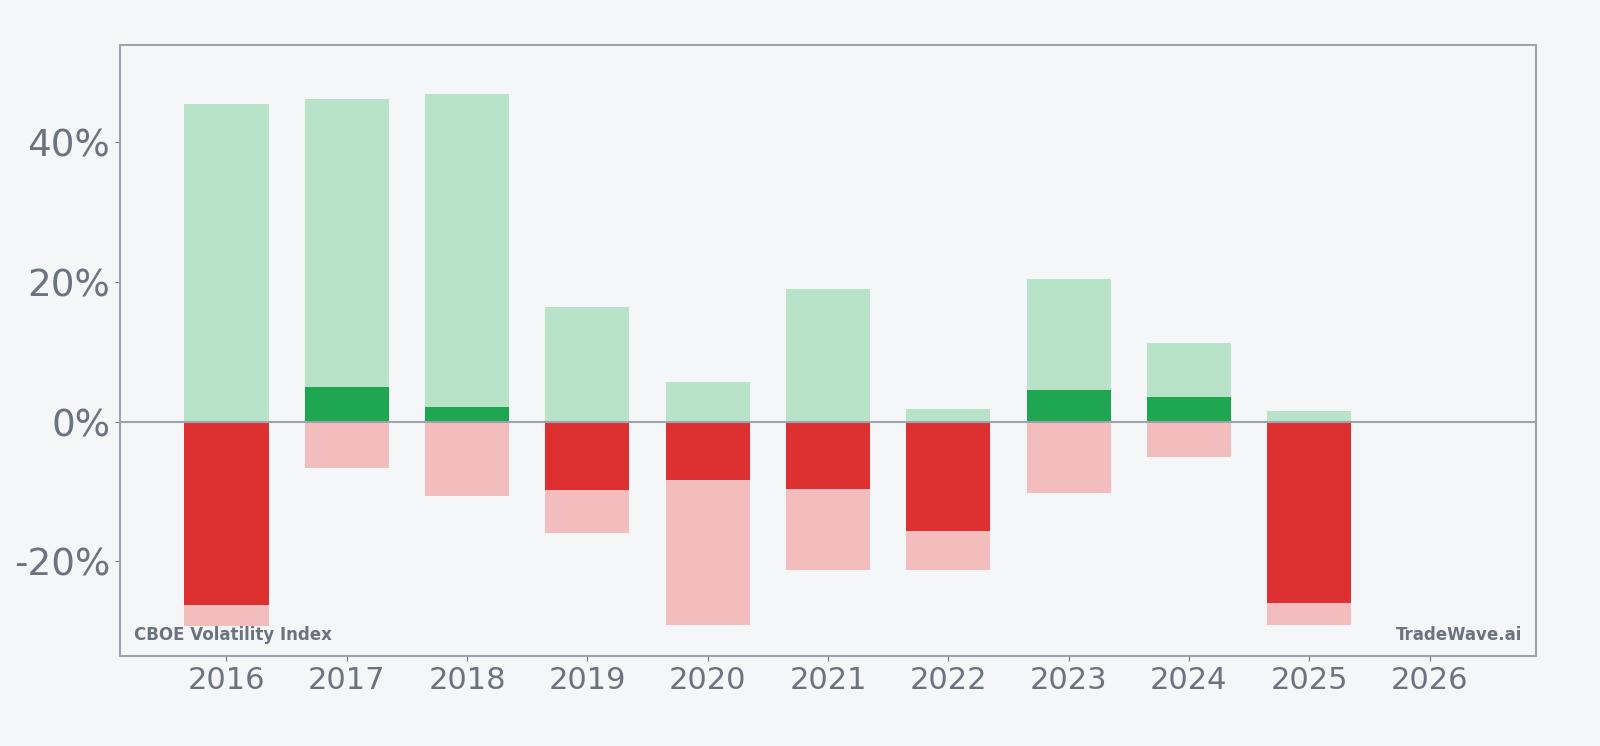
The maximum favorable and maximum adverse excursions underline how violent this window can be even when the final result looks tame. In several years, VIX logged peak run-ups of more than 40% from the entry level before settling much lower by the end of the window, while adverse drawdowns for shorts reached roughly 20% to 30% in the worst cases. That mix of large best-case and worst-case swings fits a volatility index that can gap on single headlines, and it explains why the TradeWave Ratio of 1.86 points to meaningful travel in the short direction even when closing levels do not fully capture the ride.
History does not guarantee future results; adverse excursions (MAE) can be large even in winning windows.
Why does CBOE Volatility Index (VIX) follow this seasonal pattern?
This late-June VIX seasonal pattern may reflect a mix of options expiration dynamics and institutional portfolio rebalancing as the second quarter wraps up. Analysts often point to summer liquidity thinning and a lighter earnings calendar as reasons equity markets can grind higher, which typically compresses implied volatility. At the same time, occasional macro or geopolitical shocks in this period can trigger the sharp spikes that show up as losing years for short VIX in the historical record.
What is driving CBOE Volatility Index (VIX) today?
VIX’s latest close at 22.22 leaves it about 37.0% below its 52-week high of 35.30 and roughly 66.0% above the 12-month low of 13.38, a mid-range level that still signals more stress than the ultra-calm regime seen last year.[1] The index has climbed 24.34% over the past month, a move that lines up with a series of geopolitical and policy scares that have kept hedging demand elevated.[2] On May 13, for example, VIX briefly popped to 19.01, the highest since late April, before fading into the close, underscoring how intraday volatility bursts have not always translated into sustained fear.[2] Earlier this year, analysts also highlighted VIX call structures as a way to underwrite a floor near 15 to 16, effectively betting that implied volatility would not stay pinned at last year’s lows in a world of policy uncertainty.[3]
Those cross-currents have left VIX trading in a higher but choppy band, even as sector-specific volatility, particularly in semiconductors, has at times run hotter than the index itself.[4] That divergence has encouraged some traders to buy S&P downside protection via VIX-linked products while selling options in frothier corners of the market, a classic relative-volatility trade.[4] Because VIX tends to fall when equities grind higher and jump when stocks sell off, the upcoming seasonal window will intersect directly with how investors digest second-quarter macro headlines and any surprise moves in rates or geopolitics.
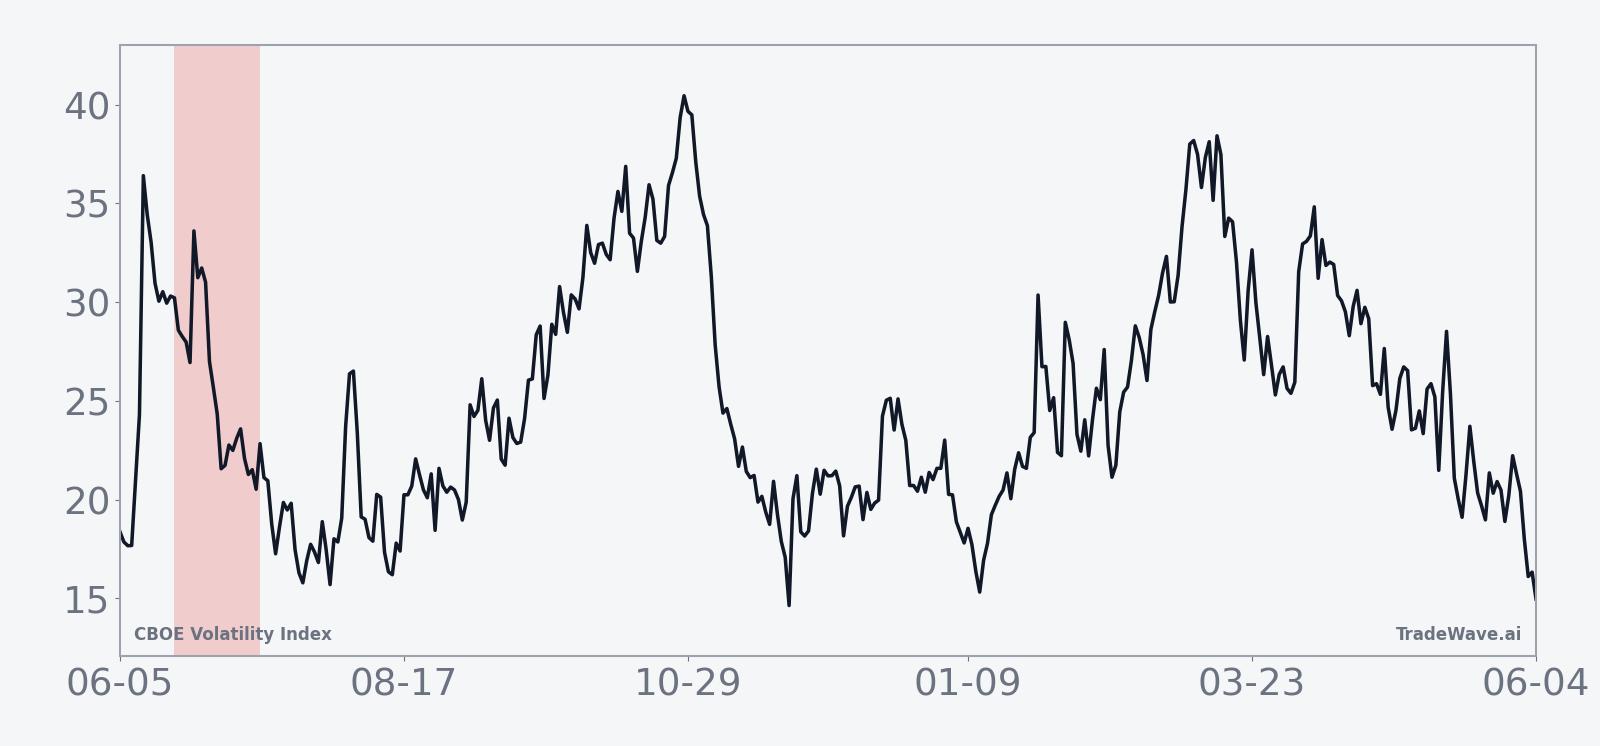
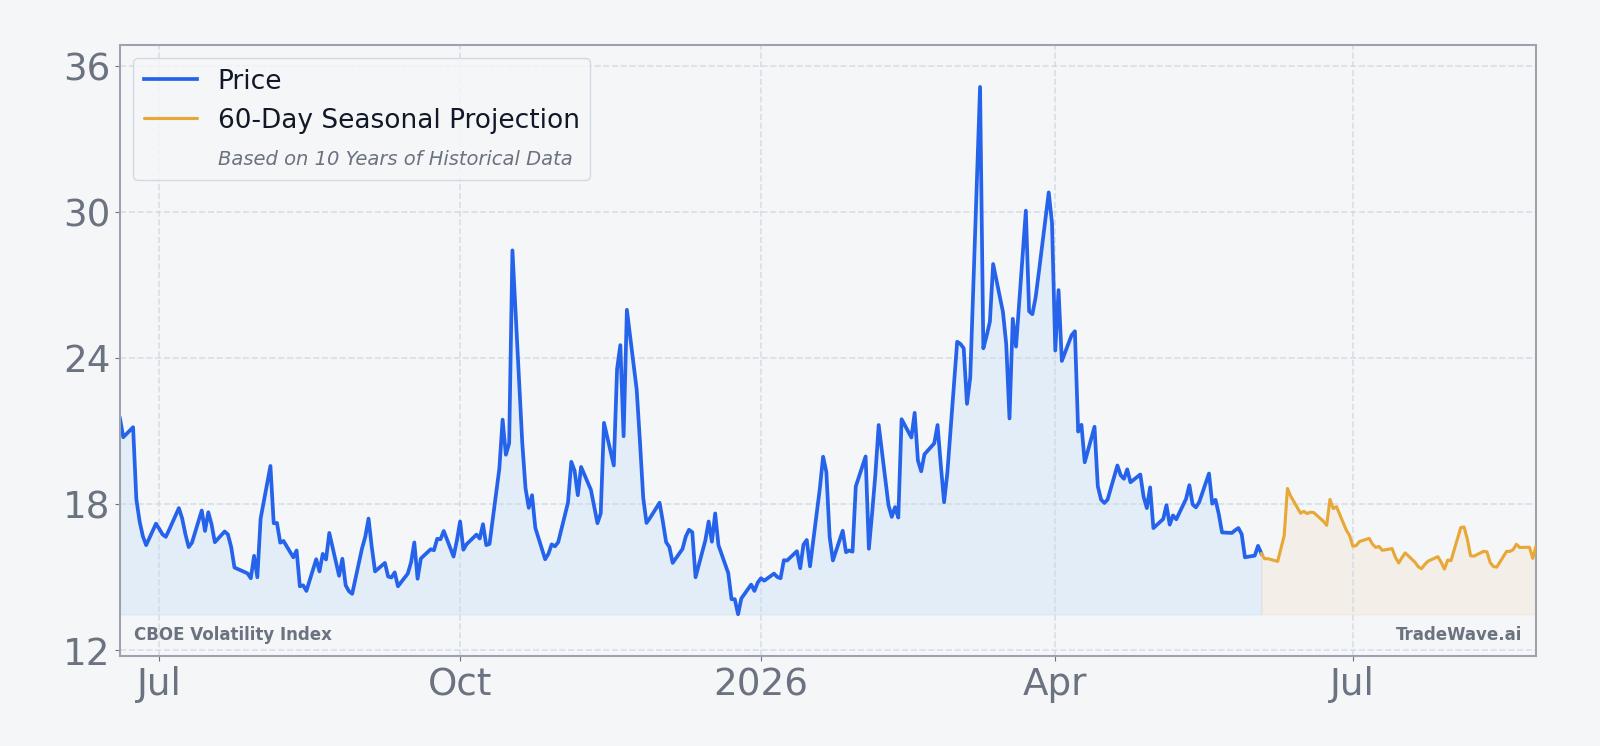
The chart below situates the latest move in its recent multi-month context and overlays the next 60 days of seasonal projections.
Sources
- [1] EODHD, "CBOE Volatility Index (VIX) daily quote and 52-week range," data as of Jun 10, 2026.
- [2] Reuters, "VIX briefly pops to highest since April then falls, showing muted daily move," May 13, 2026.
- [3] Reuters, "Investors advised to consider VIX call options as protection amid policy unpredictability," Jan 13, 2026.
- [4] Reuters, "VIX trades around 17 while sector vol spreads create hedging opportunities," May 7, 2026.
About this seasonal analysis
Seasonal pattern data is sourced from TradeWave.ai, which analyzes historical price behavior across annual calendar windows going back up to 30 years. Read the full data methodology or the book The 100-Year Pattern by Afshin Moshrefi (2026 edition). Past performance of seasonal patterns does not guarantee future results. This article is for informational purposes only and does not constitute investment advice.