10-of-11: Broadcom (AVGO) Enters a 342-Day Window That’s Usually Been a Big Winner
Broadcom is trading well below its 52-week high as it sits inside a long seasonal window that has historically delivered big upside but also sharp drawdowns for the AI chip leader.

Key takeaways
- Broadcom’s current 342-day seasonal window has produced gains in 91% of years, with 10 winners and 1 loser over the past decade.
- The long setup has averaged 50.01% gains in winning years, while the all-years average including the lone loss still sits at 45%.
- The window began on Mar 10, 2026 and historically behaves like a regime, not a short-term trade, spanning most of the year.
- Maximum favorable moves have topped 100% in several years, but adverse excursions have reached roughly 41% in the worst drawdown year.
- Broadcom trades at $335.97, about 18.7% below its 52-week high, after a huge AI-driven run in 2025 that left volatility elevated.[1]
- History shows this stretch has rewarded long exposure but with deep pullbacks along the way, making risk management as important as direction.
According to historical data from TradeWave.ai, this is one of the most distinctive long-duration windows in Broadcom’s calendar, and the next sections unpack how that backdrop lines up with today’s AI story.
Seasonal window
Broadcom has risen in 10 of the past 11 years during this 342-day window, with winning years averaging 50.01% gains and an all-years average of 45%. The current iteration of that window began on Mar 10 and finds the stock at $335.97, about 18.7% below its 52-week high of $413.03 and roughly 146% above its 52-week low of $136.46.[1] For a name that has already delivered triple-digit moves in some prior cycles, the combination of a strong long bias and large swings makes this stretch one traders tend to remember.
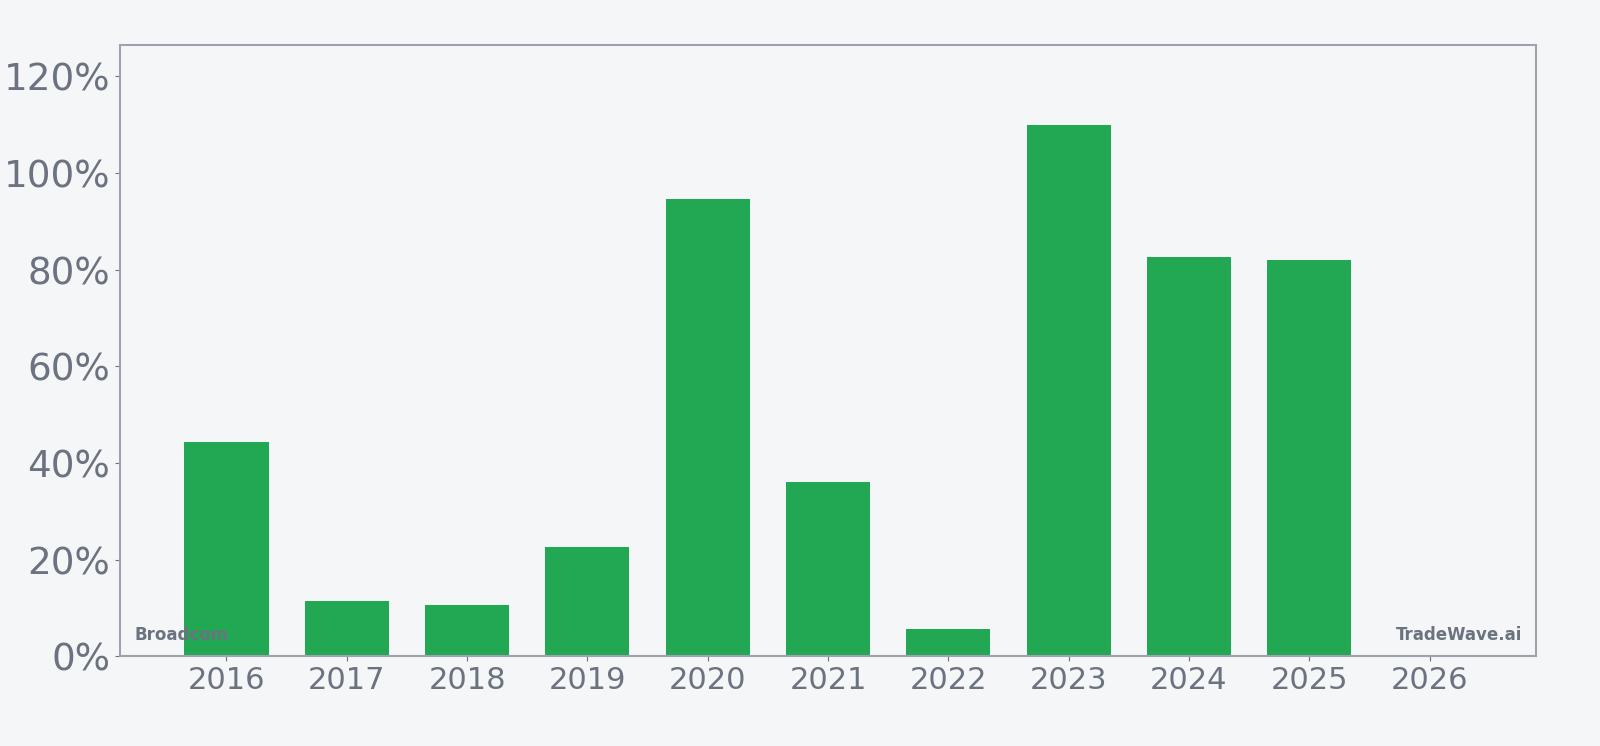
The trade direction for this pattern is long, and the track record is unusually strong for such a long regime. Across the past decade, 2016, 2019, 2020, 2021, 2023, 2024 and 2025 all posted double-digit or better gains inside this window, with 2020 up 94.55% and 2023 up 109.97%. The lone losing year was modest at a net loss of 1.93%, which is why the average loss figure is small compared with the size of the winners.
Average winner gains of 50.01% contrast with the 45% average when every year is included, which shows that even the weaker iterations have not dragged the long-term profile down much. The median profit of 36.15% sits between the mid-range years like 2016 and 2021 and the outliers like 2020 and 2023, suggesting that big rallies are not just one-off events. Annualized, the pattern clocks in at 40.42%, which is high for a window that spans most of the year.
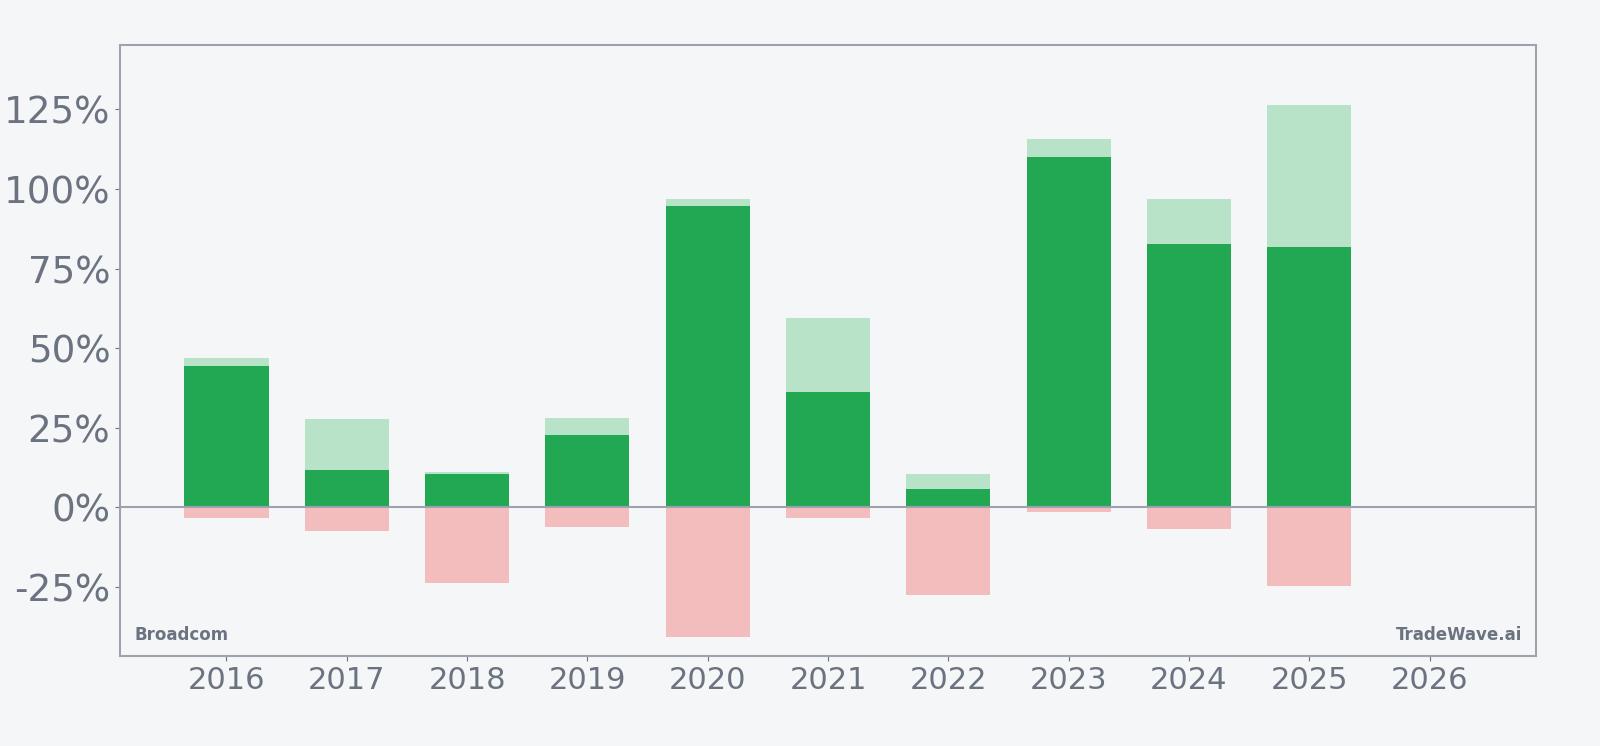
Intraperiod swings are large. In 2020, the maximum favorable move reached 96.8% while the worst drawdown from entry was about 40.79%. In 2018, the stock finished up 10.56% but suffered a 23.83% adverse move at one point. That mix of strong maximum favorable excursion and deep maximum adverse excursion is typical of a high-volatility winner: the stock often surges, but not in a straight line.
The per-year pattern also shows that some of the biggest upside years came after Broadcom had already rallied sharply into the window. In 2023, the stock nearly doubled with a 109.97% net gain and a 115.58% peak run-up, while the worst drawdown was only 1.5%. In 2024, the net gain was 82.64% with a 96.88% peak move and a 7% drawdown, a profile that looks more like a grind higher than a whipsaw.
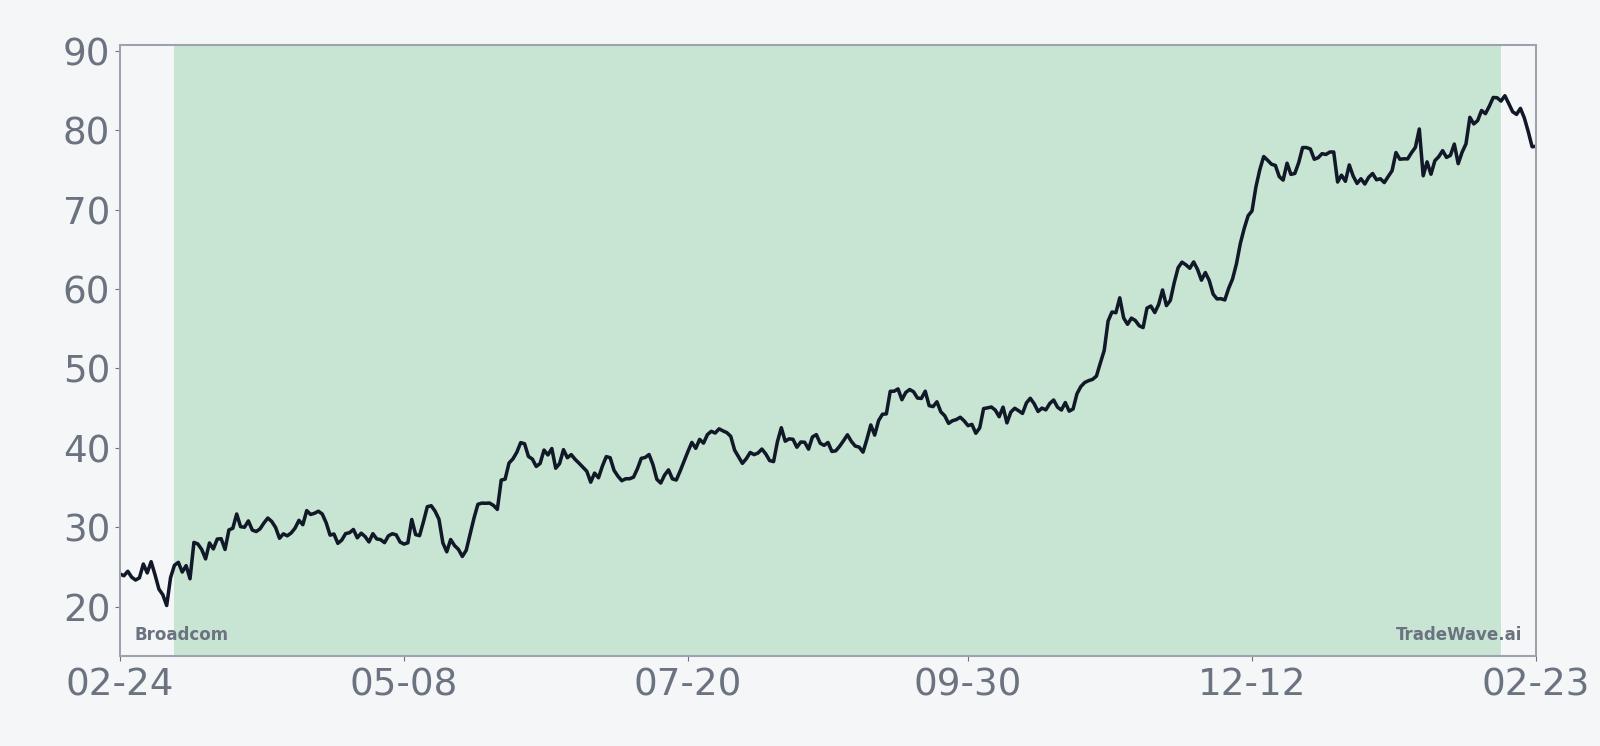
The 10-year average seasonal trend suggests that gains tend to build over the life of the window rather than arriving in a single burst. The curve slopes higher with periods of acceleration, especially in the middle and later parts of the regime, which lines up with the very strong outcomes in 2020, 2023 and 2024.
A stacked view of yearly net returns alongside peak rallies and worst drawdowns shows how much room Broadcom has historically had to run and to fall inside this stretch.
History does not guarantee future results; adverse excursions can be large even in winning windows, and Broadcom’s strongest years in this pattern have still included double-digit drawdowns.
Price and near-term drivers
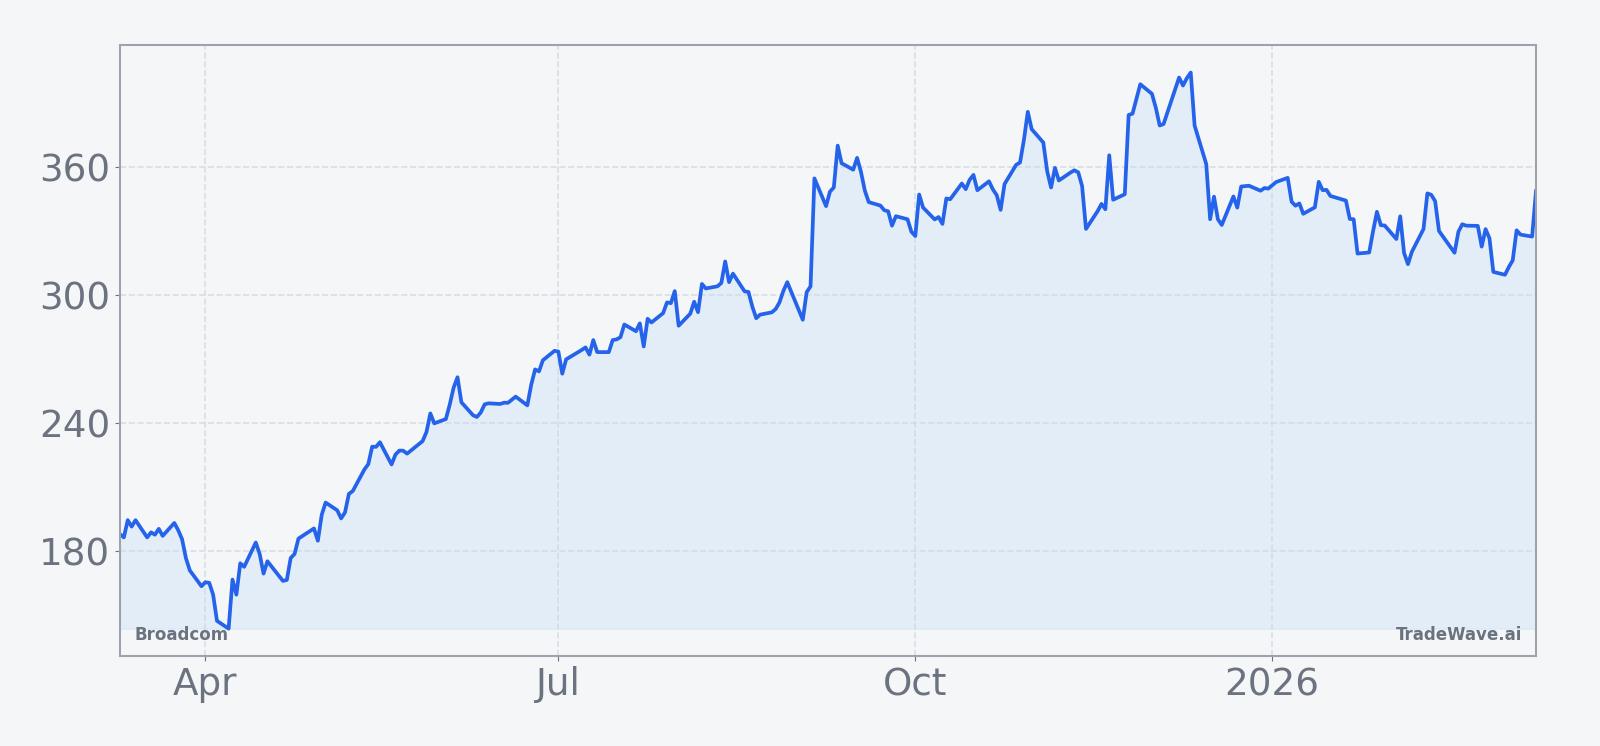
Broadcom closed at $335.97 on Mar 12, down 1.6% on the day, leaving the stock about 18.7% below its 52-week high of $413.03 and well above its 52-week low of $136.46 on heavy volume of roughly 21.3 million shares.[1] The pullback comes after a huge AI-driven run in 2025, when Broadcom’s stock more than doubled as investors chased exposure to custom AI chips and networking hardware tied to hyperscale data centers.[1]
In October 2025, Broadcom reported Q3 fiscal 2025 results that beat expectations, with earnings per share of $1.69 versus $1.66 expected and revenue of $16 billion versus $15.82 billion, helped by surging AI demand.[1] Earlier that year, in June 2025, the company had already posted 20% year-over-year sales growth on $15.0 billion of Q2 revenue, reinforcing the idea that AI was becoming a structural driver rather than a one-off spike.[2]
By late 2025, the AI story had only intensified. On Sep 14, 2025, Broadcom announced a new $10 billion customer deal, widely linked to custom AI chips, which helped cement its position as a key supplier to large-scale AI projects.[3] On Oct 30, 2025, the company followed up with a high-profile AI-driven partnership with OpenAI for custom chips and networking solutions, a deal that pushed the stock up 13% and underscored Broadcom’s role at the center of the AI infrastructure build-out.[3]
Broadcom’s earnings cadence into the end of 2025 showed how quickly AI revenue was scaling. On Oct 11, 2025, the company reported record Q3 fiscal 2025 revenue of $15.9 billion, up 22% year over year, with AI revenue up 63% to $5.2 billion.[4] On Dec 11 and Dec 12, 2025, Broadcom reported that Q4 fiscal 2025 revenue had climbed to $18.0 billion, up 28% year over year, with AI semiconductor revenue up 74%, even as investors fretted about margins and backlog sustainability.[5][6][7]
Guidance into fiscal 2026 kept the bar high. In mid-December 2025, Broadcom said it expected AI semiconductor revenue to double year over year to $8.2 billion in the first quarter of fiscal 2026 and projected about $20 billion of AI revenue for fiscal 2025 with potential to reach $45 billion in fiscal 2026.[5] That kind of growth profile helped justify the stock’s earlier 110% jump over the prior year, but it also raised the stakes for every subsequent earnings print.[1]
Analysts have generally stayed constructive. Across coverage from Forbes and Seeking Alpha contributors, Broadcom carries a Buy consensus rating with a cited price target around $372.33, although those targets were set when the stock was trading in a different regime in 2025 and may not fully reflect the latest volatility.[1][2][9] Sector commentary from CNBC and Forbes has repeatedly framed Broadcom as a leader in AI chips and infrastructure software, with revenue growth outpacing many peers.[3][14]
Macro-wise, the big theme is still AI demand. Coverage in October and December 2025 emphasized that rising demand for AI semiconductors and networking solutions was fueling Broadcom’s growth, even as investors debated how long hyperscale spending could stay this hot.[1][5][14] Within the semiconductor group, Broadcom has been described as “firing on all cylinders,” with Wall Street crowding into the name as a way to play both AI chips and infrastructure software in one package.[14]
The chart below situates the latest move in its recent multi-month context.
Valuation and positioning check
Valuation metrics for Broadcom are not detailed in the available data, but the combination of a Buy consensus rating and aggressive AI revenue guidance suggests the market is still willing to pay up for growth.[1][2][5] At the same time, the stock’s roughly 18.7% gap to its 52-week high and its 1.98% one-month decline hint at some digestion after the 2025 surge, which can matter when a long seasonal window with a strong upside bias is already in motion.[1]
From a positioning standpoint, prior coverage highlighted that Broadcom’s stock had jumped 110% over a year and saw a 13% weekly surge around the OpenAI deal, signaling heavy demand from both fundamental and momentum investors.[1][3] That kind of crowding can amplify both rallies and pullbacks inside a high-volatility seasonal regime like the current one.
What to watch in this window
For traders tracking this 342-day window, the first checkpoint is how Broadcom behaves on pullbacks. Historically, even strong years like 2020 and 2018 saw adverse moves of roughly 41% and 24% from entry before finishing higher, so the path has rarely been smooth. If the stock can hold above key prior support zones on any future dips while AI revenue continues to scale, that would be consistent with the long-biased seasonal pattern.
Earnings and guidance will remain the main catalysts. The company has already set a high bar with expectations for AI semiconductor revenue to double year over year in early fiscal 2026 and potentially reach $45 billion for the full year.[5] Any sign that hyperscale customers are delaying orders or that margins are compressing faster than expected would test both the seasonal tendency and the growth narrative that powered the 2025 run.
Levels matter too. On the upside, traders will be watching how Broadcom behaves as it approaches the prior 52-week high near $413.03, a zone that previously attracted profit-taking.[1] On the downside, the depth and speed of any drawdowns inside this window will be compared with past maximum adverse excursions to gauge whether volatility is tracking the historical pattern or breaking it.
Finally, sector and macro headlines around AI spending will shape how much of the historical upside potential Broadcom can tap. If cloud and AI infrastructure budgets stay robust and Broadcom continues to win large custom chip deals, the long seasonal bias has a supportive backdrop. If spending slows or competition intensifies, the same high-volatility profile that produced big winners in prior years could translate into sharper downside swings this time around.
Sources
- [1] Forbes – “AVGO: Why Broadcom Stock Jumped 110%” (Oct 17, 2025)
- [2] Seeking Alpha – “Broadcom Stock: Poised To Surge To New Highs” (Jun 8, 2025)
- [3] Forbes – “Is AVGO Stock Beating Competition?” (Oct 30, 2025)
- [4] Forbes – “Broadcom Reports Record Q3 FY2025 Revenue” (Oct 11, 2025)
- [5] Seeking Alpha – “Broadcom: Market Sweating The AI Details” (Dec 15, 2025)
- [6] Yahoo Finance – “Broadcom Smashes Q4 Estimates” (Dec 12, 2025)
- [7] The Wall Street Journal – “Broadcom Beats Revenue and Profit Forecasts” (Dec 11, 2025)
- [9] Seeking Alpha – Analyst commentary on AVGO rating and targets (Jun 8, 2025)
- [14] CNBC – “Broadcom is Firing on All Cylinders” (Dec 8, 2025)