Eight Straight Wins: Carnival (CCL) Nears a 41-Day Bearish Window for Short-Side Traders
Carnival shares are trading well below last year’s highs as a historically bearish 41-day stretch approaches, putting a sharp seasonal short-side pattern on traders’ radar just as cruise demand stays strong.

Key takeaways
- A 41-day seasonal window for Carnival starting Mar 16 has favored short positions in every one of the past eight years, with a 100% win rate for the short-side pattern.
- The average profit across those eight short trades is 5.14%, with cumulative gains of 48% and a Sharpe ratio of 1.14, pointing to a consistent downside bias in this slice of the calendar.
- Intraperiod swings have been large: historical best-case rallies in the trade direction have reached more than 30%, while worst-case adverse moves have approached 46% in extreme years.
- Carnival closed Friday at $23.99, about 29.5% below its 52-week high of $34.03, after a double-digit slide over the past month as investors reassess how much of the cruise rebound is already priced in.[3]
- Strong demand, record bookings and higher profit guidance have supported the fundamental story, but the stock has still shown a tendency to weaken in this upcoming window in prior years.[4][5]
- History suggests this period can deliver quick moves in both directions, so traders watching the window should be prepared for volatility even if the ultimate outcome has skewed lower for the stock.
According to historical data from TradeWave.ai, this mid-March stretch has behaved very differently from an average month for Carnival. The next section looks at how that pattern has played out across the past eight years and what it means as the 2026 window opens.
Seasonal window
Carnival has produced profitable short-side trades in all 8 of the last 8 years during this 41-day window, with average gains of 5.14% for the pattern. The next iteration begins on Mar 16, with the stock last closing at $23.99, about 29.5% below its 52-week high of $34.03 and down 12.3% over the past month. That combination of a clean seasonal record and a stock already under pressure is why this window is drawing extra attention ahead of Monday’s open.
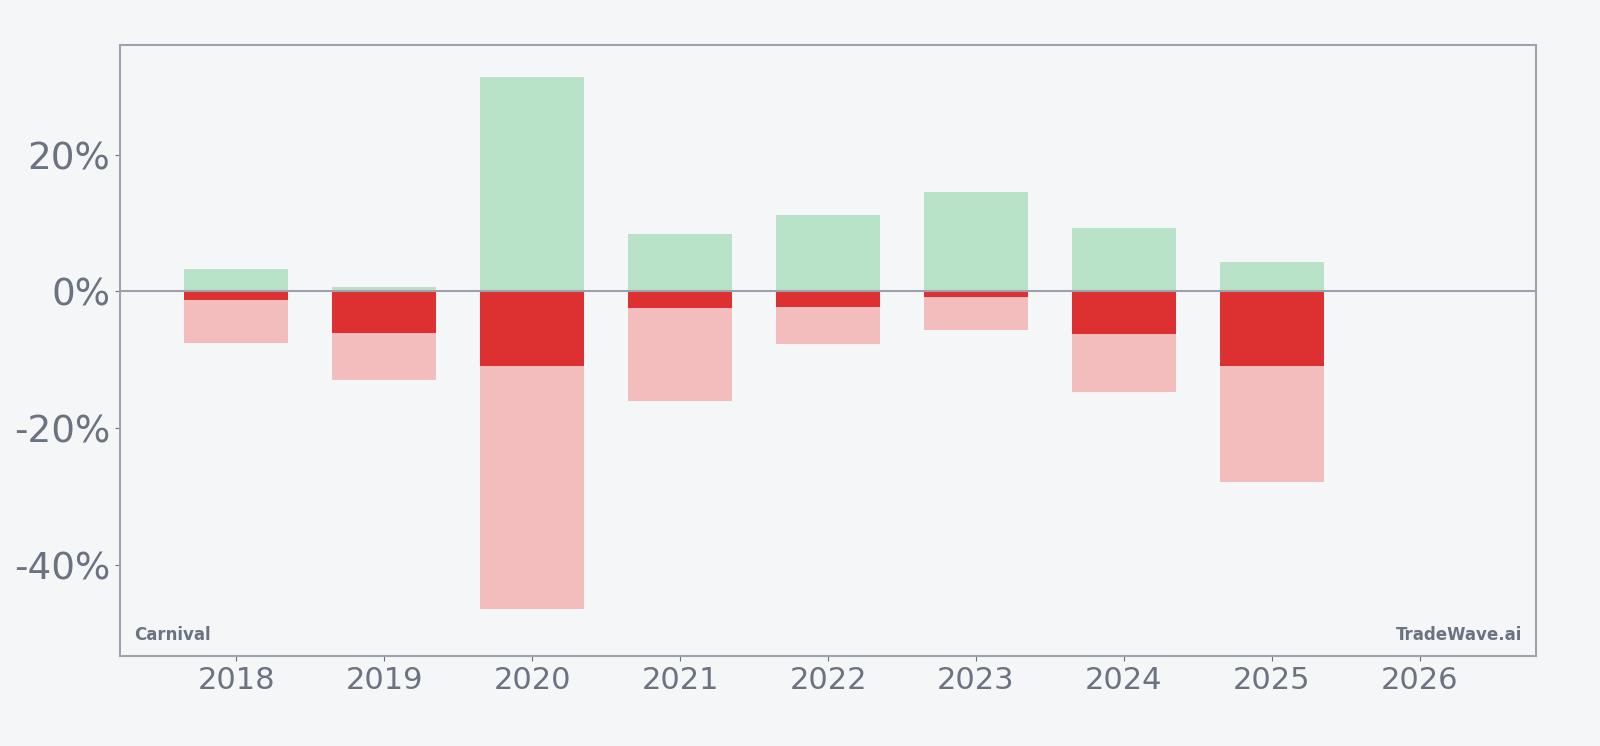
A second view layers in both the best and worst intraperiod swings for each year.
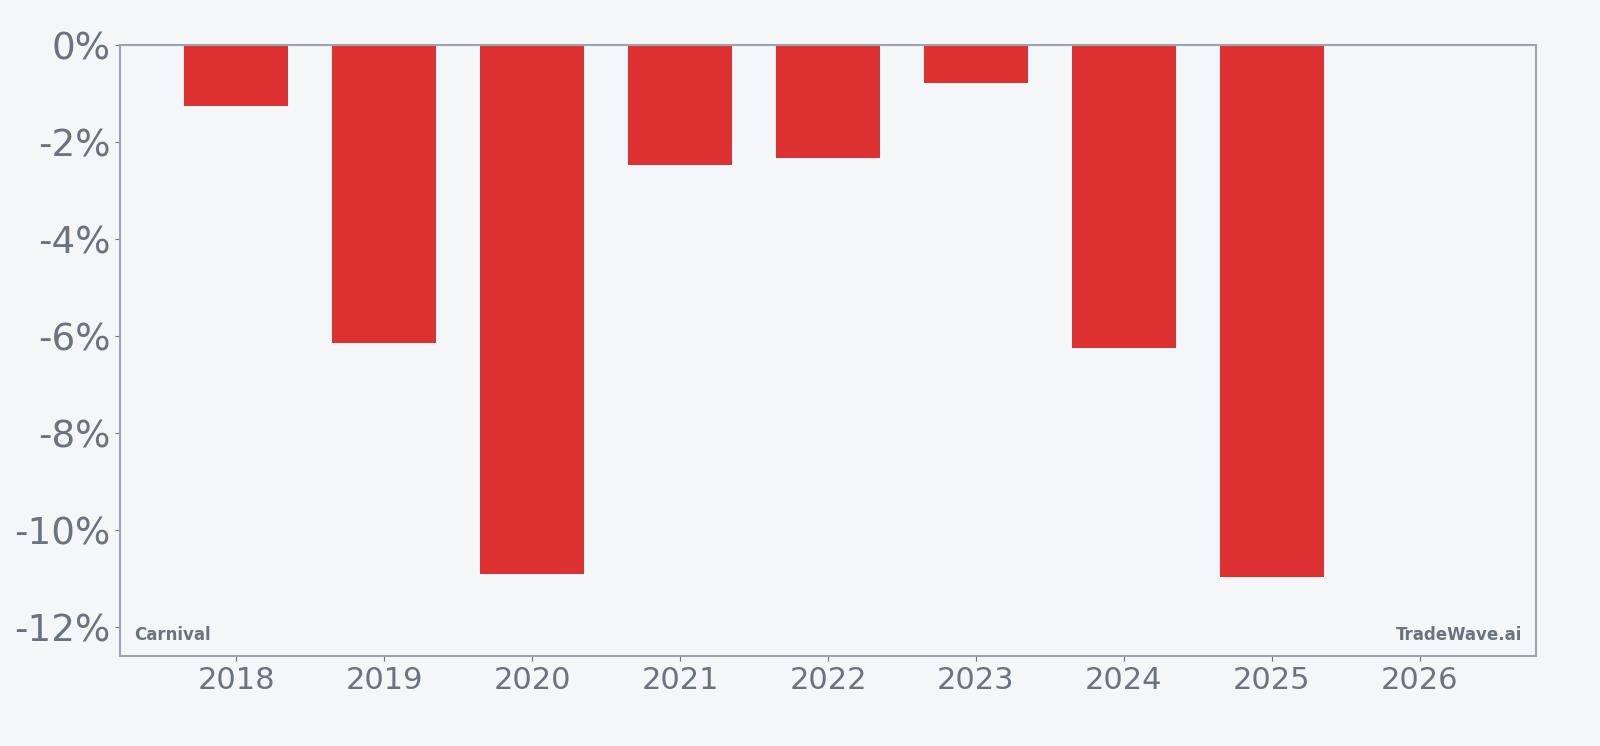
Across the full eight-year sample, the pattern is unambiguous: every iteration of this window has ended with Carnival lower, which is favorable for the short-side setup. Percent Profitable sits at 100%, with 8 winners and 0 losers, and the average profit of 5.14% lines up closely with the 5% all-years average, since there have been no losing years in the sample. The median outcome of 4.31% shows that even the middle-of-the-pack years have delivered meaningful downside for the stock.
The per-year breakdown shows a mix of modest and sharp declines. The strongest year for the pattern was 2020, when the short trade finished up 10.91% as the stock fell from an entry around $14.57 to an exit near $12.98 during a period of intense pandemic volatility. The softest outcome was 2023, when the net move was still negative at 0.78%, but the stock’s path included a sizable intraperiod rally before rolling over again.
Volatility inside the window has been significant. Maximum favorable excursions, which capture the best point-to-peak move in the trade direction, have ranged as high as 31.37% in 2020 and 14.56% in 2023, showing that when the stock breaks lower in this stretch it can do so quickly. Maximum adverse excursions, which measure the worst drawdown from entry, have been just as striking on the other side, with a 46.47% adverse move in 2020 and a 27.86% adverse move in 2025 before the pattern ultimately finished in the money for shorts.
The TradeWave Ratio of 1.24 indicates that, on average, price has tended to travel meaningfully in the trade direction within the window, independent of where it closes. Combined with a Sharpe ratio of 1.14 based on end-of-window outcomes, the profile looks like a consistent but bumpy ride for bears: the direction has been reliable, but the path has often involved sharp countertrend rallies before the short-side edge reasserted itself.
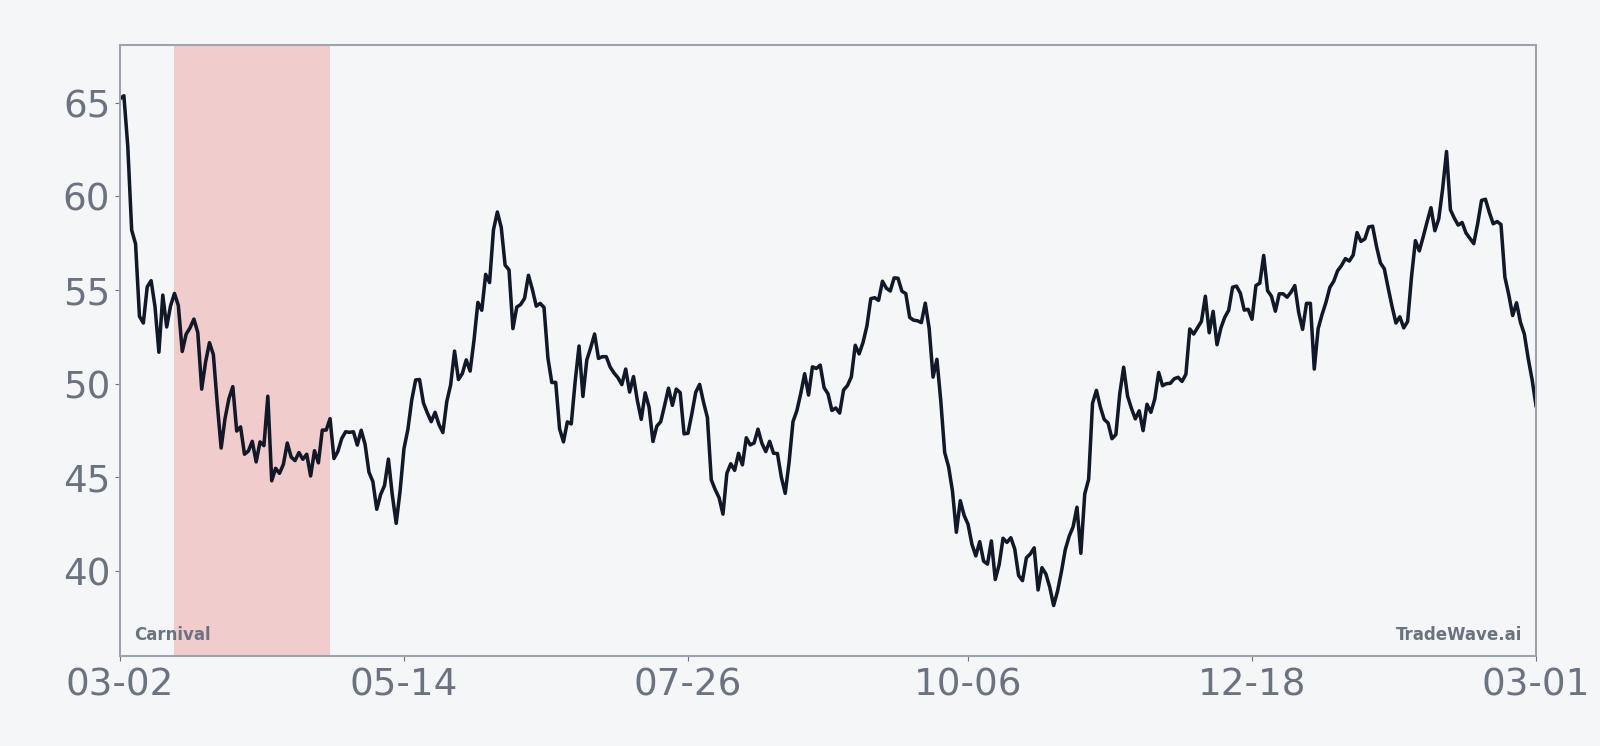
The seasonal trend chart suggests that weakness has not been confined to a single part of the window. In several years, the stock has drifted lower early, then accelerated into the back half. In others, such as 2019 and 2025, the deeper adverse moves came first, with the stock squeezing higher before rolling over later in the period. The cumulative return line across all years still slopes steadily in favor of shorts, which is why this particular slice of the calendar stands out.
History does not guarantee future results; adverse excursions can be large even in winning windows, and traders using this pattern should be prepared for sharp countertrend moves.
Price and near-term drivers
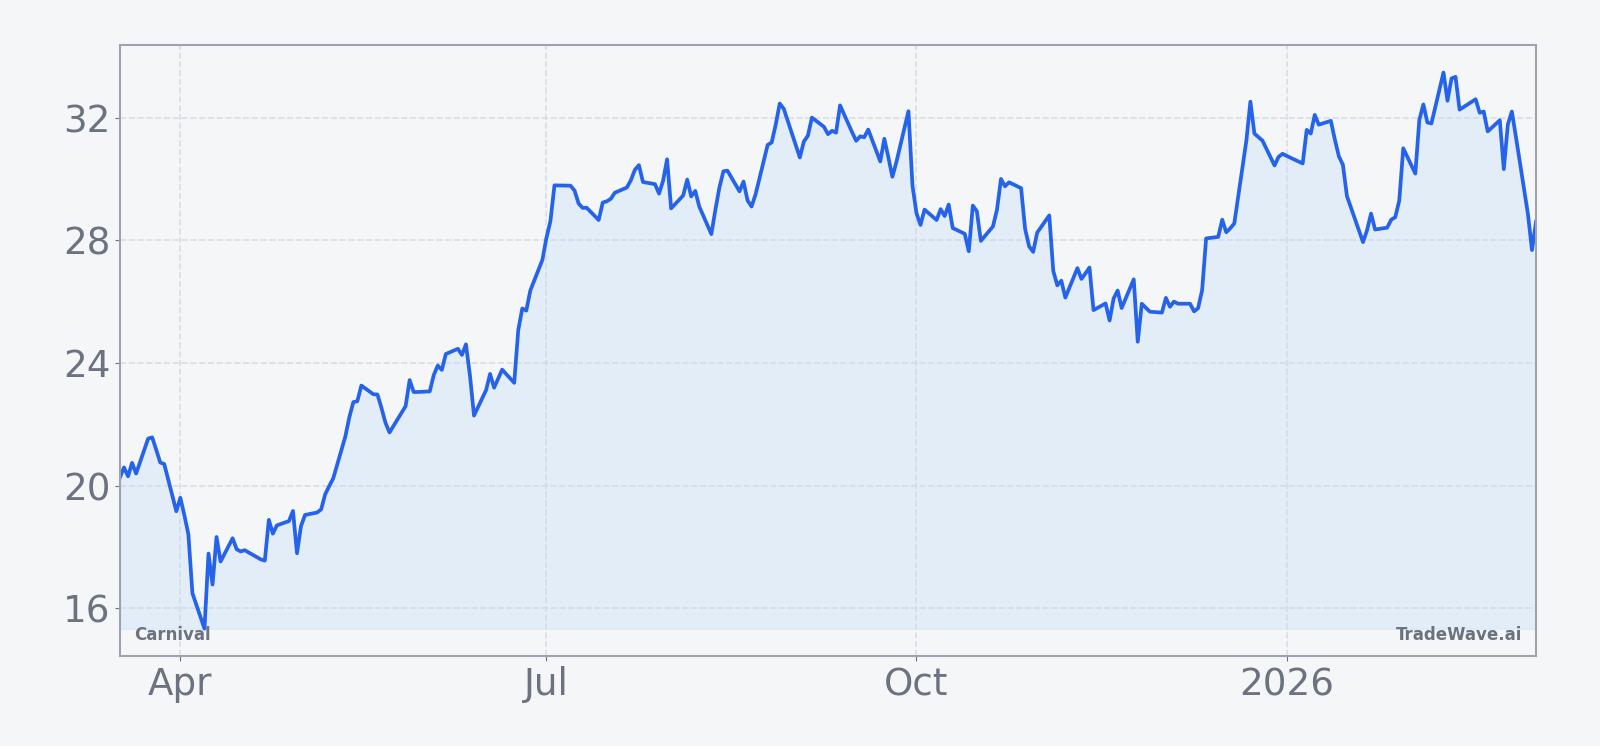
Carnival closed Friday at $23.99, up 0.3% on the day, after trading between $23.78 and $24.83 on volume of about 22.9 million shares. That leaves the stock roughly 29.5% below its 52-week high of $34.03 and about 59.2% above its 52-week low of $15.07, with a 12.3% slide over the past month underscoring how quickly sentiment can swing in the name.[3]
In early March, analysis from Forbes highlighted that Carnival shares had already climbed sharply over the prior year, helped by a powerful rebound in cruising and improving balance sheet metrics, but also flagged that the stock’s pullback reflected concerns about how much of that recovery was already priced in.[3] The recent drop has taken Carnival back toward levels seen before last summer’s rally, even as the fundamental story has continued to improve.
In June 2025, Reuters reported that Carnival raised its annual profit target on the back of steady cruise demand, record revenue and high customer deposits, signaling that pricing power and occupancy were running ahead of earlier expectations.[4] By late September 2025, the company again lifted its profit forecast, pointing to resilient demand and stronger-than-expected margins as it guided investors toward adjusted earnings per share of about $2.14 for fiscal 2025.[5] Those upgrades helped cement the view that the post-pandemic recovery in cruising had moved from “hope” to “execution.”
Forbes coverage in mid-2025 framed the stock’s earlier 40% rise as a catch-up move after deep pandemic-era losses, but also noted that leverage and sensitivity to discretionary spending left Carnival exposed if macro conditions softened.[6] Another Forbes piece at the end of September 2025 weighed whether investors should “buy or fear” the stock, pointing to both the upside from strong bookings and the downside from any slowdown in consumer travel budgets or renewed pricing pressure.[8]
On the trading side, Carnival has periodically appeared on lists of stocks making notable intraday moves. In December 2025, CNBC highlighted the name among the biggest midday movers, reflecting bursts of volume as investors reacted to headlines and repositioned around the cruise story.[9] Those episodes underline how quickly liquidity can concentrate in the stock when sentiment shifts, a dynamic that can amplify both rallies and selloffs during a volatile seasonal window.
Macro conditions have been broadly supportive. Lower interest rates and strong consumer demand have helped underpin cruise bookings, giving Carnival room to push pricing and rebuild profitability.[2] Sector commentary has emphasized that high cruise demand and record bookings are driving revenue growth across the industry, with Carnival a key beneficiary as it fills ships at higher yields.[4] The question for equity investors is less about whether ships are sailing and more about how much of that strength is already embedded in the share price.
Analyst sentiment has generally leaned constructive. Coverage cited by Motley Fool has characterized the stock as a Buy, reflecting confidence in the earnings recovery and the company’s ability to manage debt as cash flows improve.[2][3] At the same time, the lack of a clear, up-to-date consensus price target underscores how quickly the stock’s trajectory has changed over the past year, with sharp rallies and pullbacks complicating valuation calls.
The chart below situates the latest move in its recent multi-month context.
What to watch as the window opens
The seasonal record says this 41-day stretch has been a reliable headwind for Carnival, but the setup heading into 2026 is more nuanced. The stock is already well off its highs, the cruise business is running at record revenue and margins, and management has raised profit guidance multiple times over the past year.[4][5] That mix of strong fundamentals and a historically weak calendar window creates a clear tension for traders.
First, watch how the stock behaves around the Mar 16 start date. In several past years, the biggest adverse moves for shorts came early, with the stock squeezing higher before rolling over later in the window. If Carnival rallies sharply in the opening days, that would be consistent with the historical pattern of large maximum adverse excursions, even in years that ultimately finished lower.
Second, earnings and booking commentary will matter. The next scheduled earnings release is on Dec 18, 2025, so this particular window will not include a quarterly report, but investors will still parse any booking updates or pricing color from management and competitors.[1] Stronger-than-expected demand data could blunt the seasonal downside bias, while any hint of softening consumer appetite or discounting could reinforce it.
Third, monitor volume and intraday swings. Past episodes where Carnival appeared among the biggest midday movers have coincided with concentrated trading and fast price action.[9] If similar bursts of activity show up again during this window, they could mark inflection points where the seasonal pattern either reasserts itself or breaks down.
Finally, keep an eye on levels. The 52-week low near $15.07 and the recent one-month slide provide natural reference points for how much additional downside the market is willing to price in.[3] A move that respects those levels while showing the kind of choppy, two-way action seen in prior years would line up with the historical pattern. A clean break higher through resistance, sustained by strong demand headlines, would be a clear sign that this particular iteration of the window is behaving differently from the last eight.
Sources
- [1] Forbes – “Is CCL Stock Likely To Beat Earnings?” (Dec 17, 2025)
- [2] Forbes – “Is Carnival Stock A Buy After The Recent 8% Slide?” (Mar 3, 2026)
- [3] Forbes – “Is Carnival Stock A Buy After The Recent 8% Slide?” (Mar 3, 2026)
- [4] Reuters – “Carnival hikes annual profit target on steady cruise demand” (Jun 24, 2025)
- [5] Reuters – “Carnival raises annual profit forecast on resilient cruise demand” (Sep 29, 2025)
- [6] Forbes – “After 40% Rise, What's Next For Carnival Stock?” (Jun 30, 2025)
- [8] Forbes – “Buy Or Fear Carnival Stock?” (Sep 30, 2025)
- [9] CNBC – “Stocks making the biggest moves midday” (Dec 19, 2025)