12-of-13 Midterm Wins: Chevron Corporation (CVX) Nears a 37-Day Election-Year Run
Chevron Corporation is heading toward a historically strong 37-day midterm-election seasonal window just as the stock trades near record highs and investors digest softer profits and Venezuela risk.

Key takeaways
- Chevron Corporation has risen in 12 of the last 13 midterm-election windows starting around Apr 5, a 37-day stretch with a long trade direction.
- The upcoming window runs from Apr 5, 2026 and historically delivered an average 6.44% gain in winning years, with a 6% average when all years are included.
- Percent Profitable sits at 92%, with 12 winners and just 1 loser across the sample, and a Sharpe ratio of 1.47 for this pattern.
- The TradeWave Ratio of 2.48 signals that price has typically traveled meaningfully in the long direction inside the window, even when final closes were smaller.
- Intraperiod swings have included sizable drawdowns in some years, so traders have historically faced meaningful downside before rallies developed.
- CVX is trading about 1.0% below its 52-week high after a roughly 10% one-month run, while Big Oil profits have recently been squeezed by softer crude prices.[1]
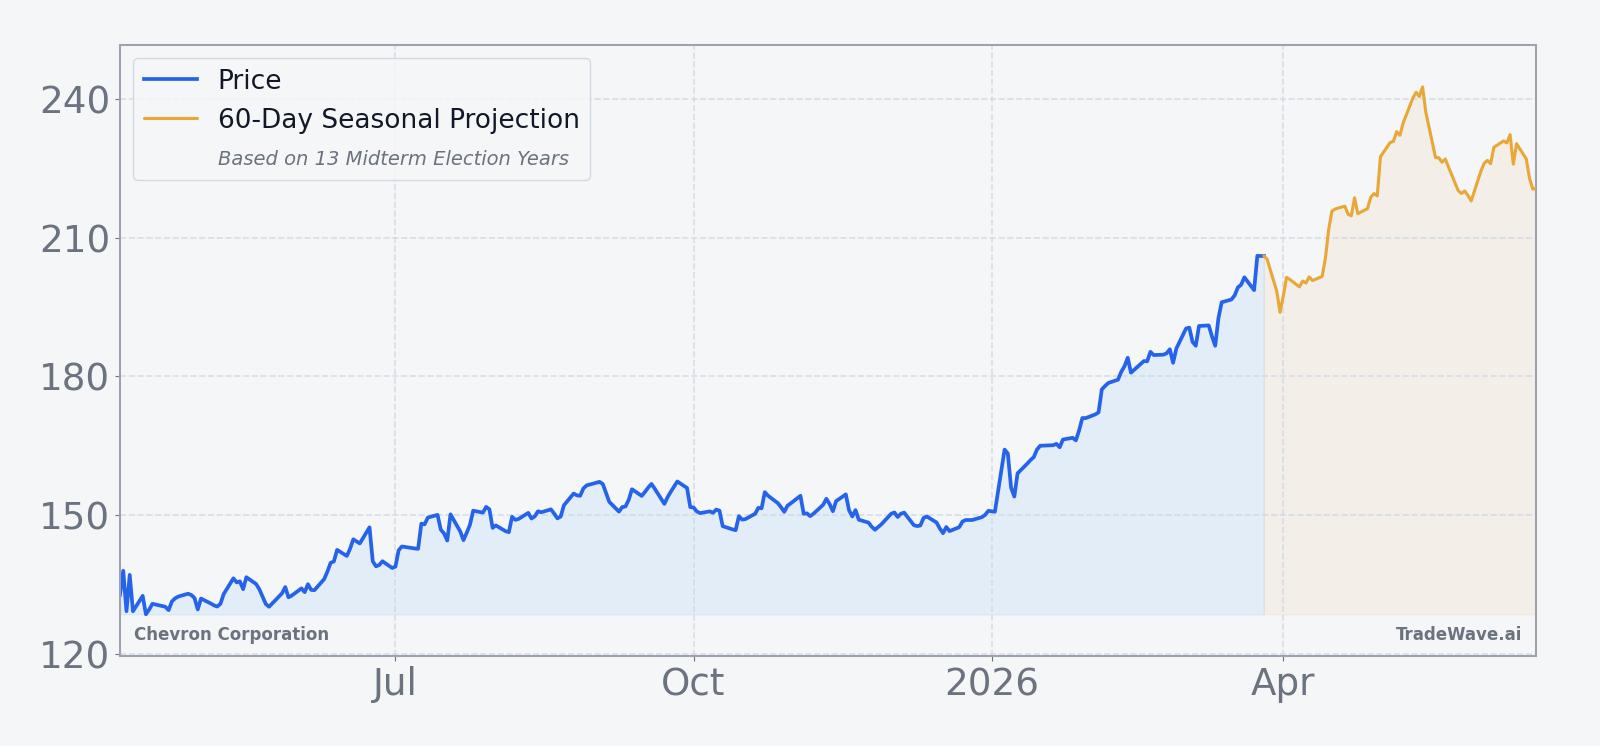
According to historical data from TradeWave.ai, this specific midterm-election window for Chevron behaves very differently from an average spring, with a distinct directional bias that most investors never see in standard charts.
Seasonal window
Chevron Corporation has risen in 12 of the last 13 midterm-election windows that begin around Apr 5, averaging 6.44% gains for winning years over a 37-day stretch. The next iteration of that window starts on Apr 5, 2026, with the stock currently at $196.82, about 1.0% below its 52-week high of $198.88 after a 10.03% gain over the past month. That combination of a strong historical spring pattern and a stock already pressing record territory gives this window unusual weight for traders trying to time energy exposure.
The pattern is built on the last 13 midterm election years, a phase of the presidential cycle when policy risk often shifts from campaign promises to legislative gridlock. For an integrated oil major like Chevron, that backdrop has historically meant less headline-driven regulatory shock and more focus on execution, capital discipline and commodity prices, which can help a steady operator shine in relative terms.
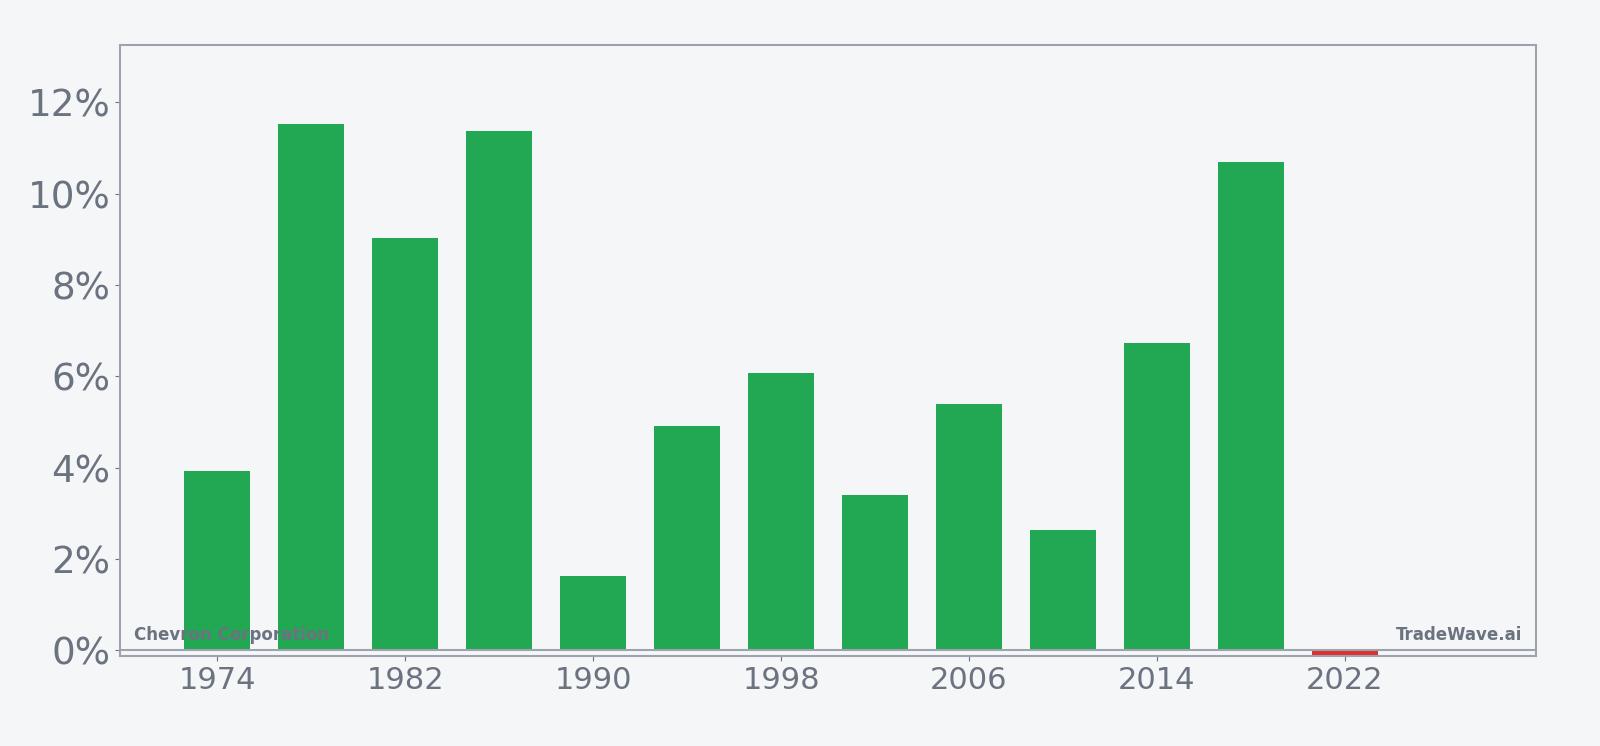
Historically, this 37-day window has been a strong stretch for long exposure in Chevron. Percent Profitable is 92%, with 12 winning years and only 1 losing year, and the all-years average outcome still clocks in at 6% despite that lone down period. The median gain of 5.39% sits close to the average, which suggests the wins have not been driven by a single outlier year but by a cluster of solid advances.
Average profit in the winning years is 6.44%, while the average loss across down years is a modest -0.12%, so the payoff profile has skewed positively for longs. In other words, when this window has worked, it has tended to deliver mid-single-digit to low-double-digit gains, and when it has failed, the damage at the end of the window has historically been limited.
The per-year table shows that some of the strongest runs came in 1986, 2018 and 1998, with net returns of 11.37%, 10.7% and 6.08% respectively. The weakest outcome was 2022, which finished the window down just -0.12% despite a maximum favorable move of 6.84% and a maximum adverse move of -7.35% during the period. That year is a reminder that even in a pattern dominated by winners, intraperiod swings can be sharp in both directions.
The historical seasonal trend line slopes higher through most of the window, with gains tending to build rather than spike and fade. Early days often see modest chop, followed by a more persistent climb into the back half of the period, which fits a profile where investors gradually re-rate the stock as macro and policy noise settles.
A combined view of net returns and intraperiod swings shows how upside and downside have coexisted inside this window.
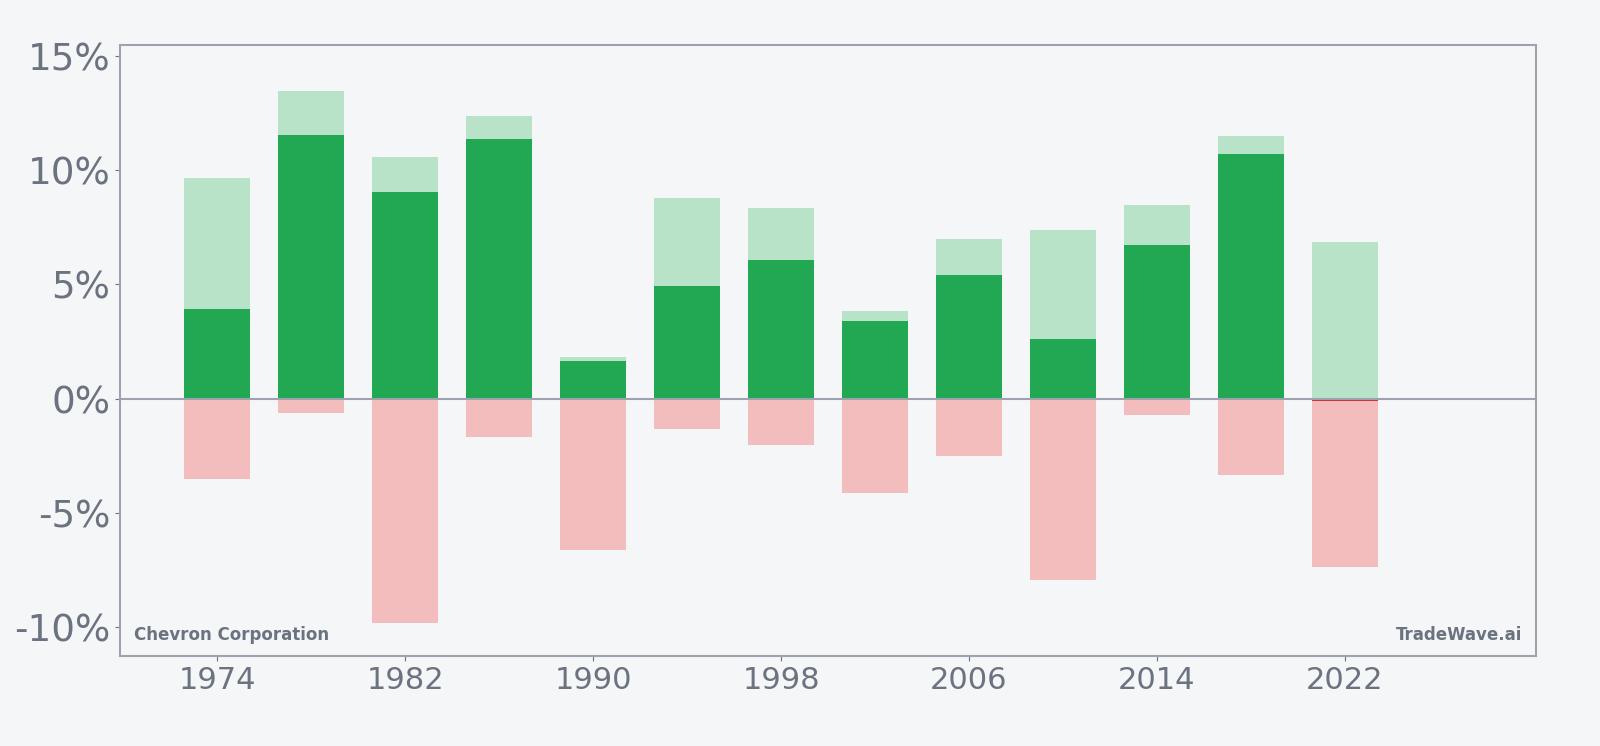
The stacked net, maximum favorable excursion and maximum adverse excursion bars show that even in winning years, Chevron has often dipped several percent before turning higher, while peak run-ups have frequently stretched into high single digits. That mix of sizable MFE and non-trivial MAE fits a high-conviction but not low-volatility pattern: the window has usually rewarded patience in the long direction, but it has not been a smooth ride.
History does not guarantee future results; adverse excursions can be large even in winning windows, and past seasonal strength does not ensure similar outcomes in 2026.
Price and near-term drivers
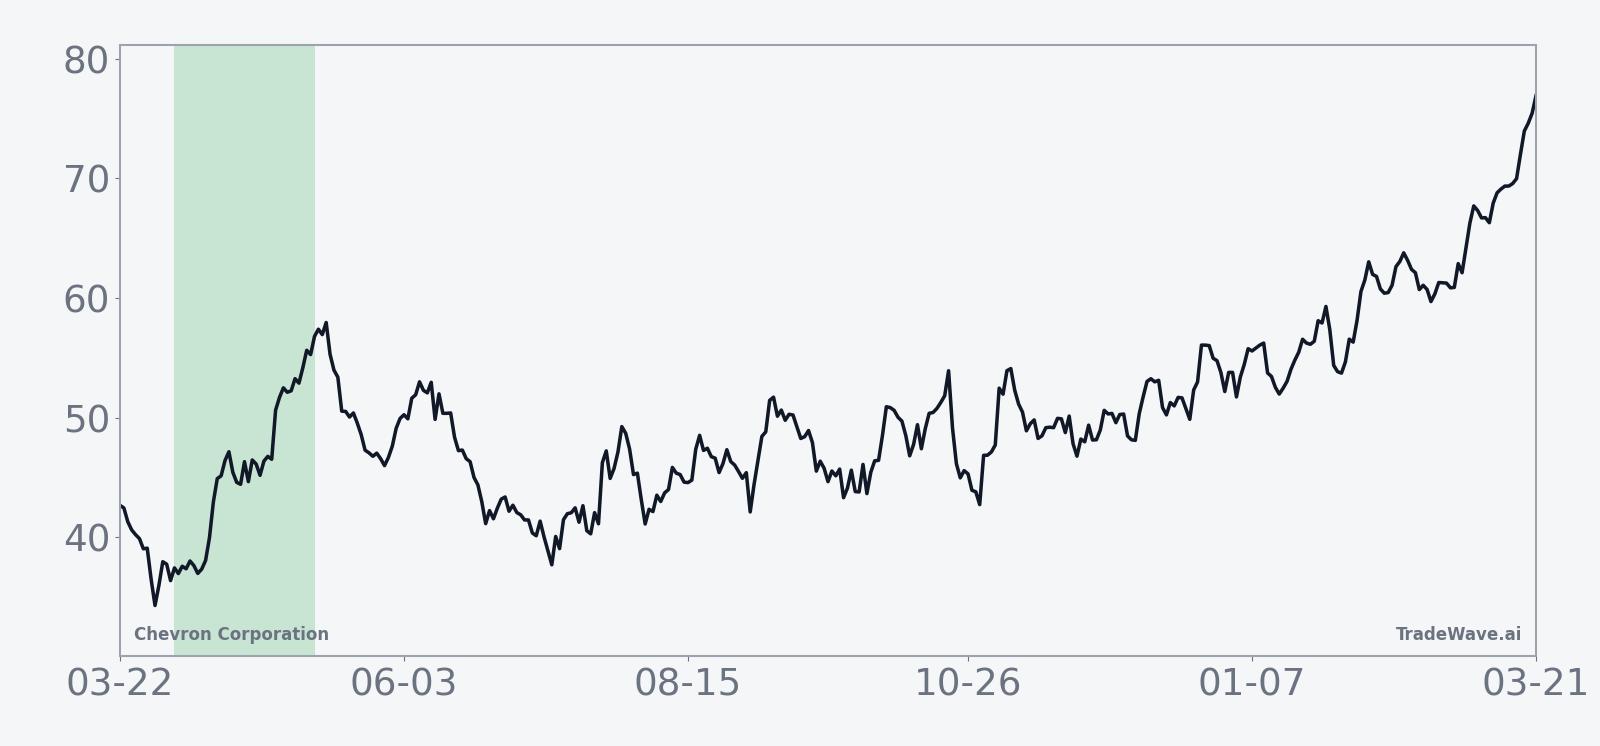
Chevron shares closed Friday at $196.82, down 0.08% on the day, after trading between $194.69 and $197.63 on volume of about 13.0 million shares. The stock is roughly 10.03% higher over the past month and sits about 1.0% below its 52-week high of $198.88, with 20-day average volume near 11.8 million shares and a 50-day moving average around $174.48, underscoring how extended the recent run has been.
That price strength comes even as Big Oil’s earnings power has cooled. On Jan 30, 2026, The Wall Street Journal reported that Exxon and Chevron posted their slimmest annual profits since 2021 as lower crude prices squeezed margins and raised questions about how much cash these companies can return to shareholders if the commodity backdrop stays soft.[1] For Chevron, which has leaned on record production and cost cuts in prior quarters, the shift from windfall profits to more normal returns changes the way investors weigh buybacks, dividends and long-cycle projects.
Venezuela remains a swing factor in that debate. In early January 2026, MarketWatch detailed how Chevron’s stock fell when the market reassessed the pace and scale of potential gains from its position as Venezuela’s largest foreign investor, after an initial burst of optimism around a new government and easing restrictions.[2] The tug-of-war between opportunity and political risk in Caracas has added another layer of volatility to a stock that already trades as a proxy for global oil prices.
The chart below situates the latest move in its recent multi-month context.
Election-cycle backdrop and macro context
The 2026 window sits in the midterm election year of the U.S. presidential cycle, a phase that often brings policy fatigue rather than fresh legislative shocks. For energy majors, that has historically meant fewer surprise tax or regulatory headlines and more focus on how companies navigate commodity cycles, capital allocation and geopolitical exposure. Chevron’s heavy upstream footprint and Venezuela stake make it particularly sensitive to that mix of macro and policy forces.[1]
In midterm years, markets often treat energy as a barometer of global growth and geopolitical risk rather than a pure election story. With crude prices already pressuring Chevron’s profits and investors scrutinizing the payoff from Venezuela, the upcoming seasonal window lands at a moment when sentiment could swing quickly on any shift in demand data, OPEC decisions or U.S. foreign policy.[1]
What to watch as the window opens
First, watch how CVX behaves as Apr 5 approaches relative to its 52-week high near $198.88. A consolidation or shallow pullback into the start of the window would be consistent with prior years that saw early drawdowns followed by strong maximum favorable moves, while a continued vertical climb could leave less room for the typical seasonal upside.
Second, keep an eye on macro and policy headlines tied to oil prices and Venezuela. Any renewed pressure on crude or signs that Venezuela projects are slipping could test the historical pattern’s bullish bias, especially given how much of Chevron’s recent narrative has revolved around squeezing returns from a tougher earnings environment.[1]
Third, monitor intraday volatility and depth of pullbacks once the window is underway. In past cycles, some of the best eventual gains came in years that first saw several percent of adverse excursion before the stock turned higher. If CVX sells off sharply early in the window but holds key support levels and then starts to grind higher, that would rhyme with the historical MFE and MAE profile rather than contradict it.
Finally, track how Chevron trades around broader energy-sector moves. If the stock continues to outperform peers despite softer profits and policy noise, it would reinforce the idea that this midterm-election spring window has been a structurally favorable period for the name. If instead CVX lags badly during a strong tape for oil and gas, that would be an early sign that 2026 may be one of the rare years when the seasonal pattern fails to assert itself.
Sources
- [1] The Wall Street Journal, "Exxon, Chevron Post Slimmest Annual Profits Since 2021" (Jan 30, 2026).
- [2] MarketWatch, "Chevron’s stock falls as the market gets a reality check on Venezuela" (Jan 6, 2026).
- [3] Reuters, "Chevron beats Wall Street profit estimates with record output" (Aug 1, 2025).
- [4] Seeking Alpha, "Chevron paid hundreds of millions to Venezuela in secret deal with Biden" (Mar 23, 2025).
- [5] Reuters, "Chevron beats Wall Street profit estimates with record production" (Aug 1, 2025).
- [6] Reuters, "Chevron meets Wall Street profit estimates as refining recovers" (May 2, 2025).
- [7] The Wall Street Journal, "How Chevron Secured Its Place as Venezuela’s Largest Foreign Investor" (Dec 20, 2025).