Oracle Corporation (ORCL) Has Rallied in All 8 Midterm-Year Windows Since 1994
Oracle Corporation is cooling off after an AI-fueled earnings spike just as it approaches a 360-day midterm-election-year window that has never produced a losing year in the historical sample.

Key takeaways
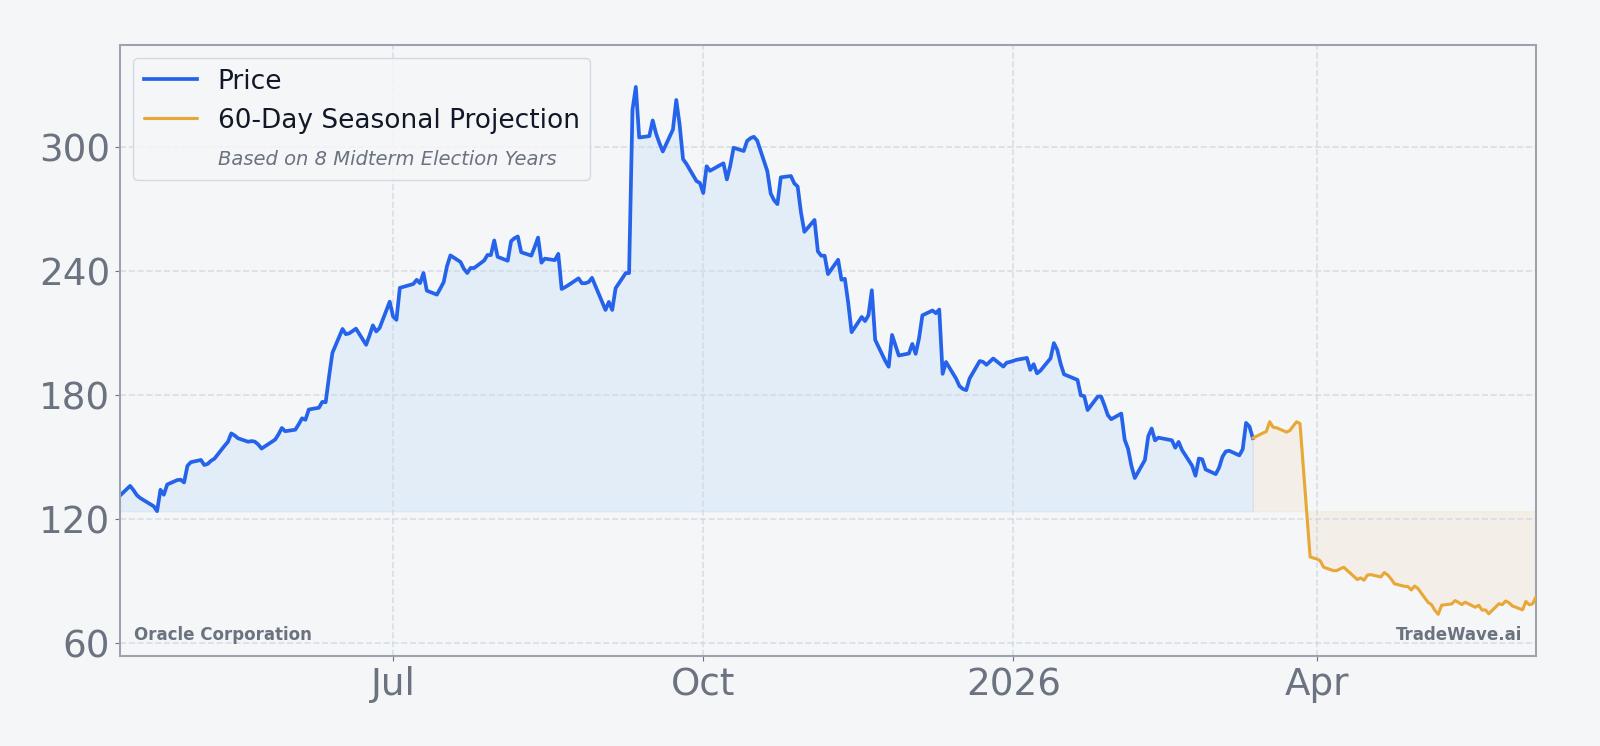
- Oracle Corporation has posted gains in all 8 midterm-election-year windows since 1994 during this 360-day pattern, with an average profit of 24.6% for a long setup.
- The next iteration of this window begins on Apr 11, 2026 and runs for roughly one trading year, spanning the heart of the midterm election year into the following policy phase.
- Across those 8 cycles there were 8 winners and 0 losers, with cumulative gains of 463% and a Sharpe ratio of 1.79 for the end-of-window outcomes.
- Maximum favorable moves inside the window have reached as high as 117.14% in a single year, while adverse drawdowns have stretched to -36.04%, underscoring meaningful volatility even in winning seasons.
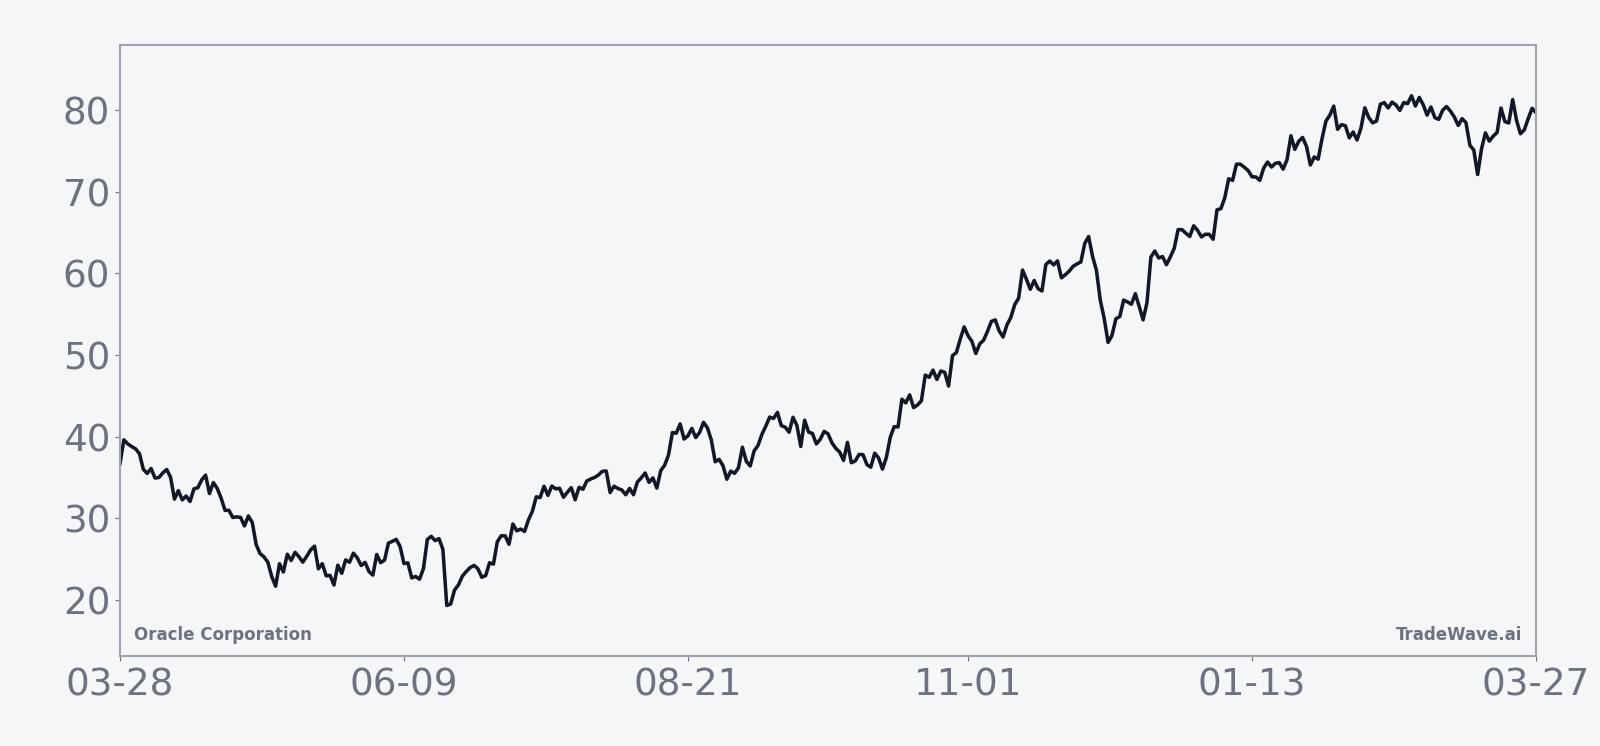
- Today ORCL trades at $155.11, about 54.7% below its 52-week high, after shares jumped as much as 14% on a Q3 earnings beat and stronger long-term revenue outlook tied to AI infrastructure demand.[4][5][6][7]
- The pattern is explicitly long, with a TradeWave Ratio of 1.14 that reflects how far price has typically traveled in the trade direction within the window regardless of the final close.
According to historical data from TradeWave.ai, Oracle’s behavior in midterm election years has followed a distinct seasonal script that differs from its performance in other parts of the presidential cycle.
Seasonal window
Oracle Corporation has risen in all 8 midterm-election-year windows captured in this pattern, averaging 24.6% gains for long positions across a 360-day stretch. Today the stock trades at $155.11, down 2.5% on the session and about 54.7% below its 52-week high of roughly $342.71, even after a strong year-to-date run of about 32%.
Grouping the data by the presidential election cycle matters here because midterm years often bring a different policy mix than election or pre-election years, with spending debates, regulatory noise and shifting rate expectations that can reshape tech and cloud valuations. This pattern isolates the last 8 midterm election years for Oracle, focusing on how the stock has behaved when Washington is in the middle of the four-year political clock rather than at the start or end of it.
This seasonal window begins on Apr 11, 2026 and spans 360 trading days. The trade direction is long, and historically that has been rewarded: 8 winners, 0 losers and 100% of the sampled windows finishing in positive territory. Average profit of 24.6% reflects the mean gain across those winning years, while the median profit of 25.38% shows that the typical outcome has been a mid-20s return by the end of the window.
The strongest year in the sample came in 1998, when Oracle returned 33.51% over the window, with a maximum favorable move of 117.14% from the entry price before settling back by the close. The softest outcome was 2002, which still finished up 7.04% but saw a maximum adverse move of -33.73% at one point, illustrating how a winning seasonal year can still feel like a rough ride on the way to the finish.
Across all 8 midterm-year windows, the TradeWave Ratio stands at 1.14. TradeWave Ratio (TWR) is how far price typically travels in the trade direction within the window, independent of the final close, so a reading above 1 suggests that intraperiod rallies have tended to extend meaningfully beyond the eventual end-of-window gain. The Sharpe ratio of 1.79, based on end-of-window outcomes, points to a historically strong risk-adjusted profile for this specific seasonal regime.
The intraperiod path has not been smooth. Maximum favorable excursion, or MFE, captures the best point-to-peak move from the entry during each year, while maximum adverse excursion, or MAE, tracks the worst drawdown from entry before the window closes. In 1994, for example, Oracle’s 38.88% net gain came with a 53.88% peak run-up and a -22.22% drawdown at the worst point. In 2010, a 30.19% final gain was paired with a 32.15% peak move and an -18.93% pullback along the way.
The historical trend profile suggests that gains have tended to build over the life of the window rather than arriving in a single burst. Trend metrics show 10 long-trend readings versus 33 short-trend readings on one scale and 18 versus 30 on another, which points to choppy stretches inside an overall positive regime rather than a straight-line climb. The cumulative return curve for the pattern climbs steadily across the 360 days, reflecting the 463% cumulative gain across the eight midterm-year windows.
A second view of the same window shows how far Oracle has typically run in its best rallies and how deep the worst drawdowns have gone before the window closes.
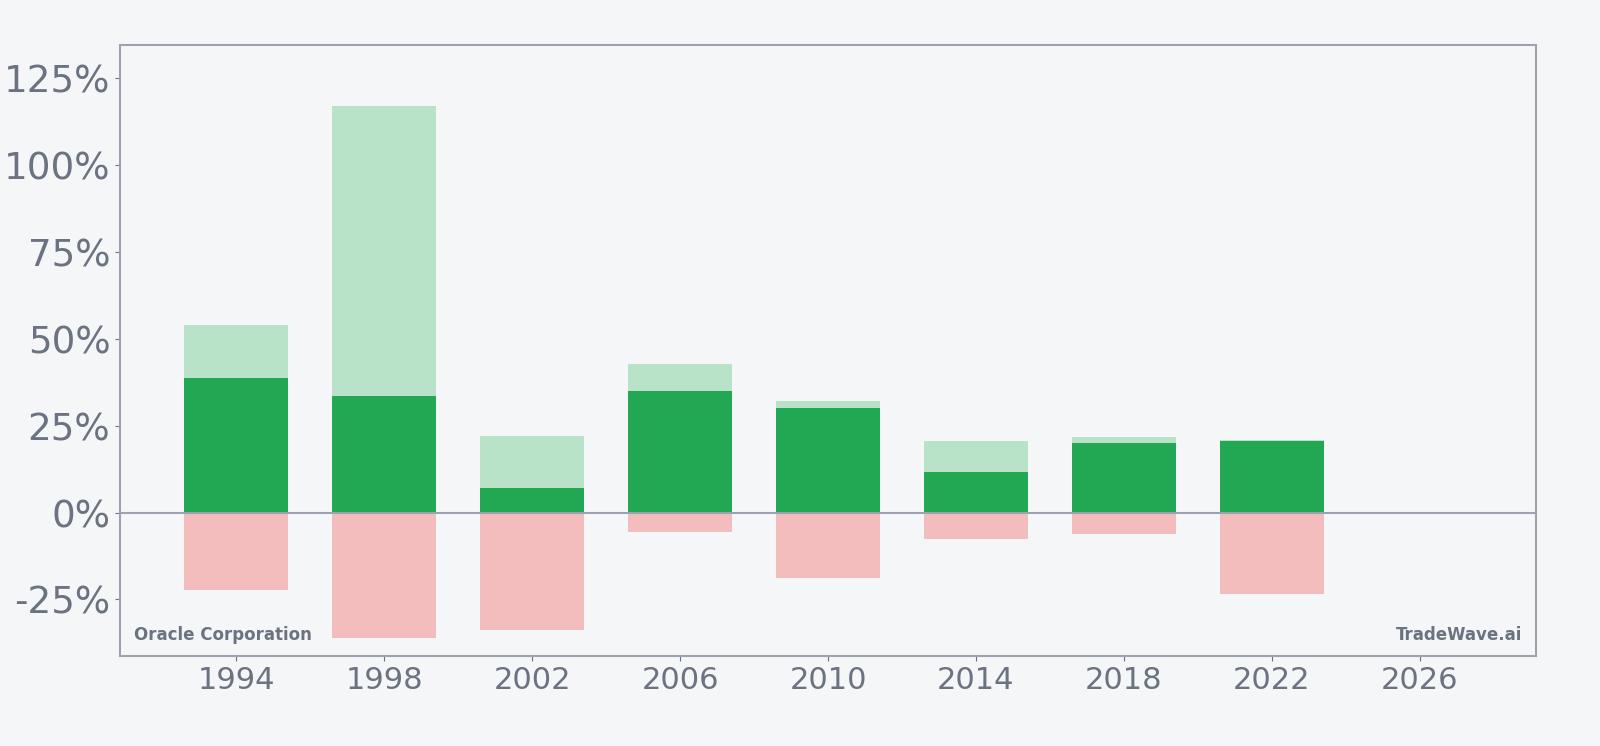
History does not guarantee future results, and even in a perfect 8-for-8 winning sample, adverse excursions inside the window have at times exceeded -30% before the trade recovered.
Price and near-term drivers
Oracle shares closed Monday at $155.11, down 2.5% on the day, leaving the stock roughly 54.7% below its 52-week high and still up about 32% year to date. The pullback comes after a powerful post-earnings surge last week, when the stock “rocketed higher” on a Q3 beat that featured revenue of $17.19 billion and earnings of $1.79 per share, both ahead of Wall Street estimates, and a stronger long-term revenue outlook tied to AI data center demand.[4][5][6][7]
On Mar 11, 2026, Oracle reported that cloud revenue jumped 44% year over year, and management guided for Q4 revenue growth of 19% to 21% with cloud revenue expected to rise 46% to 50%. The company also raised its fiscal 2027 revenue forecast to $90 billion, reinforcing the narrative that Oracle is leaning hard into AI infrastructure and cloud services as its next growth leg.[4][5][6] That bullish story has not erased concerns about the cost and leverage required to build out those data centers, which remain a key macro theme for the stock as investors weigh higher-for-longer rates against long-duration tech cash flows.[6]
Volume around the earnings release spiked as shares jumped as much as 14% intraday, a move that reset positioning after a choppy stretch and pulled in momentum traders focused on AI infrastructure winners.[4][7] At the same time, some high-profile skeptics have stayed vocal. In January 2026, commentary around short bets against Oracle and calls from some strategists to fade the AI buildout highlighted the divide between growth believers and those worried about capital intensity and execution risk.[8][9][10]
The chart below situates the latest move in its recent multi-month context.
Macro and policy backdrop
Oracle’s seasonal setup arrives as AI infrastructure spending becomes a macro story in its own right. The company is committing heavily to new data centers and specialized hardware to support AI workloads, a strategy that has raised questions about debt levels and the timing of returns but also positioned Oracle as a key player in the cloud arms race.[5][6] In a midterm election year, that kind of capital spending intersects with policy debates over energy use, data privacy and regulation of large AI models, all of which can influence sentiment toward big enterprise software names.
Sector-wide, cloud computing growth remains robust, with Oracle’s cloud segment growing more than 40% year over year on the back of AI-related deals.[5] If that pace holds into the midterm year, the company will be navigating a backdrop where regulators and lawmakers are more focused on tech concentration and AI oversight, even as corporate customers push to modernize their infrastructure. That mix of strong demand and rising scrutiny is one reason the election-cycle lens is useful: midterm years often feature noisy policy headlines but can also set the stage for stronger risk appetite in the following pre-election year.
What to watch as the window opens
The upcoming 360-day window that starts on Apr 11 will test whether Oracle can extend an 8-for-8 midterm-year streak in a very different AI-driven environment. Traders will be watching how the stock behaves around key levels carved out by the recent earnings spike, including whether pullbacks stay contained relative to the deep intraperiod drawdowns seen in some past midterm windows.
On the fundamental side, the next few quarters of cloud and AI infrastructure bookings will be critical. Delivery against the raised fiscal 2027 revenue target and the Q4 growth guidance will shape how investors treat any seasonal weakness or strength: strong execution could see buyers lean into dips inside the window, while any stumble on cloud growth or margins could make the historical drawdown profile feel more relevant.[4][5][6]
Policy and macro headlines will also matter. As the midterm election year unfolds, traders should track developments around AI regulation, data center energy policy and broader tech oversight, since those issues can amplify volatility in a stock that is now tightly linked to AI infrastructure spending.[5][6] Behavior inside the window that mirrors prior cycles, with sizable but ultimately recoverable drawdowns followed by strong end-of-window gains, would reinforce the historical pattern. A clean break from that script, either through a sustained trend without the usual volatility or a rare losing year, would signal that the AI era is rewriting Oracle’s election-cycle playbook.
Sources
- CNBC, "What Wall Street analysts expect from Oracle earnings" (Dec 10, 2025)
- Yahoo Finance, "Mizuho Reaffirms Oracle Outperform Rating" (Jan 2, 2026)
- MarketWatch, "Oracle’s stock could surge 80%" (Nov 17, 2025)
- Yahoo Finance, "Oracle stock rockets on Q3 earnings beat" (Mar 11, 2026)
- Forbes, "How Oracle's Earnings Impacts Its 2026 Forecast" (Mar 11, 2026)
- Reuters, "Oracle rallies as strong revenue forecast" (Mar 11, 2026)
- Forbes, "Oracle Earnings: Shares Pop After Tech Giant Beats Revenue Expectations" (Mar 10, 2026)
- Seeking Alpha, "Big Short Michael Burry bets against Oracle" (Jan 10, 2026)
- Financial Times, "Morgan Stanley thinks you should short Oracle" (Nov 27, 2025)
- CNBC, "Final Trade: ORCL, NVO, VLO, VEA" (Sep 16, 2025)