10-for-10 Spring-Summer Run: Microsoft (MSFT) Enters a 127-Day Window Averaging 13% Gains
Microsoft is heading into a 127-day window that has quietly delivered gains every year for a decade, even as the stock trades well below its highs and investors debate how long AI-driven growth can keep powering the story.

What is the seasonal pattern for Microsoft (MSFT)?
Microsoft has risen in 10 of 10 years during this April-to-September window, with an average gain of 13.44% in winning years.
- 10 for 10 in this window, averaging 13.44% gains in winning years across the last decade.
- The 2026 window begins on Apr 14 and runs for 127 trading days, covering most of the spring and summer.
- Percent Profitable is 100%, with 10 winners and 0 losers over the 10-year lookback.
- Average winner gains of 13.44% stack up to a 242% cumulative return across all ten windows.
- Intraperiod swings have been meaningful, with some years seeing double-digit drawdowns before finishing higher.
- The pattern is long-biased, aligning with Microsoft’s role as a mega-cap growth and AI leader during a key part of the calendar.
According to historical data from TradeWave.ai, this upcoming stretch has behaved very differently from an average month on the calendar for Microsoft. The next section walks through what that seasonal backdrop has looked like and how it lines up with today’s setup.
How has Microsoft (MSFT) traded in this April–September window?
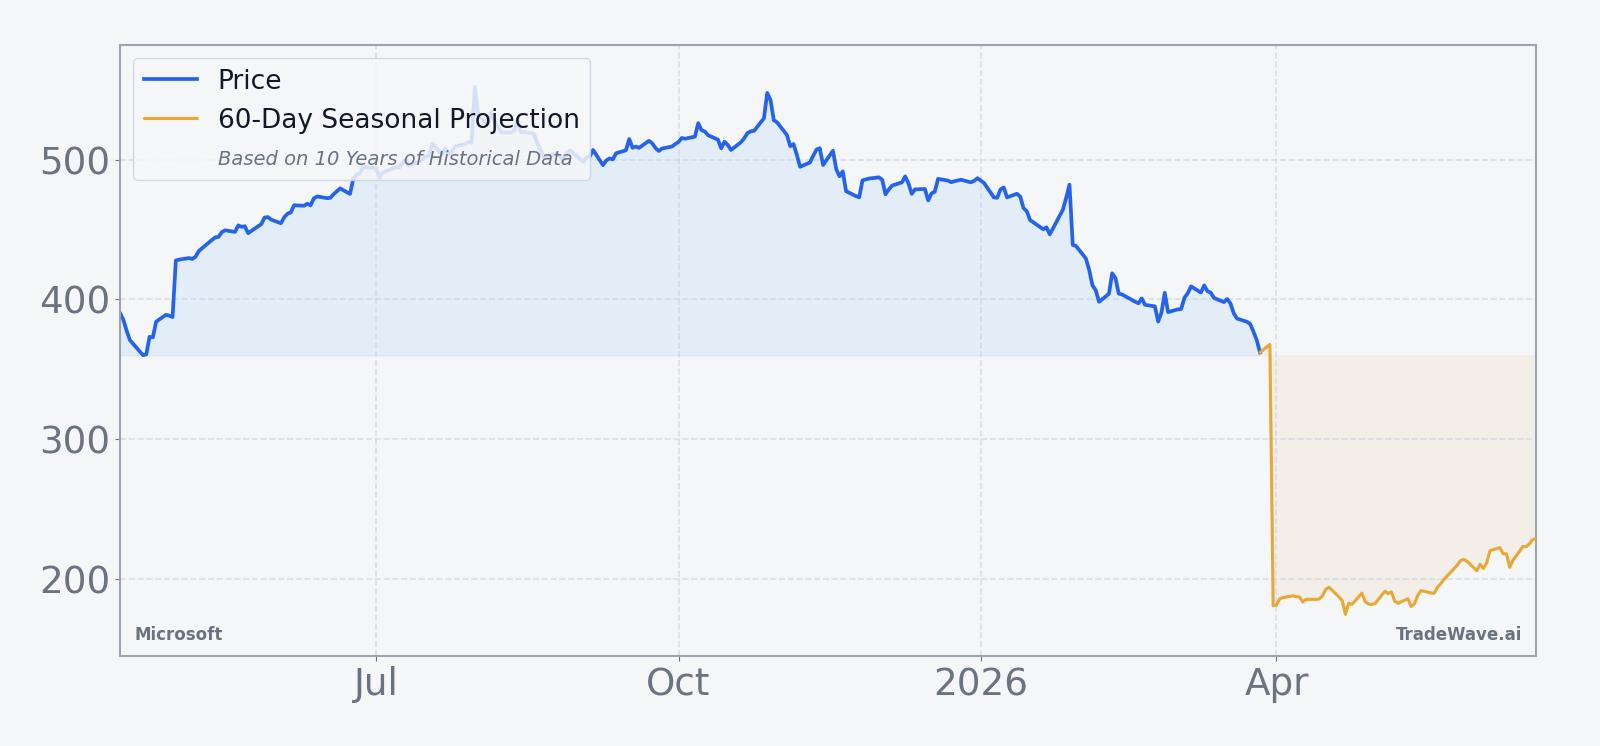
Microsoft has posted gains in all 10 years during this 127-day spring-summer window, averaging a 13.44% profit with a long bias. The next iteration starts on Apr 14, 2026, with the stock last closing at $356.77, about 35.0% below its 52-week high of $549.14 and roughly 5.1% above its 52-week low of $339.57.
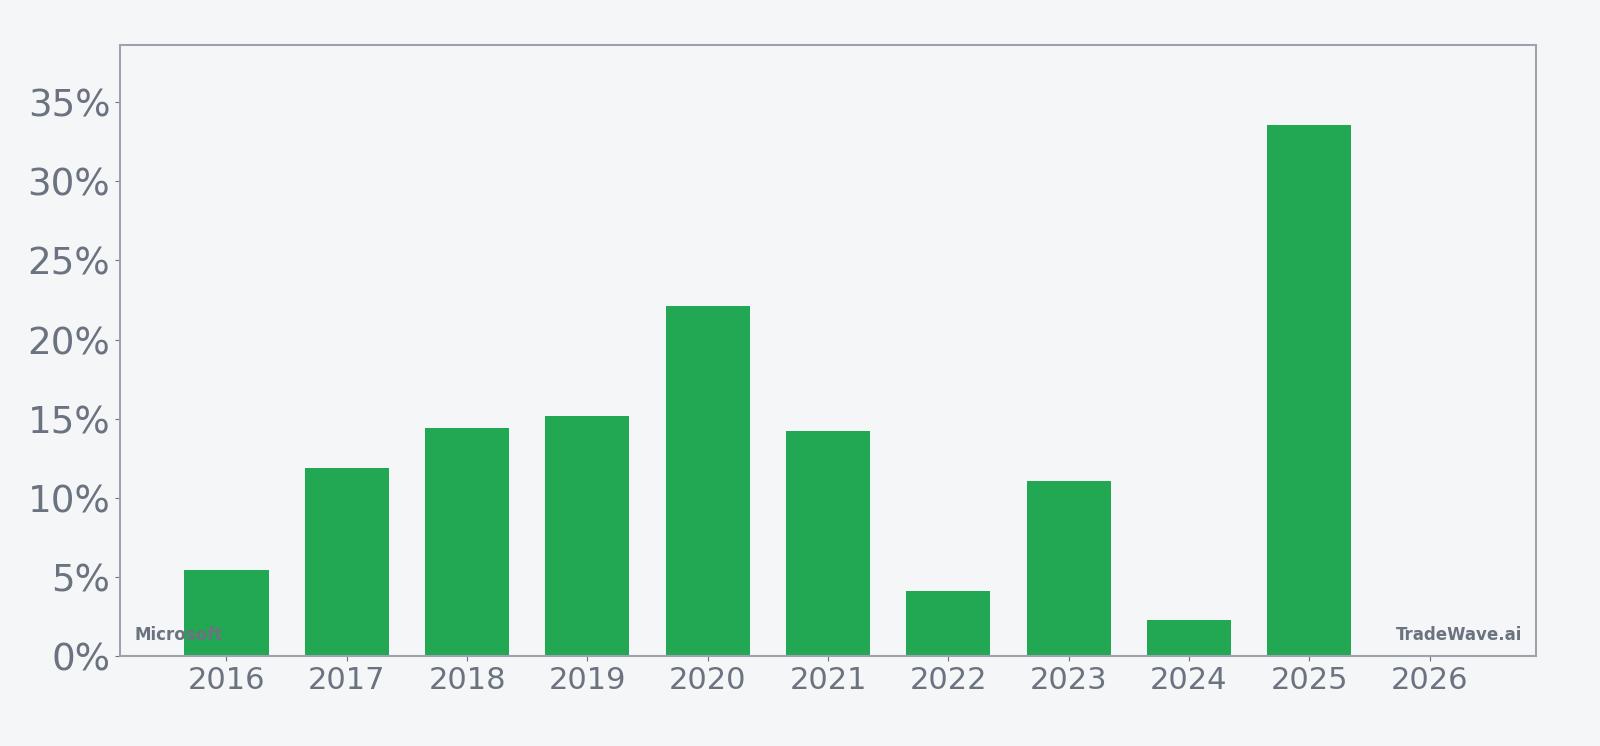
Across the 10-year sample, the strongest year in this Microsoft trading window was 2025, when the stock gained 33.58% between the April start and the end of the 127 days, with a peak run-up of 43.49% at the best point in the window. The softest outcome was 2024, which still finished up 2.28% but saw a maximum favorable move of 13.43% before giving back most of that advance by the close.
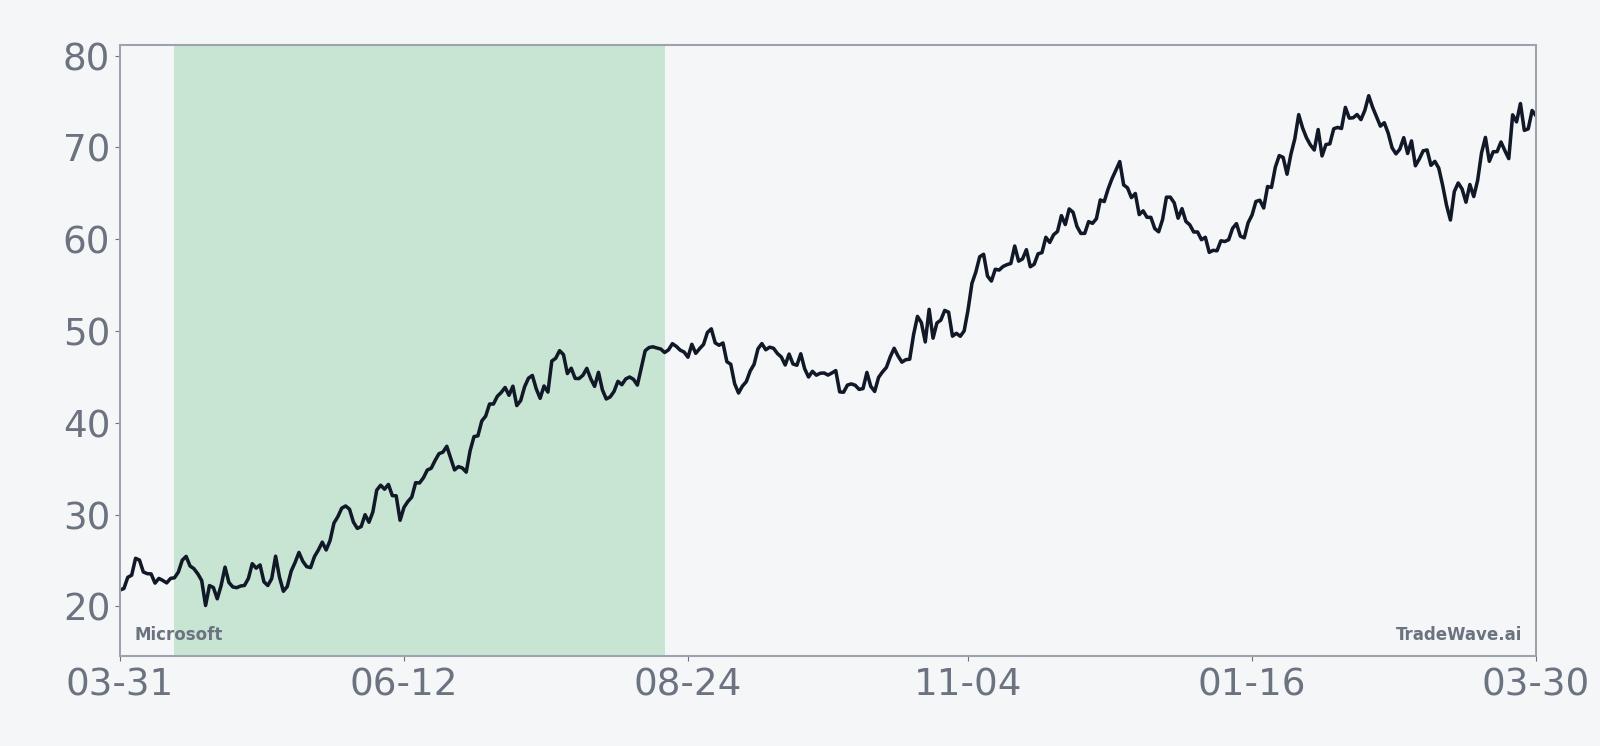
The historical path of returns tends to build steadily rather than in one burst. The average seasonal trend shows Microsoft grinding higher through much of the window, with gains often front-loaded in the first half and then consolidating into late summer. That profile fits a long trade direction where rallies, not pullbacks, have defined the final outcome in prior years.
A second view that layers in peak rallies and worst drawdowns helps show how far Microsoft has tended to swing inside the window.
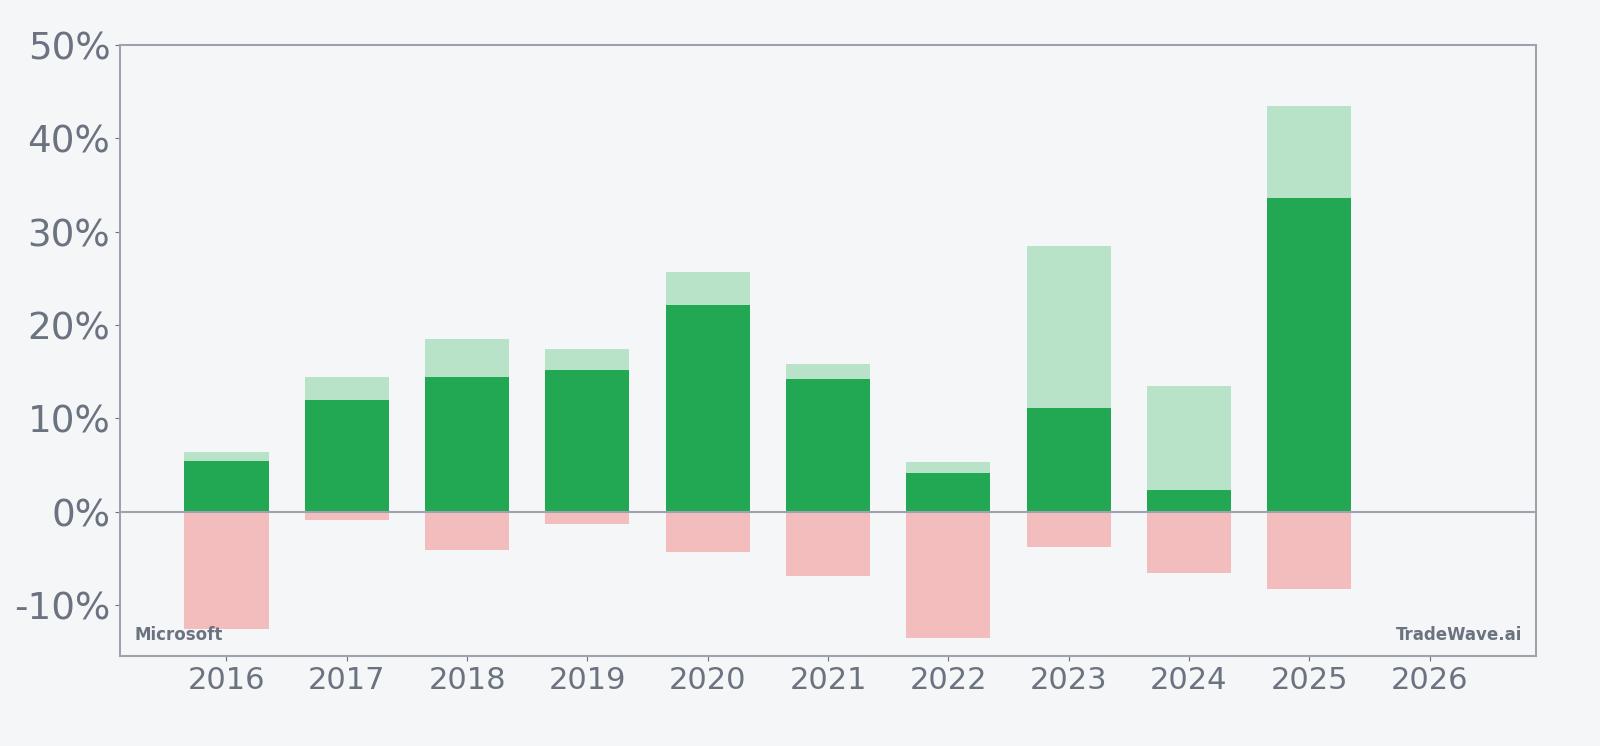
Even in winning years, the worst intraperiod drawdowns have not been trivial. In 2016, for example, Microsoft finished the window up 5.43% but at one point was down 12.62% from the entry level, while 2022 saw a 4.16% gain despite a maximum adverse move of 13.49%. That mix of solid end-of-window gains and double-digit dips along the way is consistent with a TradeWave Ratio of 1.56, which signals that price has typically traveled meaningfully in the trade direction within the window before the final close.
The flip side is that the best intraperiod rallies have often been much larger than the final net result. In 2023, Microsoft’s net gain in the window was 11.08%, but the maximum favorable excursion reached 28.46% at the peak. In 2025, the stock’s 33.58% finish came after a 43.49% run-up at the best point, underscoring how strong years in this seasonal pattern can overshoot before settling back.
Put together, the record is unusually clean for a mega-cap stock: 10 winners, 0 losers, double-digit average gains and a Sharpe ratio of 1.31 for this specific slice of the calendar. The main trade-off has been tolerating sizable swings inside the window rather than a smooth ride higher.
History does not guarantee future results; adverse excursions can be large even in winning windows, and past seasonal strength does not ensure similar outcomes in 2026.
Why does Microsoft (MSFT) follow this seasonal pattern?
One likely driver is the clustering of Microsoft’s fiscal year-end and major earnings updates around this period, which can focus institutional flows and portfolio rebalancing into the stock. Analysts have also pointed to cloud and AI spending cycles, where enterprise budgets often get deployed in the middle of the calendar year, supporting demand for large-cap software and infrastructure names. The pattern may also reflect broader tech-sector rotation, with investors leaning into growth and AI themes after early-year macro and rate jitters settle down.
What is driving Microsoft (MSFT) today?
Microsoft shares last closed at $356.77, down 2.51% on the day, leaving the stock about 35.0% below its 52-week high of $549.14 and roughly 5.1% above its 52-week low of $339.57. The pullback comes after a powerful run that took the stock into overbought territory and then through a 15% retreat, even as revenue growth held near 16.7% and operating margins stayed close to 46.7%.[6][11]
In Q2 2026, Microsoft reported adjusted EPS of $4.14 with revenue up 17% year over year, matching or beating expectations, but investors focused on signs that Azure’s 39% growth rate may be slowing from earlier peaks.[5] At the same time, management has guided to continued AI-driven cloud expansion, with Azure expected to surpass $75 billion in revenue on 34% growth, reinforcing the idea that AI infrastructure remains the core of the Microsoft investment case.[5]
Valuation remains a live debate. In early March 2026, Forbes highlighted Microsoft trading around $400 with a premium multiple that bulls argue is justified by durable double-digit revenue growth and AI optionality, while skeptics worry about how much of that future is already priced in.[6] Another Forbes piece in early March framed the stock’s ability to “defy market headwinds” as a function of its strong balance sheet and recurring revenue, even after a 15% slide from highs.[11] Wedbush, which has been vocal on the AI theme, has kept an Outperform rating and a $600 price target, positioning Microsoft as a potential $4 trillion to $5 trillion market-cap story over time.[1]
Short interest remains low at about 0.79%, suggesting few investors are willing to bet aggressively against the name despite the recent drawdown and questions about AI leadership.[8] That leaves positioning skewed toward long-only holders and benchmarked funds, which can amplify moves when sentiment shifts around earnings, guidance or macro data tied to enterprise IT spending.
The chart below situates the latest pullback against Microsoft’s strong multi-month run and the upcoming seasonal window.
How do earnings and AI spending shape the outlook for this window?
Microsoft’s seasonal strength lines up with a period when investors will be looking for confirmation that AI and cloud spending can keep offsetting any macro slowdown. In January 2026, commentary around Q2 results emphasized that Azure’s 39% growth, while strong, was being scrutinized for signs of deceleration, even as commercial remaining performance obligations climbed to $625 billion, pointing to a deep backlog of contracted demand.[5] That backlog gives Microsoft more visibility than most peers, but it also raises the bar for each earnings print during the window.
Sector-wise, Microsoft sits at the center of both cloud computing and AI infrastructure themes, with Azure’s 39% growth and heavy capital expenditure on AI hardware and data centers underpinning the broader tech trade.[2][6] If enterprise budgets stay intact and AI projects move from pilot to production, the historical seasonality could again align with fundamental tailwinds. If customers start to slow or re-sequence deployments, the same window that has historically been friendly to longs could instead become a period where expectations reset.
What should traders watch as this seasonal window opens?
For this year’s window, the first test will be whether Microsoft can stabilize above the recent lows and rebuild momentum into the mid-$400s, an area that has acted as a valuation overhang in prior commentary.[6][11] Traders will be watching the next earnings update for any change in Azure’s growth trajectory, updated AI revenue disclosures and commentary on capital spending, since those details have driven the biggest post-report moves in recent quarters.[5]
On the seasonal side, behavior in the first 30 to 40 trading days after Apr 14 will matter. In strong years like 2019, 2021 and 2025, Microsoft tended to push higher early in the window and then consolidate, while weaker-but-still-positive years such as 2016 and 2022 saw deeper drawdowns before recovering. A pattern of higher highs with contained pullbacks would rhyme with the historical average, while a failure to hold support after earnings would mark a clear break from the 10-for-10 record.
Because short interest is low and most investors are long-biased, any upside surprise on AI monetization or backlog conversion could see the stock move quickly as performance-chasing resumes.[8][11] Conversely, if Azure growth or AI commentary disappoints, the same positioning could leave little natural buying support on the way down, making those historical intraperiod drawdowns a more immediate reference point than the decade-long win streak.
Sources
- [1] Seeking Alpha, "Microsoft keeps Outperform rating as Wedbush sees 'robust' Q4 results" (Jul 25, 2025)
- [2] Seeking Alpha, "Microsoft stumbles even as Q2 results top estimates" (Jan 28, 2026)
- [3] Business Insider, "Microsoft Stock Surges After It Posts Another Earnings Beat" (Jul 30, 2025)
- [4] Forbes, "Buy MSFT Stock At $500?" (Aug 27, 2025)
- [5] The Motley Fool, "Is It Time to Buy Microsoft Stock as Its Backlog Soars?" (Jan 30, 2026)
- [6] Forbes, "Should You Buy Microsoft At $400?" (Mar 9, 2026)
- [7] CNBC, "Stocks making the biggest moves after hours: Alphabet, Meta, Starbucks, Microsoft and more" (Oct 29, 2025)
- [8] Seeking Alpha, "Microsoft's Lack Of Leadership In AI, Wait" (Feb 16, 2026)
- [9] CNBC, "These stocks, including Microsoft, just entered overbought territory and may be due for a pullback" (May 10, 2025)
- [10] CNBC, "Microsoft breaks out to new highs. What the charts say to do from here" (Jun 30, 2025)
- [11] Forbes, "Can Microsoft Stock Defy Market Headwinds?" (Mar 4, 2026)
About this seasonal analysis
Seasonal pattern data is sourced from TradeWave.ai, which analyzes historical price behavior across annual calendar windows going back up to 30 years. Read the full data methodology or the book The 100-Year Pattern by Afshin Moshrefi (2026 edition). Past performance of seasonal patterns does not guarantee future results. This article is for informational purposes only and does not constitute investment advice.