Microsoft (MSFT) Faces AI Spending Risks as Historically Weak 21-Day Midterm Window Nears
Microsoft is nearing a 21-day midterm-election-year stretch that has usually favored the short side, just as the stock trades well below its 52-week high and investors debate how much AI growth is already priced in.

Key takeaways
- Microsoft is heading into a 21-day midterm-election-year window starting Apr 17 that has historically favored short setups.
- Across the last 7 midterm election years, this window has been profitable for shorts 86% of the time, with 6 winners and 1 loser.
- Winning years in this pattern have averaged an 8.33% move in the trade direction, while including all years brings the average to 7%.
- Intraperiod swings have been meaningful, with several years showing double-digit peak moves and sizable drawdowns before the trade paid off.
- Today Microsoft trades at $399.41, about 27.2% below its 52-week high, after strong AI-driven earnings but rising questions about margins and capital intensity.[2][5][8][9]
- History suggests this short window can move quickly, so traders watching mega-cap tech risk may want this period on their calendar even if they stay on the sidelines.
According to historical data from TradeWave.ai, this specific midterm-election-year stretch has behaved very differently from an average month for Microsoft, and the next iteration is less than a month away.
Seasonal window
Microsoft has moved in favor of the short side in 6 of the last 7 midterm-election-year windows that begin around Apr 17, with winning years averaging an 8.33% gain for shorts over 21 trading days. The upcoming 2026 window starts on Apr 17 and runs into mid-May, lining up with a period when the stock is already trading about 27.2% below its 52-week high of $549.14 at $399.41 today.[2][9]
Grouping the data by the presidential election cycle matters here because midterm years often bring a different policy and liquidity mix than election or pre-election years. Fiscal debates, regulatory noise and shifting expectations for interest rates can all hit mega-cap tech at once, and this pattern isolates how Microsoft has traded in that specific backdrop rather than averaging across calmer phases.
This seasonal window begins on Apr 17 and spans 21 trading days. Historically, during this period in midterm election years, Microsoft has shown a clear downside bias that aligns with a short trade direction rather than a long one. The pattern phase covers the last 7 midterm election years, so each data point reflects how the stock behaved in that same slice of the calendar when Washington was in the middle of the four-year cycle.
The trade direction for this setup is short, and the track record is striking: Percent Profitable is 86%, with 6 winners and just 1 loser across those seven midterm years. In other words, shorts have historically come out ahead in most iterations of this window, even though Microsoft has been a long-term compounder over the full cycle.
Average winner performance has been 8.33% in the trade direction, meaning that in years when the short worked, Microsoft typically dropped by roughly that amount from entry to exit. When you include every year in the sample, winners and the single losing year together, the Avg Profit - All comes in at 7%, which is still sizable for a 21-day stretch.
Maximum favorable excursion, which is the best intraperiod move in the trade direction from the entry point, has often pushed into high single digits or low double digits in individual years. Maximum adverse excursion, the worst drawdown against the short before it recovered, has also been meaningful at times, with several years showing Microsoft rallying 6% to nearly 15% against the position before rolling over.
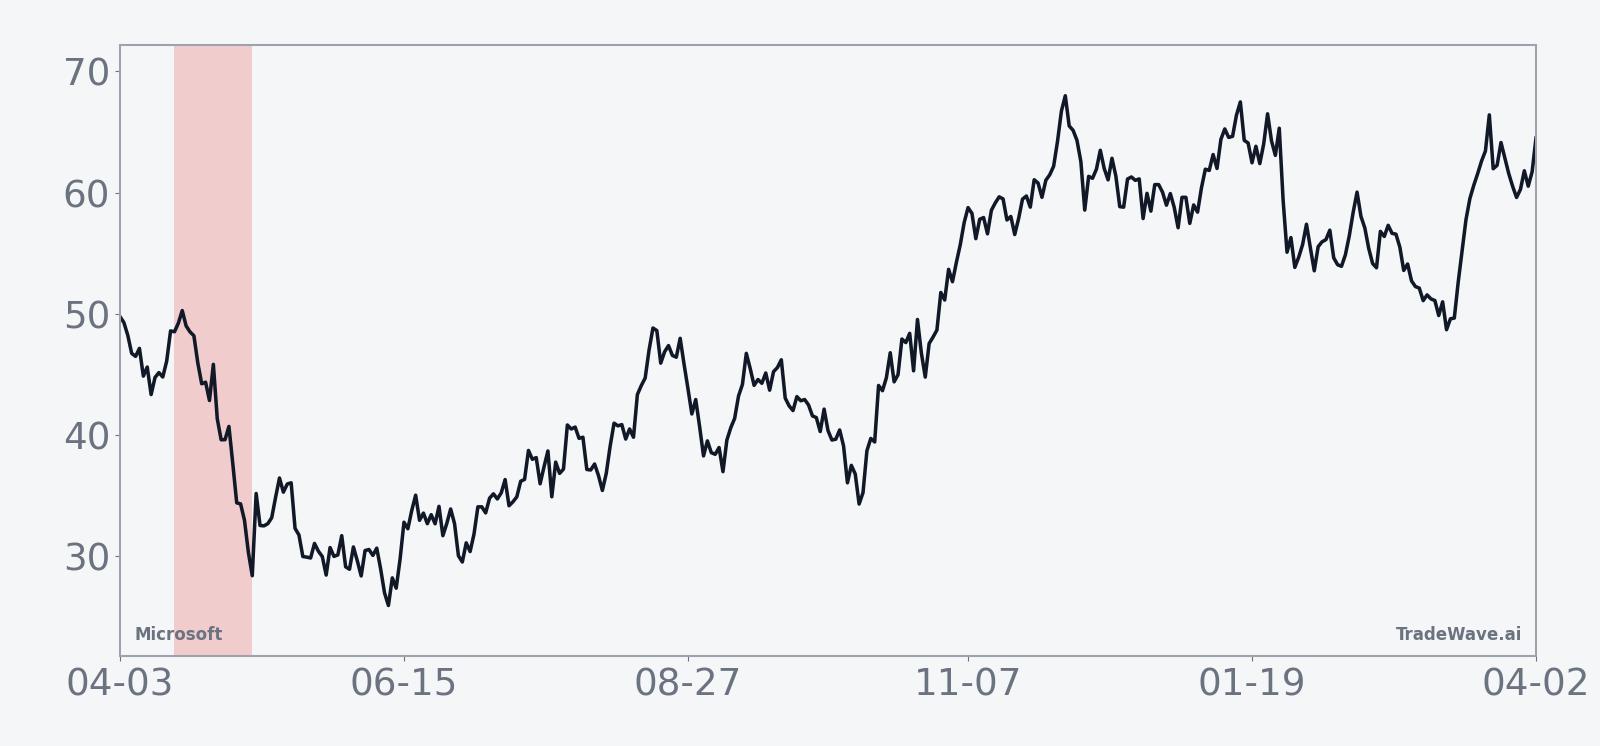
The historical seasonal trend chart for this window shows that the bulk of the move for shorts has tended to build gradually rather than in a single gap. In many years, Microsoft has drifted lower across the three weeks, with occasional early countertrend pops that later faded, which matches the pattern of sizable adverse excursions followed by deeper declines.
The cumulative return profile across all seven midterm years adds up to a 60% total gain for the short side in this window, with an annualized return of 7.02% and a Sharpe ratio of 1.39. That combination points to a pattern that has not only been directionally consistent but has also delivered returns that look attractive relative to the volatility of end-of-window outcomes.
The TradeWave Ratio (TWR) for this setup is 2.18, which reflects how far price typically travels in the trade direction within the window regardless of the final close. In plain English, when this window has moved, it has often moved far enough to matter for risk managers and short-term traders, even in years when the closing result was more modest.
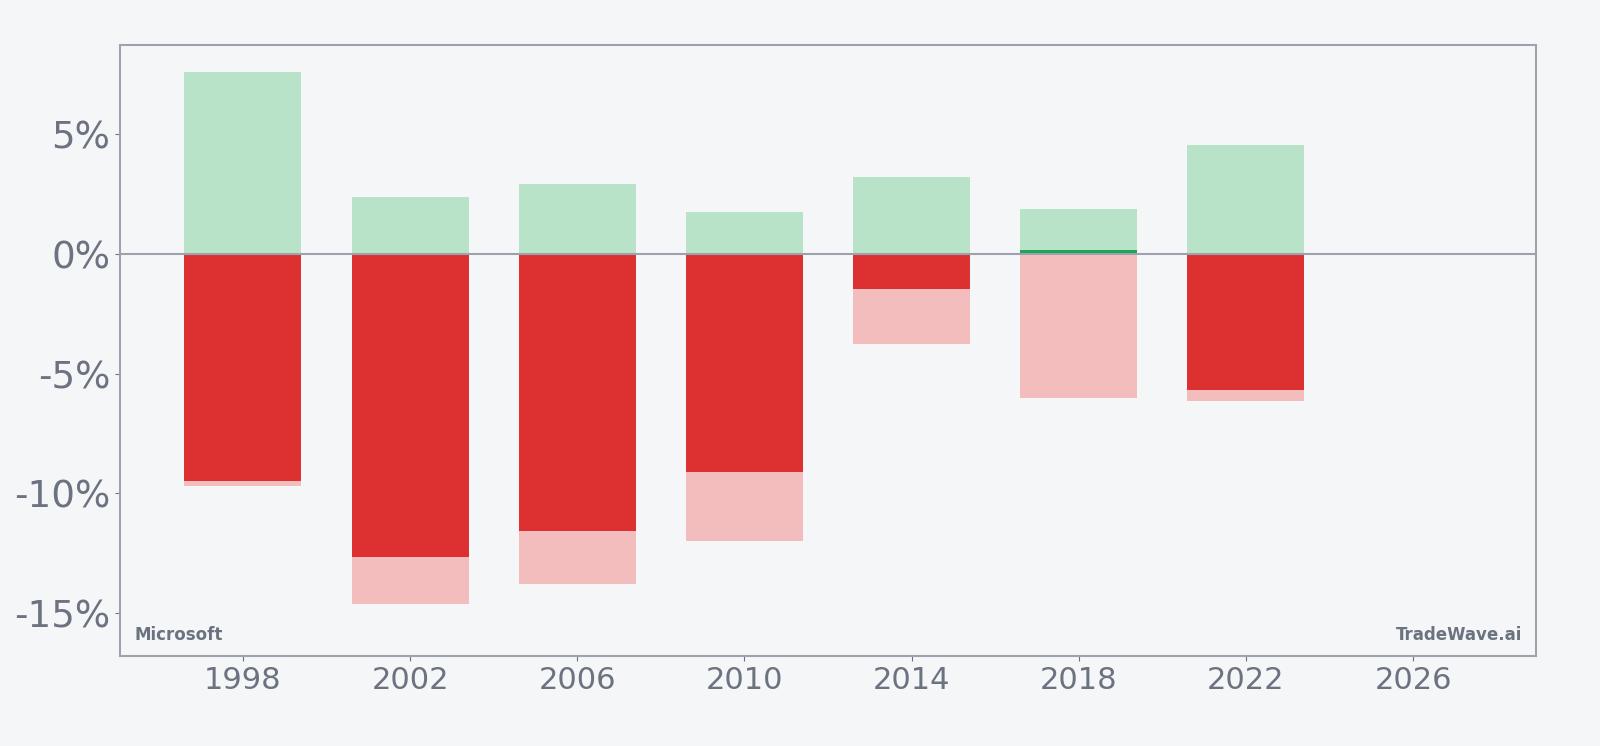
On a per-year basis, 2002 stands out as one of the strongest short-friendly iterations, with a net return of -12.64% for Microsoft over the window and a worst intraperiod drawdown of -14.62% from the entry price. By contrast, 2018 was the weakest year for the pattern, with a small 0.16% loss for shorts as the stock finished slightly higher, even though it still swung as much as -6.03% against the trade at one point.
Add it up: six for seven with mid- to high-single-digit average moves in the trade direction is a rare level of consistency for a mega-cap name in such a short window, especially when the broader four-year cycle is doing a lot of the heavy lifting behind the scenes.
The next chart shows how yearly net results line up with the best and worst intraperiod swings.
History does not guarantee future results, and adverse excursions can be large even in winning windows, so this pattern should be treated as context rather than a trading signal.
Price and near-term drivers
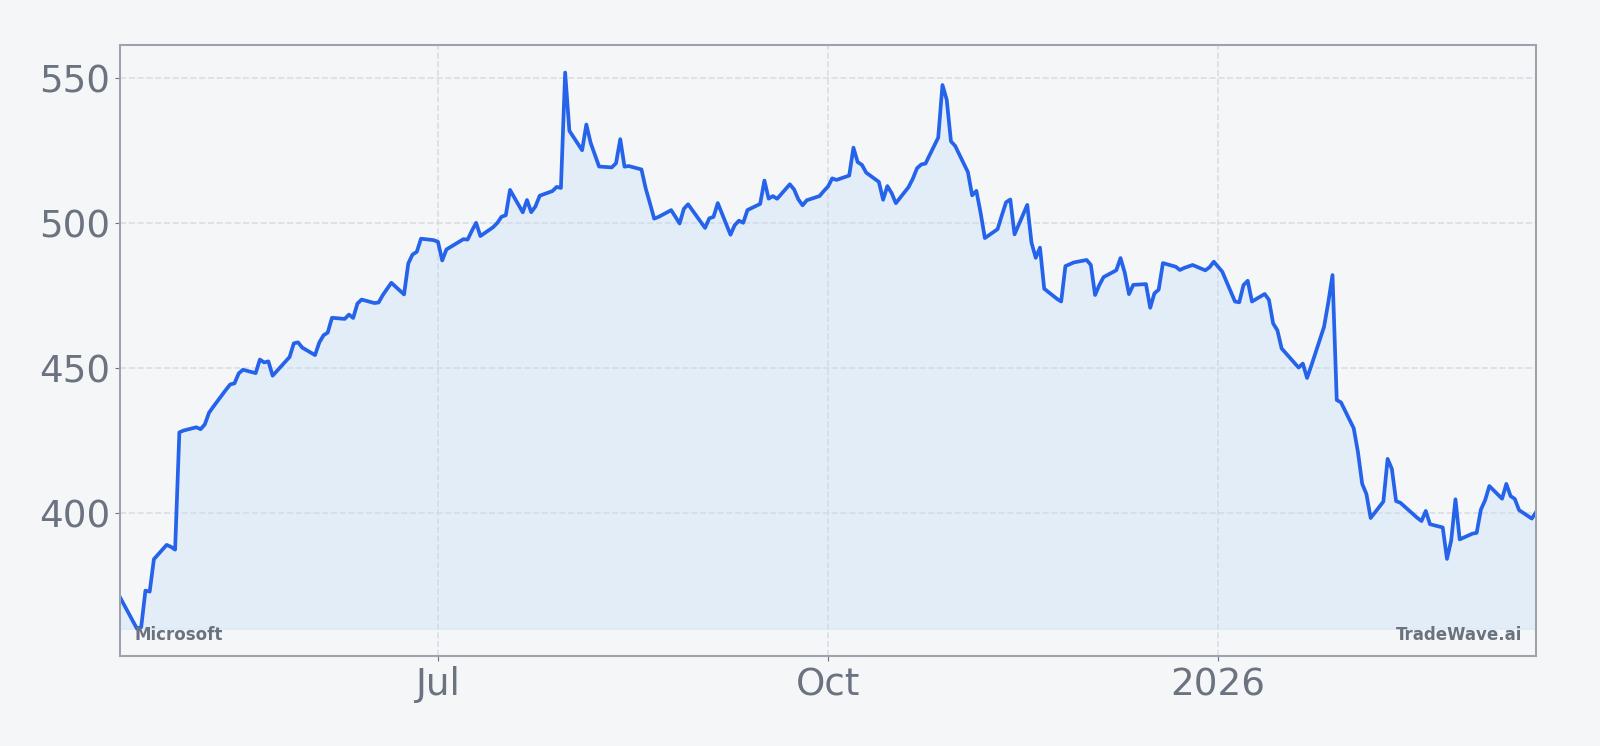
Microsoft shares closed at $399.41 on Mar 17, down 0.14% on the day, leaving the stock about 27.2% below its 52-week high of $549.14 and still comfortably above its 52-week low of $339.57.[2][9] That pullback comes after a powerful multi-year run driven by cloud and AI, and it sets up a very different backdrop heading into this midterm-year window than in earlier cycles when Microsoft was a smaller slice of the S&P 500.
In late January, Microsoft reported fiscal Q2 2026 results that topped Wall Street estimates, with revenue up 17% year over year and adjusted earnings of $4.14 per share, but the stock slipped as investors focused on a slight deceleration in Azure growth to 39%.[2] A separate analysis two days later highlighted how Microsoft’s backlog and AI demand remain strong, yet also flagged concerns about how much capital spending and margin pressure might be required to sustain that growth.[5]
More recently, commentary in mid-February questioned whether Microsoft is truly leading in AI or simply spending heavily to keep pace, pointing to risks around cloud dynamics, AI infrastructure costs and uncertain Copilot monetization.[8] By early March, another piece framed the stock against broader market headwinds, asking whether Microsoft can keep outperforming as investors worry about higher-for-longer rates, stretched tech valuations and the durability of AI enthusiasm.[9]
Those debates matter because Microsoft is now one of the market’s key macro levers. Its AI and cloud businesses sit at the intersection of corporate IT budgets, data center buildouts and the broader “AI revolution” narrative that has helped power the latest leg of the bull market.[1][2][8] If the stock wobbles during a historically weak midterm-year window, the impact can ripple through indices, sector ETFs and sentiment around high-multiple growth stories.
The chart below situates the latest move in its recent multi-month context.
What to watch as the window opens
For traders and portfolio managers, the key dates are straightforward: the historical midterm-year window begins on Apr 17 and runs for 21 trading days into mid-May. The first test will be how Microsoft behaves into that start date. A sharp rally back toward the $425 to $450 area would echo some of the past years where shorts faced early pain before the pattern kicked in, while a drift lower from current levels would mean the window opens with the stock already on the back foot.
On the macro side, watch the policy calendar and rate expectations. Any shift in the path of Federal Reserve cuts, new headlines around AI regulation, or signs that enterprise IT budgets are tightening could all intersect with this historically fragile stretch for mega-cap tech.[8][9] Earnings timing also matters: if Microsoft schedules key guidance updates or AI product news inside the window, that could either reinforce or overwhelm the usual seasonal rhythm.
Levels matter too. On the downside, traders will be watching how Microsoft behaves if it revisits the $360 to $370 zone that sits closer to the 52-week low. A decisive break with heavy volume during the window would line up with prior midterm-year episodes where shorts captured sizable moves. On the upside, a sustained push back above the 50-day moving average near $424.97 with improving breadth across tech would be a clear sign that this cycle might diverge from the historical script.
Finally, because this is a short-oriented pattern in a structurally strong company, the most important tell may be how quickly any rallies are sold. If Microsoft continues to see sellers fade strength during this 21-day stretch, that would fit the six-for-seven record. If instead buyers step in aggressively on dips and the stock grinds higher through the window, it would mark only the second clear miss for this midterm-year setup and signal that the AI era is rewriting at least one corner of the seasonal playbook.
Sources
- Seeking Alpha: Microsoft keeps Outperform rating as Wedbush sees 'robust' Q4 results (Jul 25, 2025)
- Seeking Alpha: Microsoft stumbles even as Q2 results top estimates (Jan 28, 2026)
- Business Insider: Microsoft Stock Surges After It Posts Another Earnings Beat (Jul 30, 2025)
- Forbes: Buy MSFT Stock At $500? (Aug 27, 2025)
- The Motley Fool: Is It Time to Buy Microsoft Stock as Its Backlog Soars? (Jan 30, 2026)
- CNBC: Stocks making the biggest moves after hours, including Microsoft (Oct 29, 2025)
- Seeking Alpha: Microsoft's Lack Of Leadership In AI, Wait (Feb 16, 2026)
- Forbes: Can Microsoft Stock Defy Market Headwinds? (Mar 4, 2026)