Microsoft (MSFT) Has Rallied in 10 Straight 157-Day Windows, Averaging 18.85% Gains
Microsoft is entering a historically powerful 157-day stretch just as its stock trades well below last year’s peak and investors debate how much AI growth is already priced in.

Seasonal window
Microsoft has booked gains in this 157-day spring-to-early-fall window in every one of the past 10 years, with an average profit of 18.85%. The latest iteration begins today with the stock at $401.86, about 26.8% below its 52-week high of $549.14 and sitting closer to the middle of its one-year range than the top.[9]
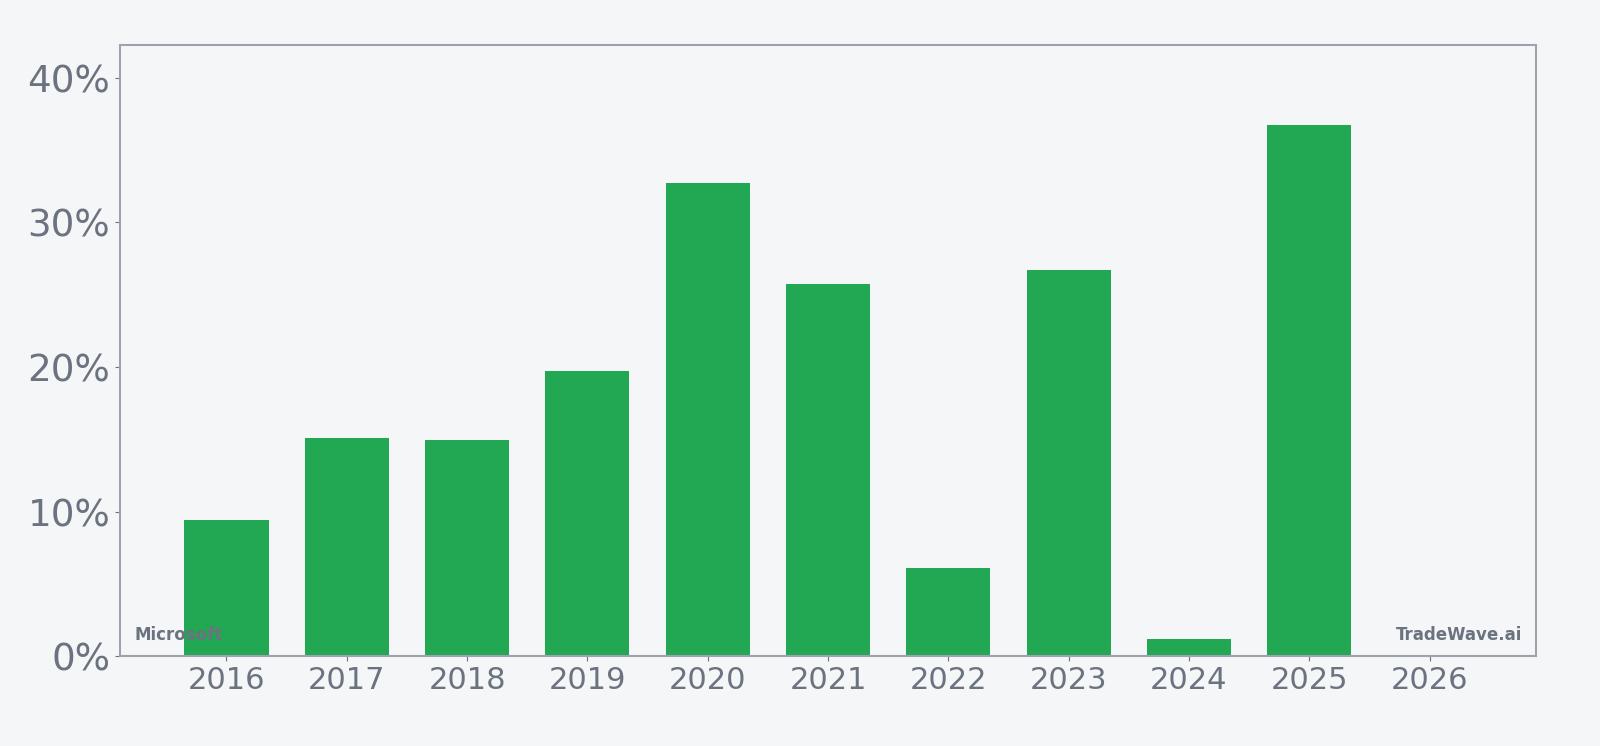
Across the decade-long sample, the trade direction for this pattern is long, and the record is unusually clean: 10 winners, 0 losers, for a 100% success rate. Average gains of 18.85% across those winning years stack up to a 438% cumulative return over the full period, with a median outcome of 17.4% that shows the typical year has delivered a mid-teens to high-teens move rather than a one-off outlier.
The intraperiod path has not been a straight line. In the strongest year, 2025, Microsoft finished the window up 36.77% after a maximum favorable move of 46.91%, while the weakest year, 2024, still ended positive at 1.18% but saw a best run-up of 13.03% and a worst drawdown of 6.94% from the entry. Those maximum favorable and maximum adverse excursions show that even in winning years, the stock has often swung meaningfully both ways before settling higher.
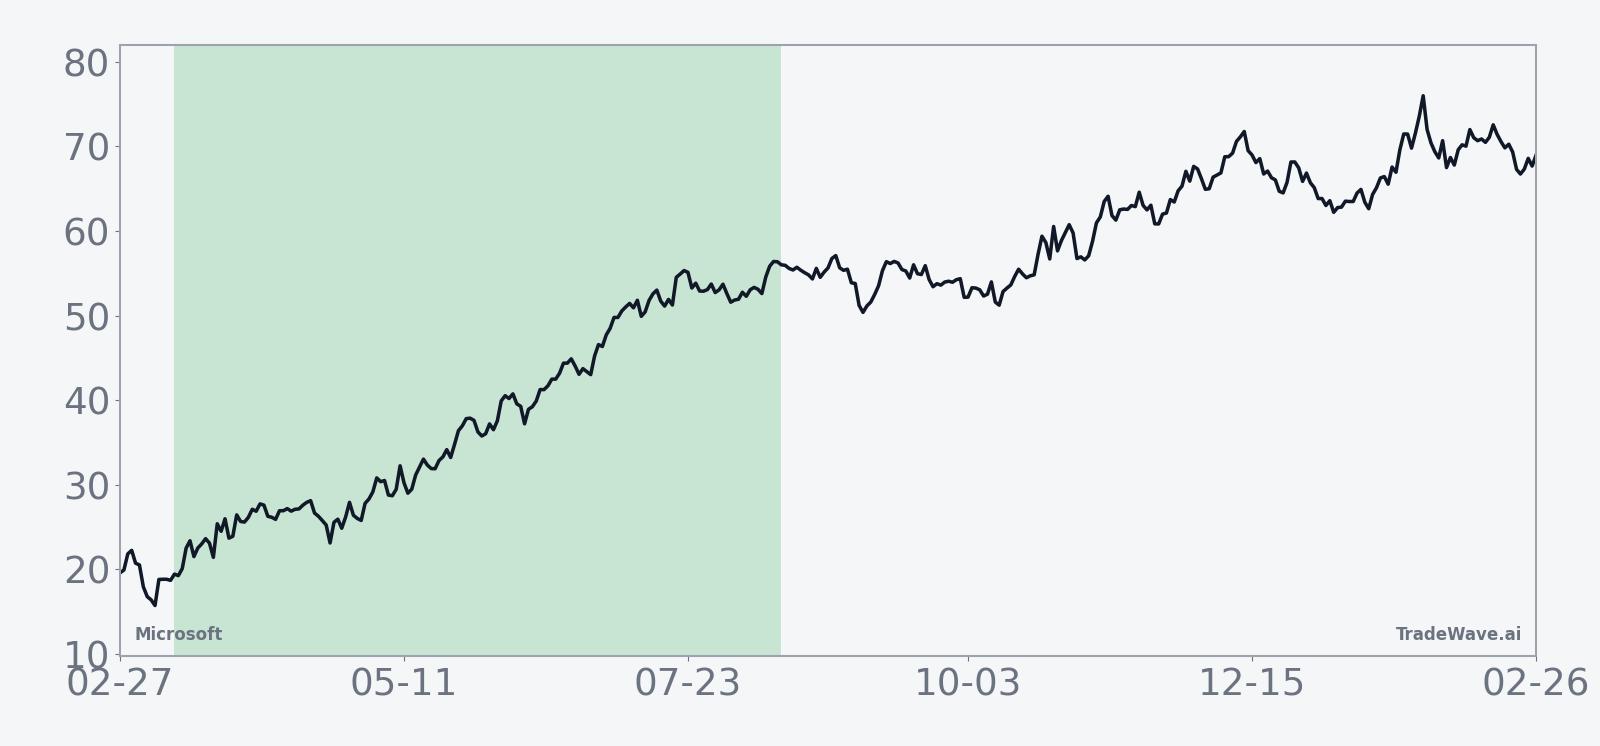
The 10-year average seasonal trend suggests gains tend to build steadily rather than in a single burst. The curve climbs through the first half of the window, pauses in the middle with some choppier behavior, then accelerates again into the final third, echoing how several individual years have seen late-window strength.
A second view that layers in peak run-ups and worst drawdowns by year shows how much room Microsoft has historically had to move inside this window.
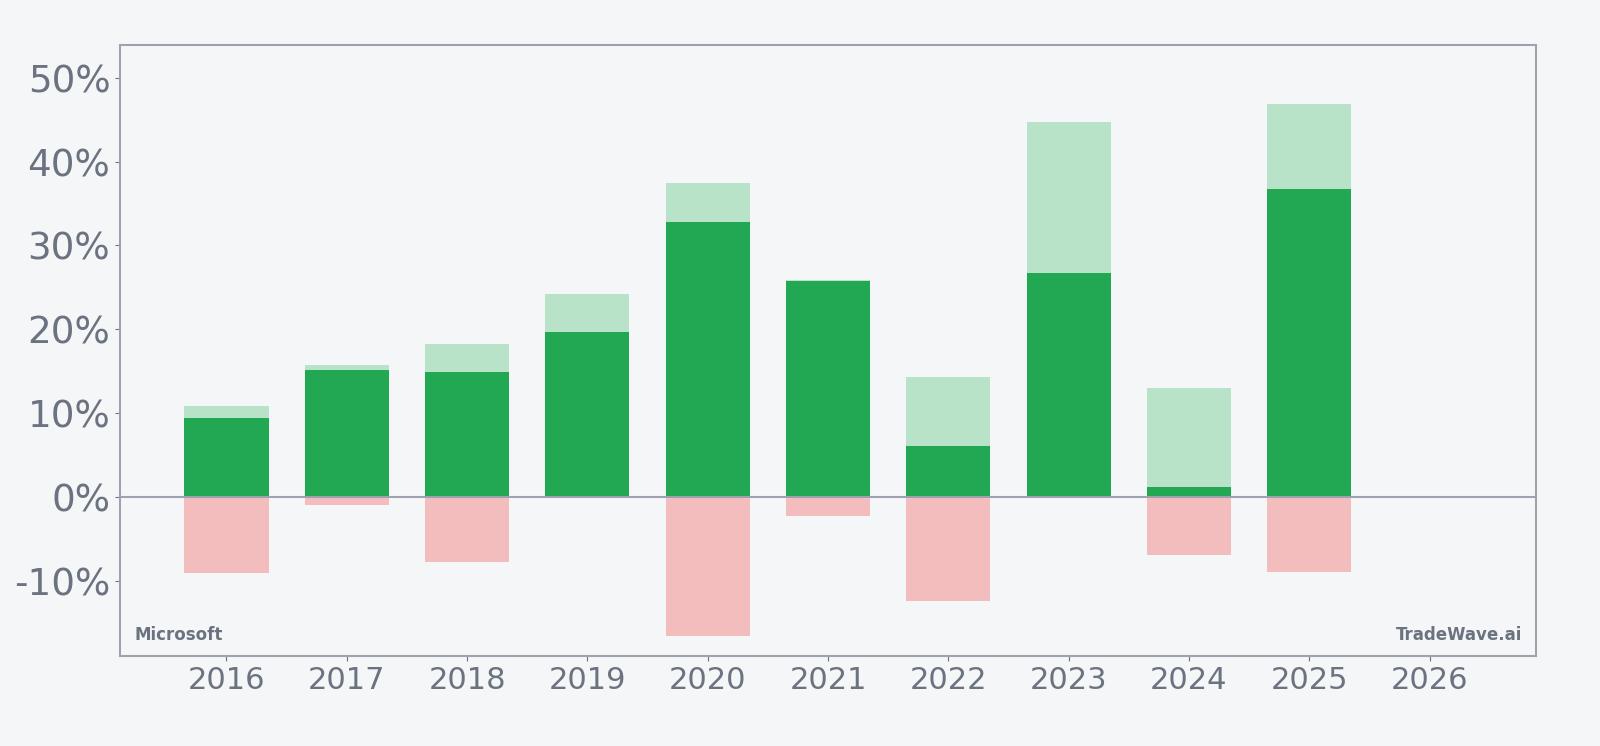
The stacked net, maximum favorable, and maximum adverse bars underline that upside has usually outweighed downside, but not without volatility. Years like 2020 and 2023 saw maximum favorable moves above 35% and 40% respectively, paired with worst drawdowns in the mid-teens or low single digits, while 2016 and 2022 combined mid-single to mid-teens gains with adverse swings of roughly 9% to 12%. The pattern is clear: this window has favored longs in every year of the sample, but it has often required sitting through meaningful pullbacks along the way.
History does not guarantee future results, and even in a clean winning streak like this, worst-case drawdowns inside the window have reached double digits in several years.
Price and near-term drivers
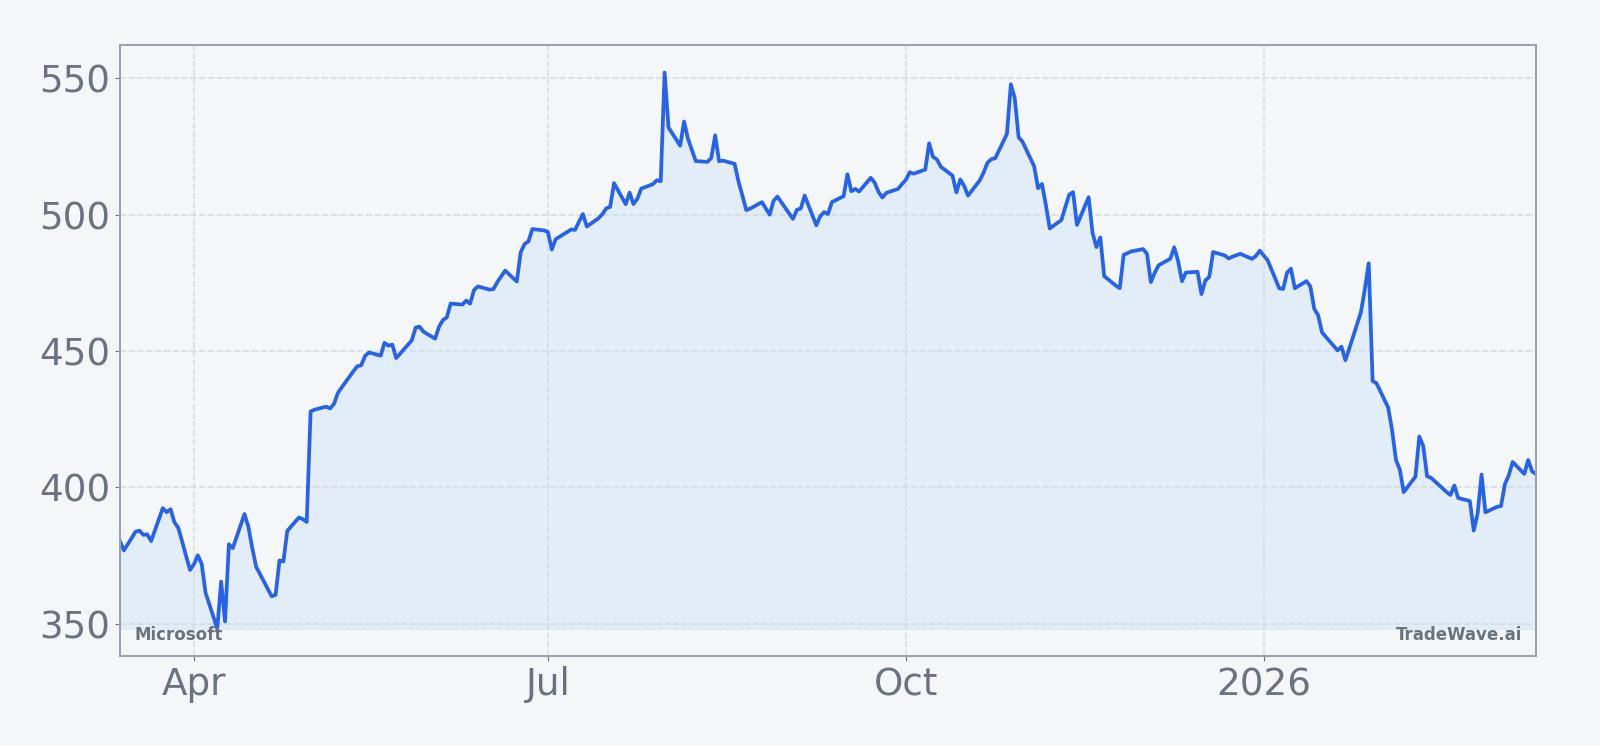
Microsoft shares closed Friday at $401.86, down 0.7% on the day, leaving the stock roughly 18.4% above its 52-week low of $339.57 and well below last year’s high near $549.[9] The pullback from the peak has unfolded even as the company continues to post double-digit revenue growth and strong cloud numbers, a reminder that expectations around artificial intelligence and Azure are already elevated.
On Jan 28, Microsoft’s fiscal second-quarter results topped Wall Street estimates, with revenue up 17% year over year and Azure growing 39%, but the stock slipped as investors focused on signs of a potential deceleration in cloud growth.[2] Commentary around Azure’s trajectory and AI workloads has remained central since then, with analysts and investors parsing whether the current investment cycle can sustain that kind of expansion without compressing margins.[5]
Short interest remains low at about 0.79%, which signals that few investors are willing to bet aggressively against the name despite its size and premium valuation.[8] That positioning backdrop means any negative surprise on growth or regulation could catch the market leaning long, but it also reflects Microsoft’s status as a core holding in AI and cloud portfolios.
The chart below situates the latest move in its recent multi-month context.
Earnings and guidance backdrop
Microsoft’s most recent quarter delivered adjusted earnings of $4.14 per share, with total revenue up 17% and Azure growth at 39%, reinforcing the company’s position at the center of the AI and cloud build-out.[2] Management has highlighted that Azure revenue has surpassed $75 billion, up 34%, and continues to frame AI as a key driver of future cloud demand.
In late January, coverage from The Motley Fool pointed to a swelling backlog tied to AI and cloud deals, arguing that the pipeline supports a multi-year growth story even if quarterly numbers wobble.[5] That backlog narrative has helped offset some of the concern around a slower pace of Azure growth, but it also raises the bar for future quarters, since investors are already assuming a long runway of AI-driven demand.
Analysts remain broadly constructive. A “Buy” consensus rating and a $600 price target from outlets including Seeking Alpha and Forbes reflect confidence in Microsoft’s ability to monetize AI across Azure, Office, and its broader software stack, though that target was set when the stock traded closer to its highs and therefore reflects a more bullish earlier price regime.[1][4][10]
Macro and AI narrative
Microsoft sits at the center of the broader AI adoption story, which has accelerated enterprise cloud deployments and spending on infrastructure.[1] Azure’s role as a platform for training and running large language models has turned the company into a proxy for corporate AI budgets, with every incremental uptick in AI workloads feeding into demand for compute, storage, and software licenses.
Sector commentary has emphasized that cloud and AI growth remain the key engines for large-cap tech, with Microsoft often cited alongside other hyperscalers as a primary beneficiary of the AI infrastructure build.[1] That macro tailwind has helped the stock weather bouts of volatility tied to interest rates and regulatory headlines, but it also means any sign of AI fatigue or slower enterprise adoption could hit the multiple quickly.
Valuation and positioning context
At roughly $402 per share and with short interest under 1%, Microsoft continues to trade as a high-conviction long for many institutional and retail investors.[8] Commentary from Forbes and other outlets over the past year has framed the stock as a potential outperformer even in choppier markets, but has also flagged that rich expectations leave less room for error if growth cools.[4][9]
In early March, Forbes asked whether Microsoft could defy broader market headwinds, noting that the stock’s pullback from its highs came against a backdrop of macro uncertainty and rising questions about how quickly AI spending can translate into durable earnings power.[9] That tension between long-term AI optimism and near-term valuation risk is the backdrop against which this latest seasonal window opens.
According to historical data from TradeWave.ai, this mid-March stretch has behaved very differently from an average calendar period for Microsoft, with a distinct pattern that most investors never see in standard earnings or valuation work.
What to watch from here
The seasonal record sets a high bar: 10 wins out of 10, an average gain near 19%, and a long bias that has rewarded investors who stayed with the trend even through mid-window pullbacks. The key question for this cycle is whether Microsoft’s AI and cloud story can keep delivering enough upside surprises to sustain that pattern while the stock trades well below its prior peak.
First, earnings and guidance will be critical. With the next formal earnings date not yet set, investors will focus on any updates around Azure growth, AI monetization, and backlog conversion, especially after the last quarter’s 39% Azure growth was met with concern about a potential slowdown.[2][5] Stronger-than-feared cloud numbers or clearer AI revenue disclosure would align with the historical tendency for this window to favor the long side.
Second, price levels matter. On the downside, traders will watch how the stock behaves if it drifts back toward the 52-week low area around $340, a zone that has not been revisited since last year.[9] On the upside, any sustained push back through the 50-day moving average near $429.82 would signal that buyers are leaning into the seasonal tailwind rather than fading it.[9]
Third, volatility inside the window will be as important as the final outcome. Past years have seen maximum adverse moves of 9% to 16% even when the trade finished solidly in the green, so a sharp pullback in the coming months would not, by itself, break the seasonal pattern. What would contradict history is a full-window loss, something that has not occurred in this 10-year sample.
Finally, positioning and sentiment bear watching. With short interest still around 0.79%, any negative surprise on AI, regulation, or macro could produce a sharper reaction than the low short base implies, especially if it lands early in the window when historical patterns often see the first leg of gains.[8] If, instead, AI-related headlines stay constructive and Azure growth holds near recent levels, the combination of a clean seasonal track record and a stock trading well below its highs will keep Microsoft front and center for traders looking for large-cap tech exposure through the middle of the year.
Key takeaways
- Microsoft’s 157-day window starting Mar 13 has finished positive in 10 of 10 years, with a 100% win rate for long exposure.
- Average profit across those years is 18.85%, with a 17.4% median gain and 438% cumulative return over the decade.
- Intraperiod swings have been meaningful: several years saw worst drawdowns between about 9% and 16% even as the trade ended higher.
- The 10-year average trend shows gains building early, pausing mid-window, then re-accelerating into the final third of the period.
- Microsoft enters this window about 26.8% below its 52-week high, with AI and Azure growth still driving the fundamental story.
Sources
- [1] Seeking Alpha: Microsoft keeps Outperform rating as Wedbush sees 'robust' Q4 results (Jul 25, 2025)
- [2] Seeking Alpha: Microsoft stumbles even as Q2 results top estimates (Jan 28, 2026)
- [3] Business Insider: Microsoft Stock Surges After It Posts Another Earnings Beat (Jul 30, 2025)
- [4] Forbes: Buy MSFT Stock At $500? (Aug 27, 2025)
- [5] The Motley Fool: Is It Time to Buy Microsoft Stock as Its Backlog Soars? (Jan 30, 2026)
- [6] CNBC: Stocks making the biggest moves after hours, including Microsoft (Oct 29, 2025)
- [8] Seeking Alpha: Microsoft's Lack Of Leadership In AI, Wait (Feb 16, 2026)
- [9] Forbes: Can Microsoft Stock Defy Market Headwinds? (Mar 4, 2026)