This 132-Day Midterm Window Has Hit Nvidia (NVDA) in All 6 Cycles on Record
Nvidia is stepping into a 132-day midterm-year window that has historically favored the short side, just as its AI story remains central to market sentiment.

Key takeaways
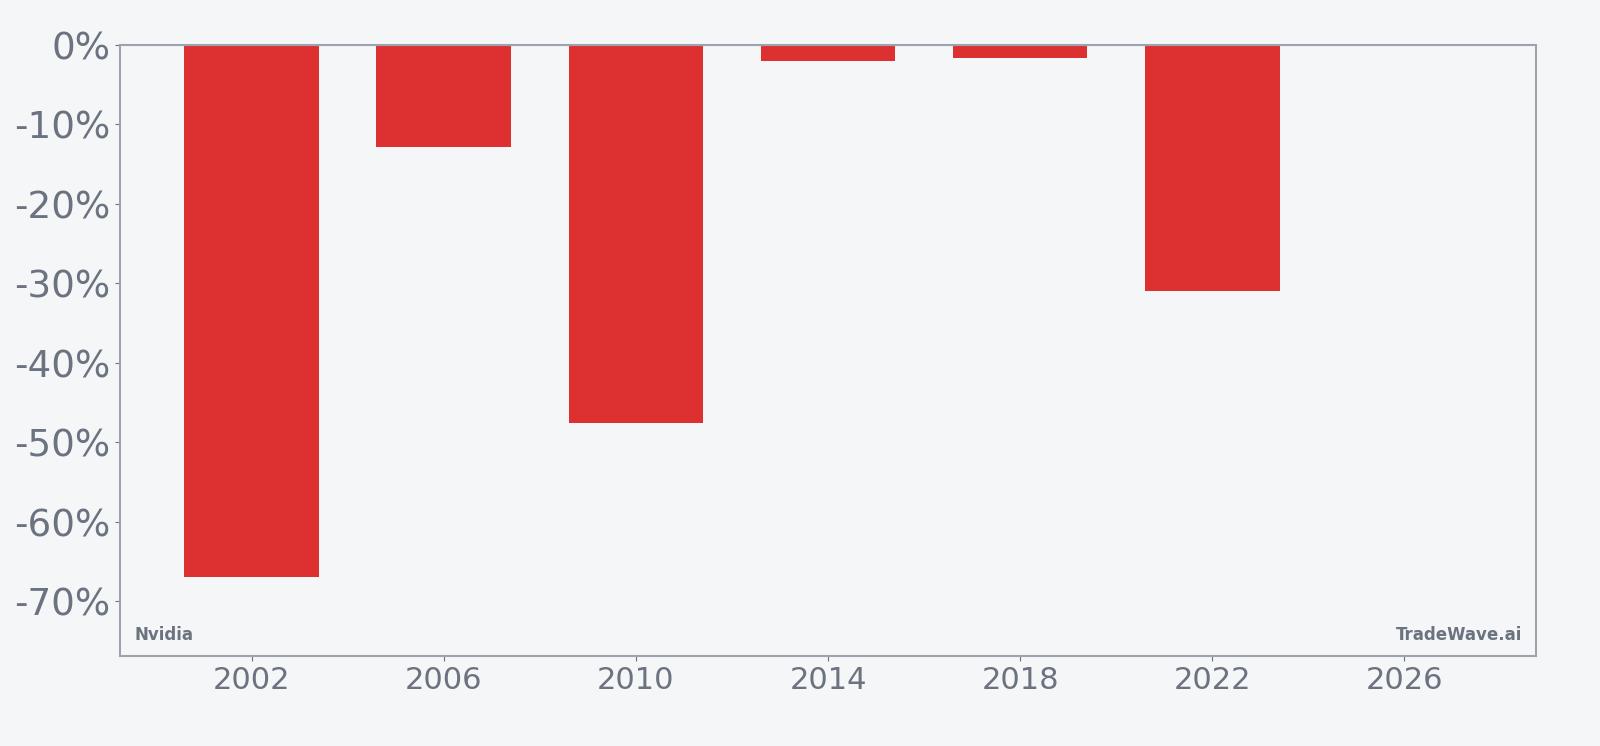
- Nvidia has posted losses in all six prior midterm-year windows starting around Mar 21, a 132-day stretch that has historically favored short exposure.
- The average move in those years was a 27.0% decline, with cumulative losses of 277% across the sample and no winning years for longs.
- The pattern is built on the last six midterm election years, highlighting how policy and liquidity shifts in this phase have lined up with Nvidia weakness.
- Intraperiod swings have been violent, with some years showing deep adverse moves before the trend reasserted, underscoring the need to respect downside volatility.
- Today the stock closed at $175.76, about 17.1% below its 52-week high and roughly double its 52-week low, leaving plenty of room on both sides of the tape.
- History is not destiny, but for a stock as central to the AI trade as Nvidia, a consistently negative midterm window is a risk calendar traders cannot ignore.
According to historical data from TradeWave.ai, this specific midterm-year stretch has behaved very differently from an average quarter for Nvidia, and the new iteration is already underway.
Seasonal window
Nvidia has fallen in all six midterm election years during this 132-day window, averaging 27.0% declines that have rewarded short positioning. The current iteration began on Mar 21 and arrives with the stock at $175.76, about 17.1% below its 52-week high of $212.17 and roughly 103.0% above its 52-week low of $86.59.
The presidential election cycle matters here because this pattern is built only from midterm election years, a phase that has often featured tighter policy, regulatory noise and more selective liquidity for high-multiple growth names. Grouping Nvidia’s history by that specific year in the four-year cycle isolates how the stock has behaved when Washington is focused on fiscal restraint and oversight rather than stimulus or campaign promises.
Across the six midterm years in the sample, the short side has been profitable every time. Percent Profitable sits at 100%, with 6 winners and 0 losers for the short trade, and the average gain for those shorts is 27.0%. In other words, in prior midterm cycles this window has not just leaned lower; it has tended to deliver sizable downside moves rather than small drifts.
The per-year table shows how uneven those declines have been. The strongest year for shorts was 2002, when Nvidia dropped 66.89% from entry to exit, while 2014 was the mildest with a 2.03% decline. Even in the softer years like 2014 and 2018, the stock still finished the window lower, which is why the all-years average lines up with the average winner figure.
Intraperiod swings have been large. In 2002, the best point-to-peak move in favor of shorts, known as the maximum favorable excursion, reached 1.8%, but the worst drawdown from entry, or maximum adverse excursion, hit 70.8% as the stock squeezed higher before rolling over. Other years such as 2010 and 2022 also show deep adverse excursions of 49.11% and 47.42% respectively, paired with net declines of 47.57% and 31.01%, which tells traders that even historically successful short windows have not been smooth rides.
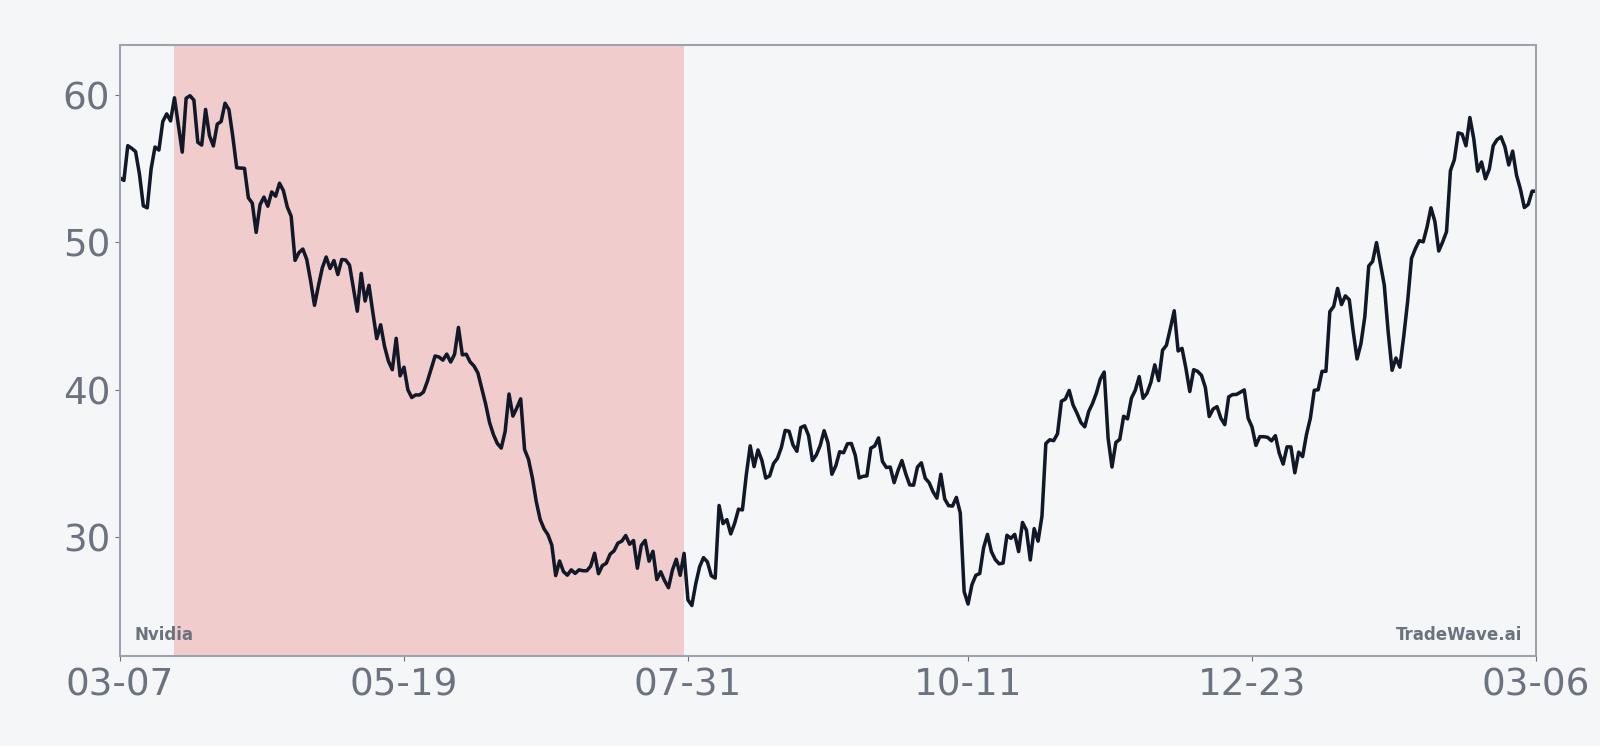
The historical seasonal trend chart for this window slopes lower across most of the 132 trading days, with the steepest part of the decline typically clustering in the middle of the window rather than right at the start or end. That suggests prior midterm years often saw Nvidia chop or even bounce early before the heavier selling pressure showed up later in the stretch.
A stacked view of net returns alongside best and worst intraperiod moves shows how often big swings have accompanied those declines.
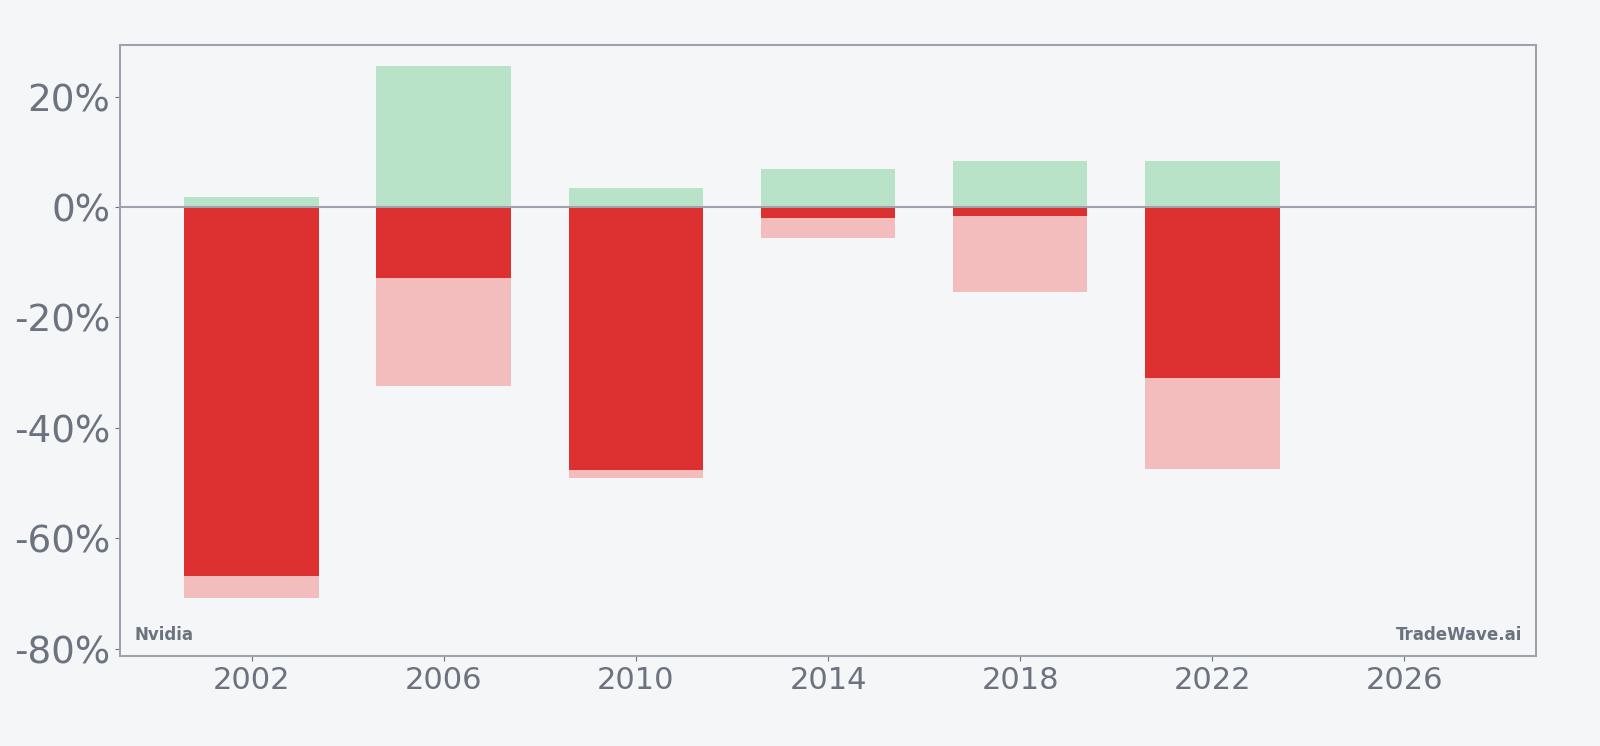
The stacked bars make the trade-off clear. Years like 2002 and 2010 delivered large net declines for longs, which favored the short side, but they also featured big countertrend rallies that would have pressured shorts before the trend reasserted. Add it up and you get a pattern that has been consistently negative for Nvidia in midterm years, yet volatile enough that timing and risk controls have mattered as much as direction.
History does not guarantee future results, and even in windows that have always finished lower, adverse excursions can be large enough to challenge any position that is not sized and managed carefully.
Price and near-term drivers
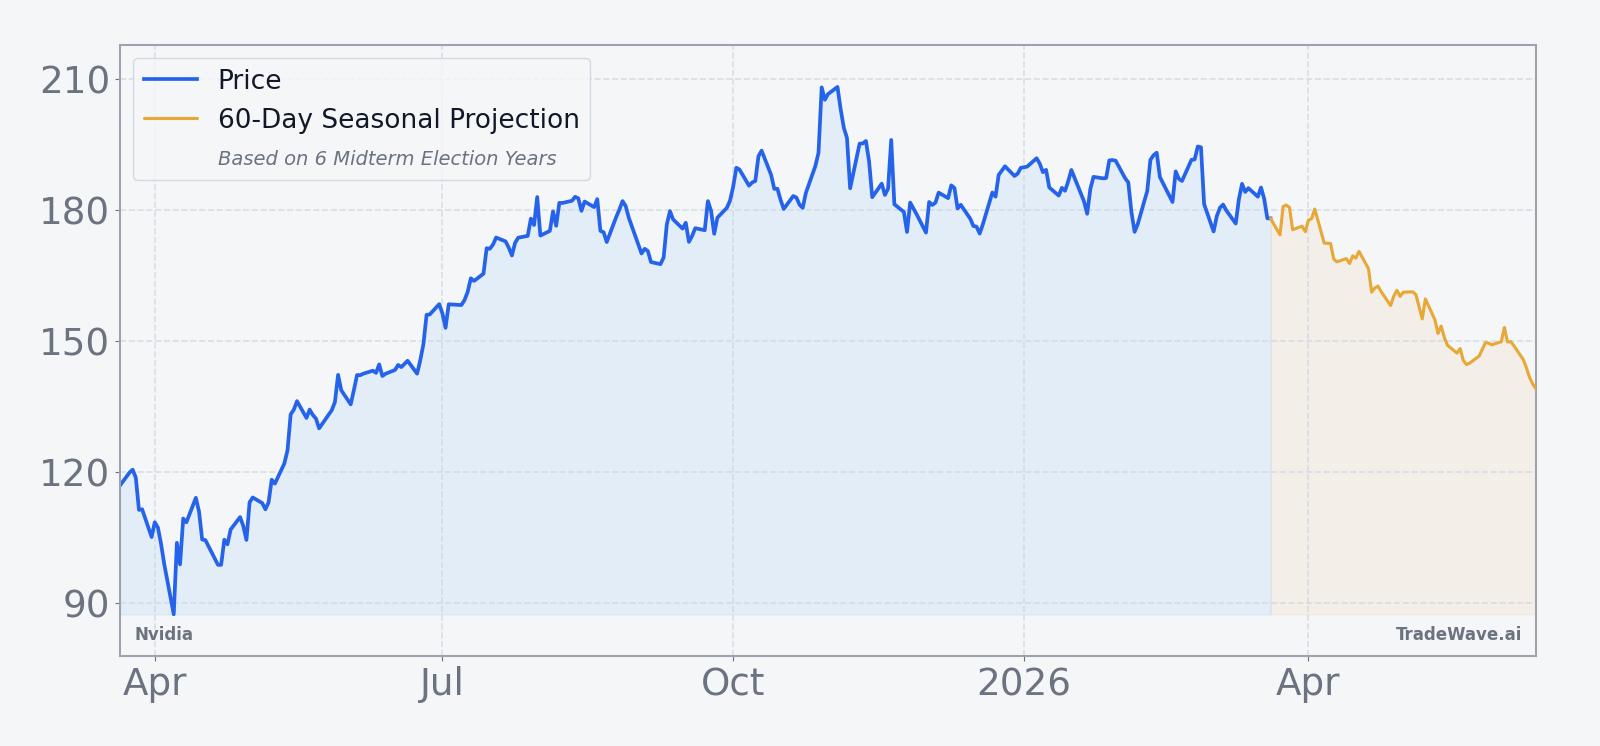
Nvidia closed Monday at $175.76, up 1.77% on the day, with roughly 122 million shares changing hands against a 20-day average volume of about 200 million. The stock sits about 17.1% below its 52-week high of $212.17 and roughly 103.0% above its 52-week low of $86.59, while trading modestly under its 50-day moving average near $184.60, a setup that leaves it in a cooling phase after a powerful multi-year AI run.
The chart below situates the latest move in its recent multi-month context, including a 60-day seasonal projection overlay that reflects the historical midterm-year pattern rather than a price forecast.
Fundamentally, Nvidia remains the face of the AI buildout. For its fiscal second quarter of 2026, reported on Aug 27, 2025, the company delivered revenue of $46.7 billion, up 56% year over year, with adjusted earnings per share of $1.05, beating Wall Street expectations and underscoring still-intense demand for its data center GPUs.[1] Analysts at the time projected revenue could climb to $362.5 billion by 2030, with adjusted EPS reaching $8.67, a long runway that has helped investors look through bouts of volatility.[2]
Valuation debates have been fierce. In late 2025, several analysts raised price targets into the $320 to $350 range, arguing that GPU shipments could double and that Nvidia’s AI moat remained intact even as competition from other chipmakers intensified.[1][3][4] Others warned that the stock’s explosive gains had pulled forward years of growth and left little margin for error if hyperscaler spending slowed or regulatory scrutiny around AI hardware tightened.[6][9]
Sector context has been just as important as company specifics. In November 2025, coverage highlighted that Nvidia was no longer the single most crowded AI trade, even though it still dominated the conversation around training chips and data center acceleration.[4] That shift in positioning, combined with a broader semiconductor backdrop where rivals are pushing aggressively into AI silicon, has made the stock more sensitive to any hint of share loss or pricing pressure.[4][13]
Macro themes tie directly into this midterm-year setup. As the next wave of generative AI adoption rolls through the economy, Nvidia sits at the intersection of corporate capex, cloud spending and policy debates over data centers and energy use.[3] Midterm election years often bring a mix of tighter fiscal rhetoric and regulatory hearings, and for a company that has become a symbol of AI exuberance, that combination has historically lined up with choppier trading and, in this specific window, outright downside.
What to watch in this window
For traders and investors, the message from the seasonal data is not that Nvidia must fall again, but that this 132-day stretch has repeatedly behaved differently from the rest of the cycle. Six for six is a rare record for any stock, let alone one that has been a market leader, and it arrives just as Nvidia’s price has slipped below its 50-day moving average while still sitting far above its 52-week low.
Over the coming weeks, the first test will be how the stock behaves around that 50-day line near $184.60. A sustained move back above it with rising volume would signal that buyers are willing to lean into the AI story even in a historically weak midterm window. Failure to reclaim that level, or repeated rejections there, would fit more closely with the prior pattern of mid-window deterioration.
Policy and macro headlines will matter as well. Any shift in the conversation around AI regulation, export controls on advanced chips, or data center power usage could act as a catalyst inside a window that has already shown a tendency toward sharp swings. Midterm-year hearings or draft rules that touch on Nvidia’s core markets would carry extra weight given the stock’s history in this phase of the cycle.
Finally, watch how Nvidia trades on sector news rather than just its own headlines. In past midterm years, weakness in mega-cap leaders has often spilled into broader indices, and Nvidia’s current role in AI and semiconductors means its seasonal pattern can influence sentiment far beyond a single ticker. If the stock starts to track the historical midterm path again, with rallies fading and downside building into the middle of the window, that would be a sign that the old playbook is still in play. If instead Nvidia shrugs off the pattern and grinds higher, it will be one more data point in a cycle where AI has repeatedly rewritten the rules.
Sources
- [1] Barchart.com, "Nvidia Stock Just Got a New Street-High Price Target. Should You Buy NVDA Now?", Oct 27, 2025
- [2] Barchart.com, "Analysts Have High Hopes for Nvidia Ahead of August 27. Should You Buy NVDA Stock Here?", Aug 22, 2025
- [3] CNBC, "Nvidia will soar nearly 75% as GPU shipments double in the next year, says Loop Capital", Nov 3, 2025
- [4] CNBC, "Nvidia is no longer the most popular AI trade. Can it regain its crown?", Nov 18, 2025
- [5] MarketWatch, "Nvidia’s stock has a strong setup ahead of next week’s earnings, this analyst says", Nov 13, 2025
- [6] Seeking Alpha, "Nvidia: It's Not A Bubble, It's A Dam (NASDAQ:NVDA)", Oct 16, 2025
- [7] MarketWatch, "Nvidia’s stock is almost historically cheap — and that’s a good sign for bulls", Dec 1, 2025
- [8] Business Insider, "Watch for this signal in Nvidia stock to capitalize on spring-loaded gains ahead", Sep 3, 2025
- [9] Seeking Alpha, "Nvidia: You're Running Out Of Time To Sell (NASDAQ:NVDA)", Nov 26, 2025
- [11] Seeking Alpha, "Nvidia's Q1 Detonation: Why This AI Juggernaut Is About To Rip Higher (NASDAQ:NVDA)", May 18, 2025
- [12] Seeking Alpha, "Nvidia: The Path To $200 (Rating Upgrade)", Mar 31, 2025
- [13] Seeking Alpha, "Nvidia rises even as Citi trims estimates amid concerns over increased competition (NVDA:NASDAQ)", Sep 8, 2025
- [14] CNBC, "How to get income from Nvidia as chip giant could reach all-time high in near future", May 16, 2025