Match Group (MTCH) Has Dropped in 7 of 7 Midterm April Windows as a 34-Day Weak Stretch Nears
Match Group is heading toward a historically weak 34-day midterm-election-year stretch in April even as the stock settles in the low $30s after a sharp post-earnings spike and pullback.

Key takeaways
- A 34-day seasonal window for Match Group tied to midterm election years begins on Apr 16 and has historically favored downside moves.
- Across the last 7 midterm-election-year runs of this window, Match Group has moved lower every time, aligning with a short trade direction.
- Average profit for the short setup has been 11.52%, with all seven years finishing as winners for the pattern.
- The TradeWave Ratio of 2.71 signals that price has typically traveled meaningfully in the trade direction within the window, not just at the close.
- Intraperiod swings have been large, with several years showing double-digit adverse moves before the trade ultimately worked.
- Today the stock trades near $31 after a volatile earnings reaction, setting up a potential clash between company-specific turnaround efforts and a historically weak midterm-year stretch.
According to historical data from TradeWave.ai, this upcoming midterm-election-year window for Match Group has behaved very differently from an average month on the calendar. The next section looks at how that pattern has played out in prior cycles and what it implies for risk as April approaches.
Seasonal window
The presidential election cycle matters here because this pattern only looks at the last seven midterm election years, a phase that has often featured policy uncertainty and choppy risk appetite. Match Group has declined in all 7 of 7 midterm-year runs of this 34-day window, averaging 11.52% gains for a short position, and the next iteration begins on Apr 16, 2026. Today the stock closed at 31.06, down 1.3% on the day, sitting between its 52-week low of about 25.50 and high near 38.32. That combination of a clean midterm-year track record and a stock trading in the middle of its recent range gives this window more bite than a typical seasonal quirk.
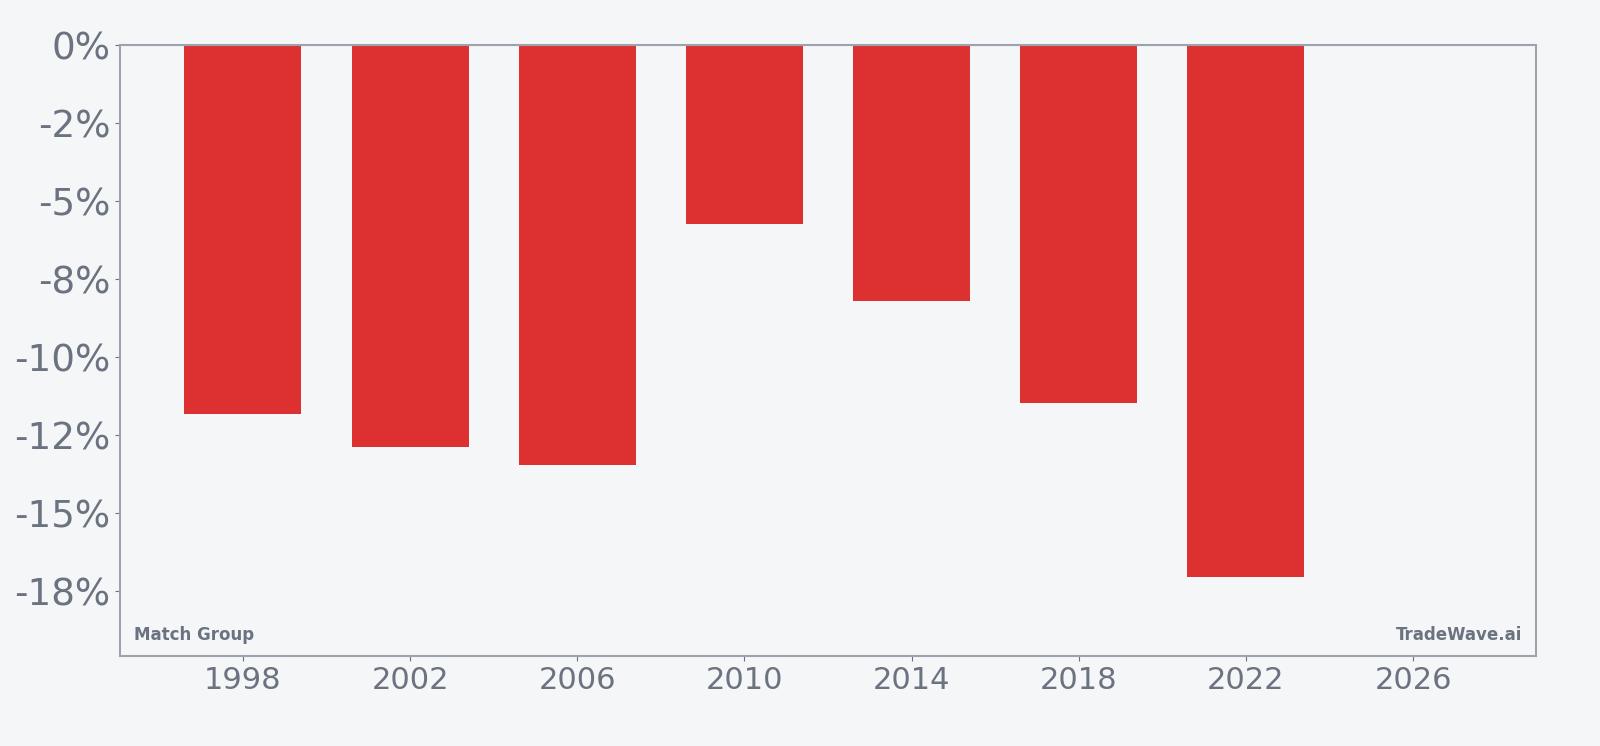
Year-by-year bars that combine net results with peak run-ups and worst drawdowns show how far Match Group has tended to swing inside this window.
Historically this has been a clean short pattern. Percent Profitable sits at 100%, with 7 winners and 0 losers, and the average profit for the short side is 11.52%. In plain terms, every midterm-year run in this sample has seen Match Group finish the 34-day stretch lower than where it started, often by double digits.
The per-year table shows how that has played out in individual cycles. In 2022, the stock fell 17.04% across the window, with a worst intraperiod drawdown of 24.98% from the entry level and a best favorable move of 5.15% before the close. In 2010, the net decline was a milder 5.75%, but the worst drawdown from entry still reached 14.41%, underscoring that even the “smaller” wins for the short side have involved sizable swings.
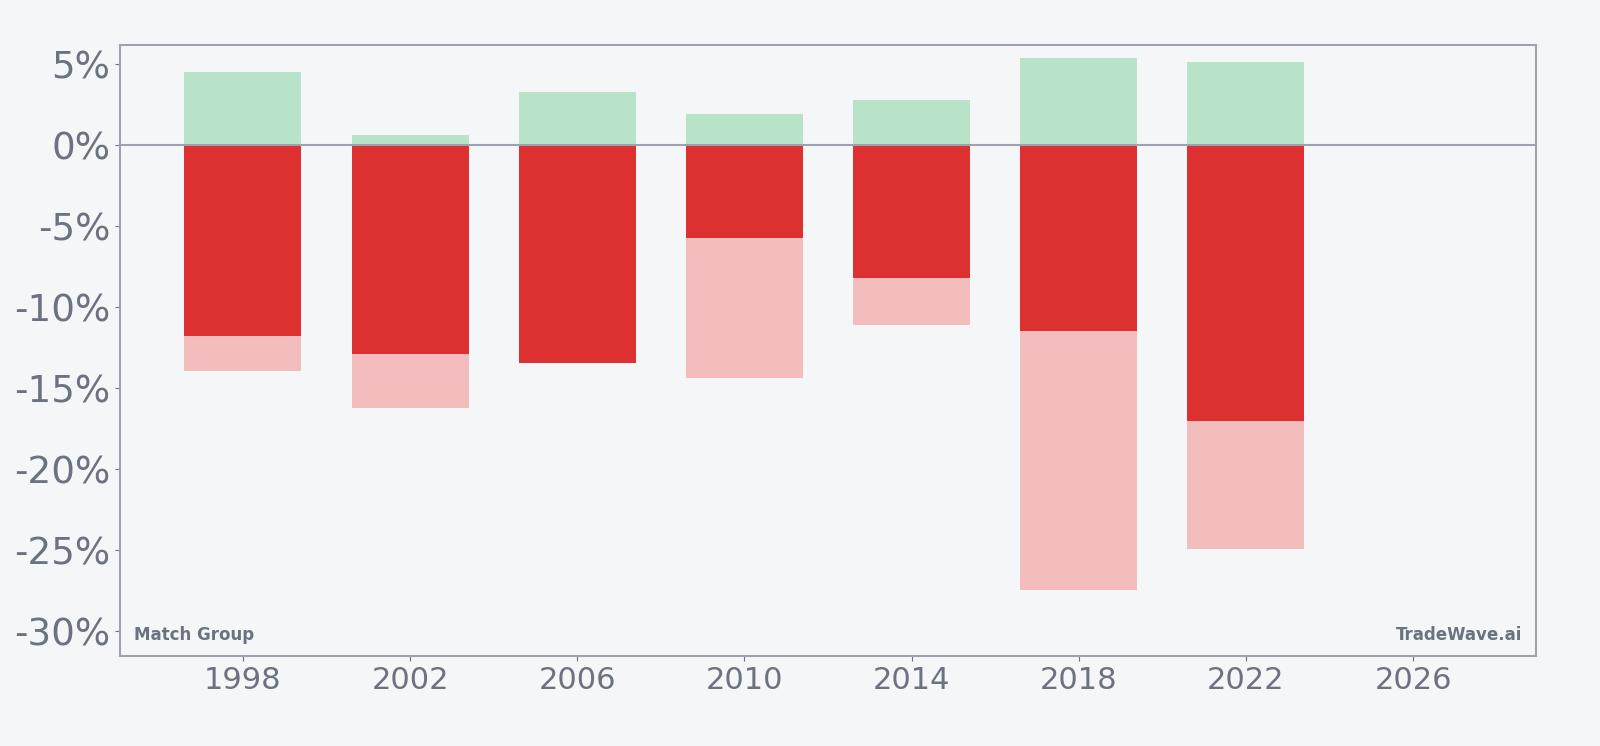
The MFE and MAE profile points to a high-variance environment rather than a smooth grind lower. Maximum favorable moves for the short side have often been in the mid-single digits, while maximum adverse moves have stretched into the low to mid-20% range in several years. That means traders who lean into the pattern have historically had to sit through sharp countertrend rallies before the window ultimately resolved in their favor.
The TradeWave Ratio of 2.71 captures that tendency by measuring how far price typically travels in the trade direction within the window, independent of the final close. A Sharpe ratio of 3.05, based on end-of-window outcomes, reflects that despite the noise inside the window, the closing results have been unusually consistent for a short setup.
Looking at the average seasonal trend line, the typical path has featured early choppiness followed by more decisive downside later in the window. The cumulative return curve across all seven midterm years slopes steadily in favor of the short side, with no visible flat spots where the pattern has historically gone missing for an entire cycle.
Two years stand out as bookends. In 1998, the stock dropped 11.82% across the window with a worst drawdown of 13.95% from entry, a relatively contained but still meaningful move. In 2018, the net decline was 11.48%, yet the worst intraperiod drawdown reached 27.47%, showing how violent the path can be even when the final result looks similar on paper.
Put it together and the message is simple: seven for seven, this midterm-year window has rewarded shorts in the past, but it has rarely been a smooth ride.
History does not guarantee future results; adverse excursions can be large even in winning windows, and traders can experience significant drawdowns before any seasonal edge shows up.
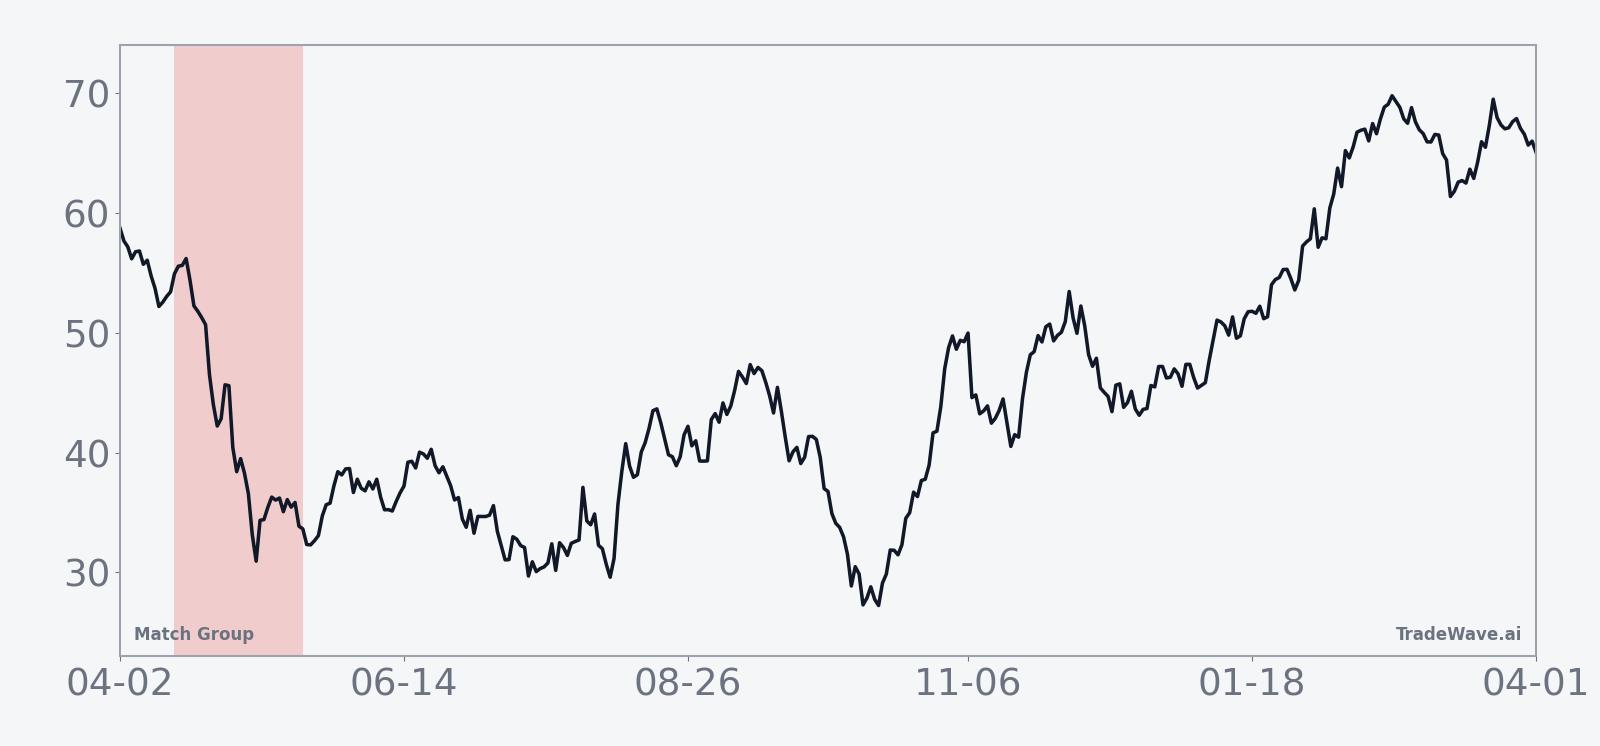
Price and near-term drivers
Match Group closed Friday at 31.06, down 1.3% on the day, after trading between 31.05 and 31.67 with volume well above its 20-day average of about 6.0 million shares. The stock sits roughly in the middle of its 52-week band, about 19.0% below its recent high near 38.32 and about 21.9% above its low around 25.50, with the 50-day moving average close by at 31.18.
That middling price position follows a volatile earnings season. On Feb 3, Match Group reported fourth-quarter revenue of $878 million, topping estimates of $871.3 million, and net income of $209.7 million, or 83 cents per share, up from a year earlier.[1] The company also forecast first-quarter revenue between $850 million and $860 million, ahead of analyst expectations, as management pointed to gains from turnaround efforts including user experience upgrades and international expansion.[1]
The catch is on the user side. Paying users fell 5% to 13.8 million in the quarter as Match Group poured roughly $60 million into artificial intelligence initiatives and product testing, a spend that management has flagged as a headwind to near-term monetization.[2] That mix of better-than-expected revenue and softer user trends left investors debating whether the turnaround is gaining traction fast enough to offset the investment drag.
Options and stock traders reacted quickly. Shares jumped about 12% in extended trading immediately after the earnings release as investors focused on the upbeat revenue outlook and early signs that product changes were resonating.[1] Since then, the stock has given back a chunk of that move, settling into the low $30s as the market weighs how much of the turnaround story is already in the price.
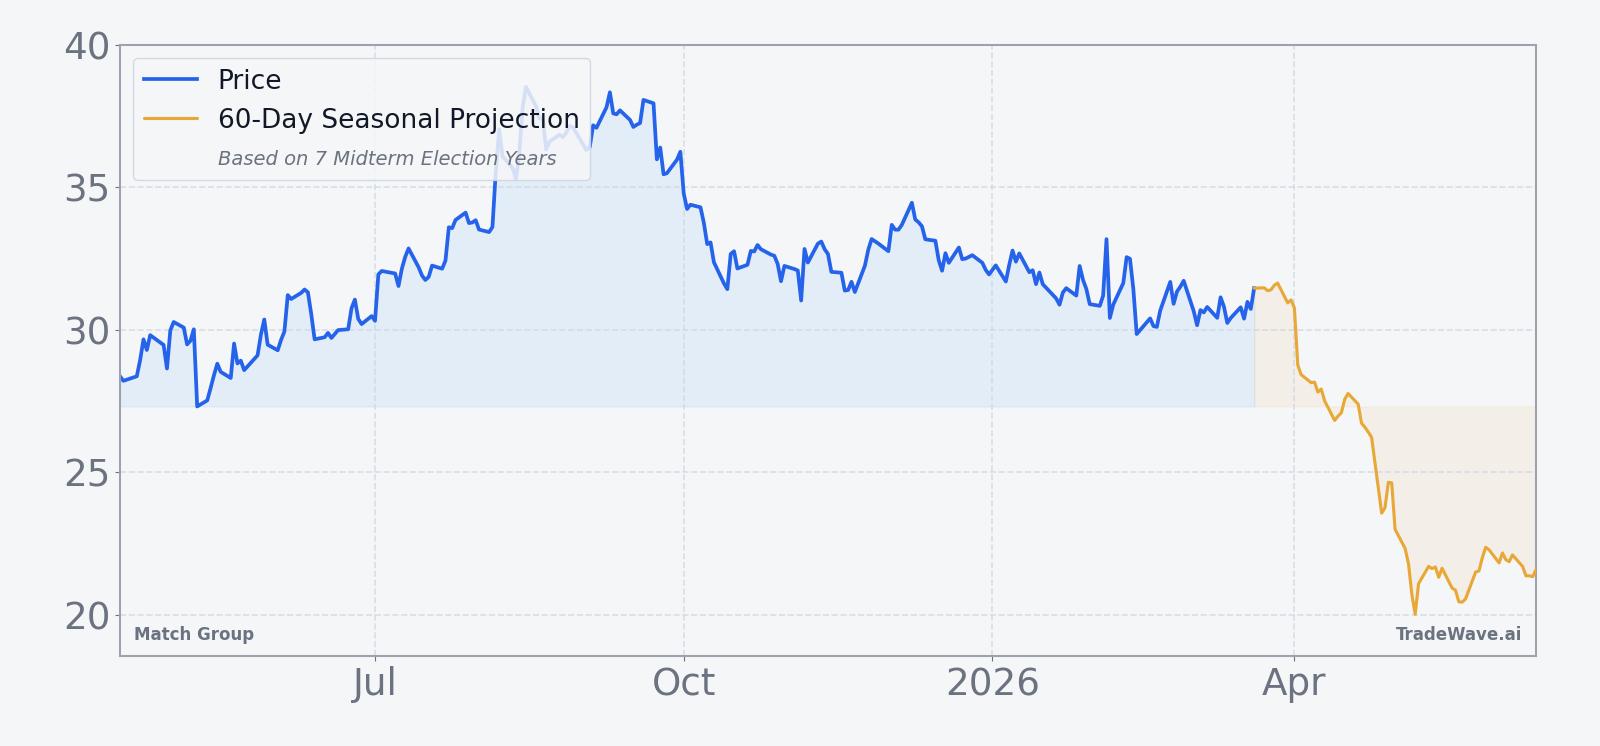
The chart below situates the latest move in its recent multi-month context, including a 60-day seasonal projection overlay for the upcoming window.
What to watch as the April window opens
The next few weeks are about whether company-specific progress or the midterm-year pattern sets the tone. On the fundamental side, investors will track any updates on user trends, especially whether paying users stabilize after the 5% decline reported for the fourth quarter, and how quickly AI-driven features translate into engagement and revenue.[2]
From a price perspective, the band between the 52-week low near 25.50 and the recent high around 38.32 is the key map for this window. A break below the mid-$20s during the 34-day stretch would echo the deeper historical drawdowns seen in 2018 and 2022, while a sustained push back toward the high $30s would mark a clear departure from the seven-for-seven short track record.
Traders who watched the 12% post-earnings spike will also be alert to whether that kind of upside burst repeats as the window opens.[1] If sharp rallies keep getting sold and the stock finishes the window lower, it would fit the historical pattern of big intraperiod squeezes that ultimately resolve in favor of the short side. If, instead, strong upside moves hold and build on themselves, that would be an early sign that this midterm-year run might finally break the streak.
Finally, the broader policy and macro backdrop of the midterm election year will matter. Any shifts in regulation around digital platforms, changes in consumer spending confidence, or swings in risk appetite tied to the political calendar could amplify volatility in a name like Match Group that is already sitting on a well-defined seasonal fault line. The April 16 start date is close, and how the stock behaves into and through that window will tell traders whether this is just another midterm-year dip or the cycle where the pattern finally bends.