Dow Jones Industrial Average (DJI) Has Risen in 17 of 18 Midterm Sep-Apr Windows
Dow Jones Industrial Average is edging higher as it approaches a historically powerful Sep 23–Apr 23 midterm-year window that has often marked a risk-on stretch for blue-chip stocks.
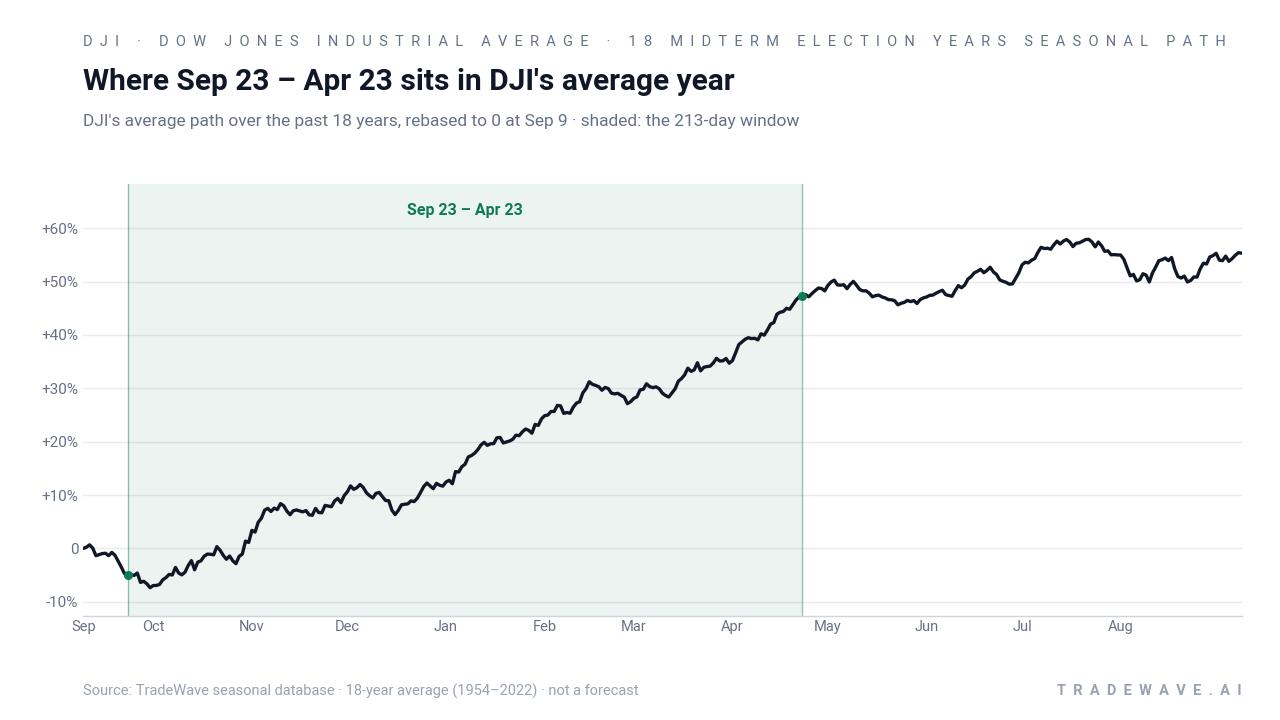
Price as of Sep 2, 2026: $53,061.95 (last close).

What is the seasonal pattern for Dow Jones Industrial Average (DJI)?
Dow Jones Industrial Average has risen in 17 of the past 18 midterm-year Sep 23–Apr 23 windows, with an average gain of 17.3% in winning years.
- 17 for 18 in this window, with winning years averaging 17.3% gains and a 16% average when all years are included.
- Seasonal window runs from Sep 23 for 213 days, covering the late midterm election year into the heart of the year before the presidential election.
- Percent Profitable is 94%, with 17 winners and just 1 loser across the last 18 midterm election years.
- Avg Profit reflects winners only at 17.3%, while Avg Profit - All, which includes the lone losing year, comes in at 16%.
- The TradeWave Ratio of 1.78 signals that price has typically traveled meaningfully in the long direction within the window, even before final outcomes.
- Intraperiod swings have included sharp rallies and occasional deep drawdowns, so the historical edge comes with real volatility risk attached.
According to historical data from TradeWave.ai, this midterm-to-pre-election stretch has behaved very differently from an average slice of the calendar for the Dow. The next section walks through how that pattern has played out across the last 18 comparable cycles.
How has Dow Jones Industrial Average (DJI) traded in the Sep 23–Apr 23 midterm-year window?
Dow Jones Industrial Average has closed higher in 17 of the last 18 midterm-year Sep 23–Apr 23 windows, averaging 17.3% gains in the winning years. The upcoming window begins on Sep 23 and spans 213 days, with the index last closing at 53,061.95, about 3.1% below its 52-week high of 54,744.33. That combination of a strong historical tailwind and a market sitting just off record territory makes this one of the most closely watched seasonal regimes on the blue-chip calendar.
Because this pattern is grouped by the presidential election cycle, it reflects how the Dow has behaved in the last 18 midterm election years rather than in 18 consecutive calendar years. That matters in 2026 because the market is concluding the midterm election year and about to transition into the year before the presidential election, a phase that has often coincided with more supportive fiscal policy, clearer regulatory guidance and a friendlier backdrop for cyclical “old economy” stocks.
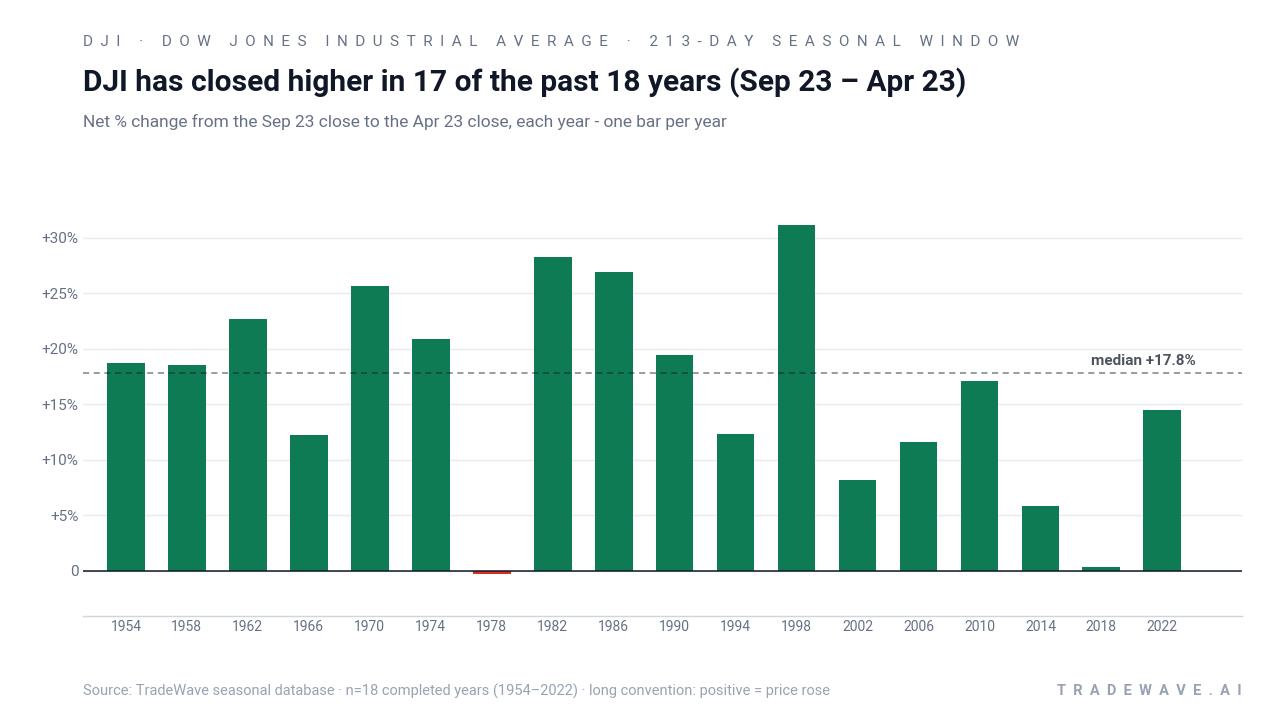
Trade Direction for this setup is long, so the pattern is evaluated from the perspective of buying the Dow at the Sep 23 close and holding through Apr 23 in midterm election years. Across the last 18 such cycles, 17 of those trades finished positive and only one finished negative, which is where the 94% Percent Profitable figure and the 17 winners versus 1 loser count come from. Average gains in the winning years were 17.3%, while including the lone down year pulls the all-years average to 16%, a small gap that reflects how shallow the typical losing outcome has been relative to the winners.
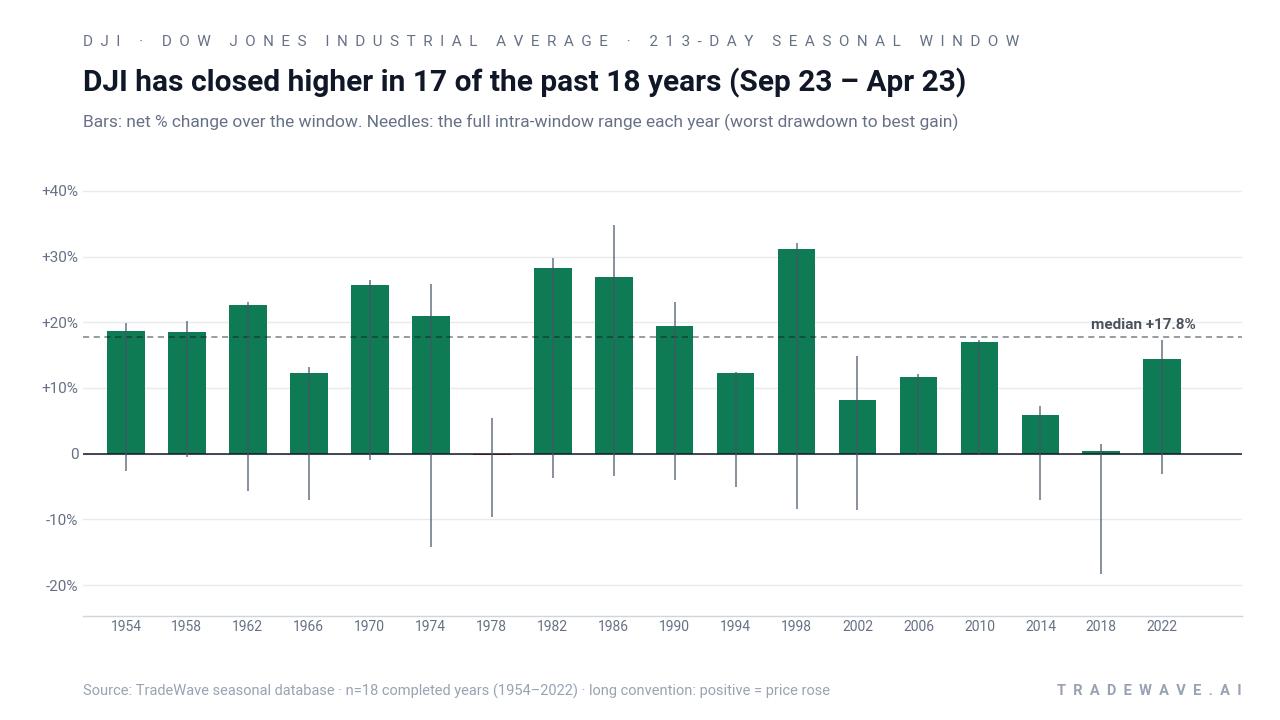
The per-year table shows how that plays out in practice. In 1998, for example, the Dow gained 31.09% between the Sep 23 and Apr 23 marks, with a best intraperiod run-up of 32.02% and a worst drawdown of 8.42% from the entry level. By contrast, 2018 was the one losing year in the sample, with a modest 0.36% net gain but a much deeper 18.26% worst drawdown from the starting point, underscoring how a long-biased window can still deliver painful volatility even when the final result is close to flat.
The maximum favorable move and maximum adverse move profile across years points to a window that has historically offered meaningful upside but not without turbulence. In strong cycles like 1986 and 1990, the best intraperiod rallies reached 34.73% and 23.02% respectively, while the worst drawdowns stayed contained in the low single digits. In more volatile years such as 2002 and 2018, the Dow still finished the window higher, but the worst intraperiod drops of 8.57% and 18.26% would have tested any buy-and-hold conviction.
A second view stacks each year’s net result with its best rally and worst drawdown to show the full intraperiod range.
The cumulative return chart for this pattern compounds those 18 midterm-year windows into a 1,343% gain, which is what you would have earned by repeatedly holding only this 213-day slice and sitting out the rest of each year. That smooth upward slope, combined with a Sharpe ratio of 1.54, signals that the historical edge has not just been about one or two outlier years but a consistent bias toward positive outcomes across decades. Add it up: 17 wins, one small loss and a long-run seasonal regime that has heavily favored long exposure to the Dow during this part of the election cycle.
History does not guarantee future results; adverse excursions within the window can be large even in years that ultimately finish higher.
Why does Dow Jones Industrial Average (DJI) follow this seasonal pattern?
This midterm-to-pre-election window likely reflects a mix of policy and portfolio mechanics. One likely driver is that Washington often shifts from midterm uncertainty to more market-friendly fiscal and regulatory messaging as the next presidential race comes into view, which can support cyclical Dow components. Analysts have also pointed to year-end and new-year rebalancing, sector rotation into “blue boring” industrials and financials, and the holiday and early-year consumer spending cycle as forces that tend to funnel flows into the index during this stretch.
What is driving Dow Jones Industrial Average (DJI) today?
Dow Jones Industrial Average finished the prior session at 53,061.95, up 295 points or 0.56% on the day, leaving it about 3.1% below its 52-week high of 54,744.33 and well above the 52-week low of 44,980.36. The move extends a broader 2026 pattern in which investors have repeatedly rotated into large-cap cyclical “blue boring” Dow names as they trim exposure to high-growth tech, a shift that has helped the index weather swings in oil prices and shifting expectations around Federal Reserve policy.[1]
The chart below shows how that rotation has played out over the past year, alongside the median seasonal path for the next 60 days.
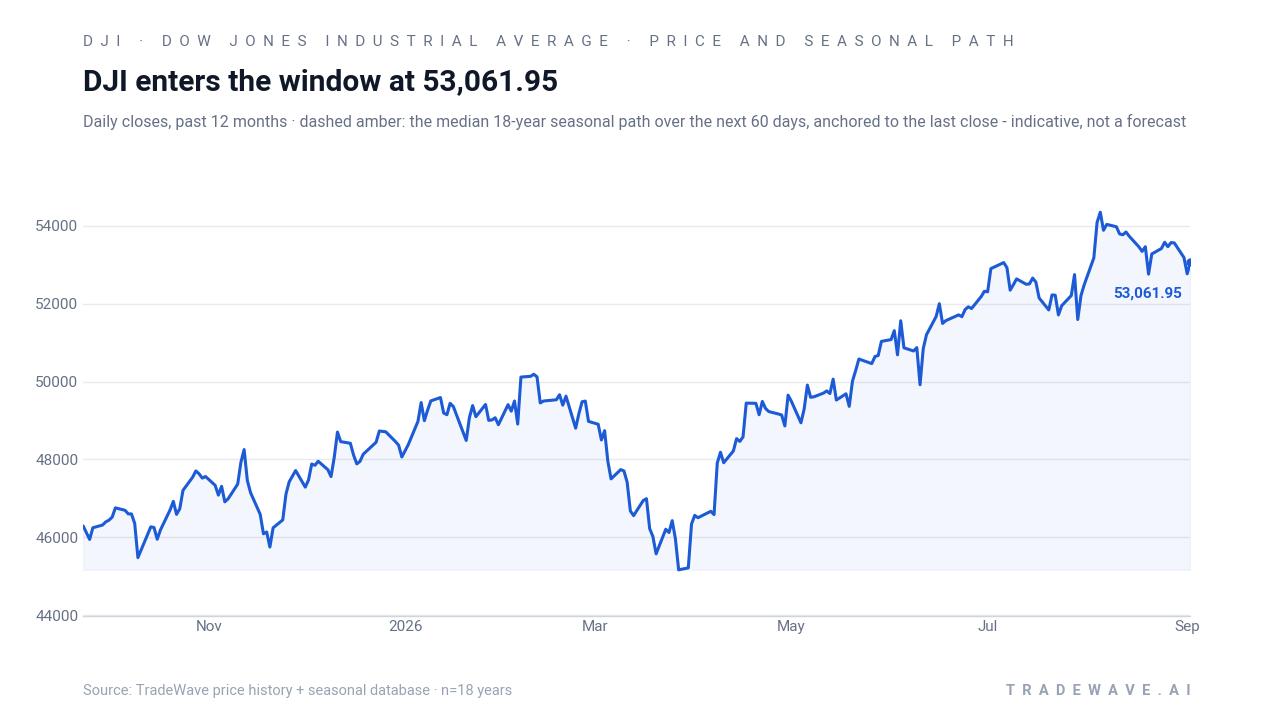
Macro headlines have swung between growth optimism and rate anxiety in recent months. In late April 2026, a rally in oil prices combined with a Federal Reserve rate hold contributed to a multi-day Dow decline as investors worried about margins and tighter financial conditions.[1] By late July 2026, the tone had flipped, with strong corporate earnings and falling oil prices helping drive a three-day winning streak and a 537-point gain in the index.[1] Those cross-currents set the stage for the coming seasonal window, where historical seasonality has often amplified the impact of macro surprises rather than dampening them.
What should traders watch as the Sep 23–Apr 23 window approaches?
For this specific midterm-year window, the first thing to watch is how the Dow behaves as Sep 23 approaches relative to its 50-day moving average of 52,878.17 and its 52-week band between 44,980.36 and 54,744.33. A market that enters the window near the top of that range has historically still managed to grind higher, but the lone soft year in 2018 shows that deep drawdowns can emerge even when the final result is close to flat. Price action around any renewed swings in oil, fresh Federal Reserve communication or signs of fatigue in the rotation into industrials and financials will help confirm whether this cycle is tracking the historical seasonal trend or starting to diverge.[1]
Second, the policy calendar matters. As the midterm election year wraps up and the year before the presidential election comes into focus, traders will be parsing fiscal proposals, regulatory hints and any shifts in the Fed’s reaction function for clues on how supportive the backdrop will be for blue-chip earnings. Historically, years that lined up with clearer policy visibility and stable or falling energy prices tended to sit toward the stronger end of the seasonal distribution, while windows that overlapped with macro shocks produced more jagged paths even when they finished higher.[1]
Finally, behavior inside the window itself will be the real test. If the Dow quickly establishes higher highs and higher lows after Sep 23 while keeping intraperiod drawdowns relatively contained, that would be consistent with the long-run pattern of strong maximum favorable moves and manageable maximum adverse moves. A choppy tape with repeated breaks below key moving averages and outsized downside spikes would signal that this iteration is tracking closer to the more volatile historical years, reminding traders that even a 17-for-18 seasonal record does not remove risk from the trade.
Sources
About this seasonal analysis
Seasonal pattern data is sourced from TradeWave.ai, which analyzes historical price behavior across annual calendar windows going back up to 30 years. Read the full data methodology or the book The 100-Year Pattern by Afshin Moshrefi (2026 edition). Past performance of seasonal patterns does not guarantee future results. This article is for informational purposes only and does not constitute investment advice.