Chicago SRW Wheat (CME) (ZW) Has Rallied in 7 of 8 Midterm Windows, Averaging 14.53% Gains
Chicago SRW Wheat (CME) is trading near the top of its 12-month range just as a historically strong 120-day midterm-election-year seasonal window comes into focus for grain traders.
Price as of Jul 14, 2026: $644.00 (last close).

What is the seasonal pattern for Chicago SRW Wheat (CME) (ZW)?
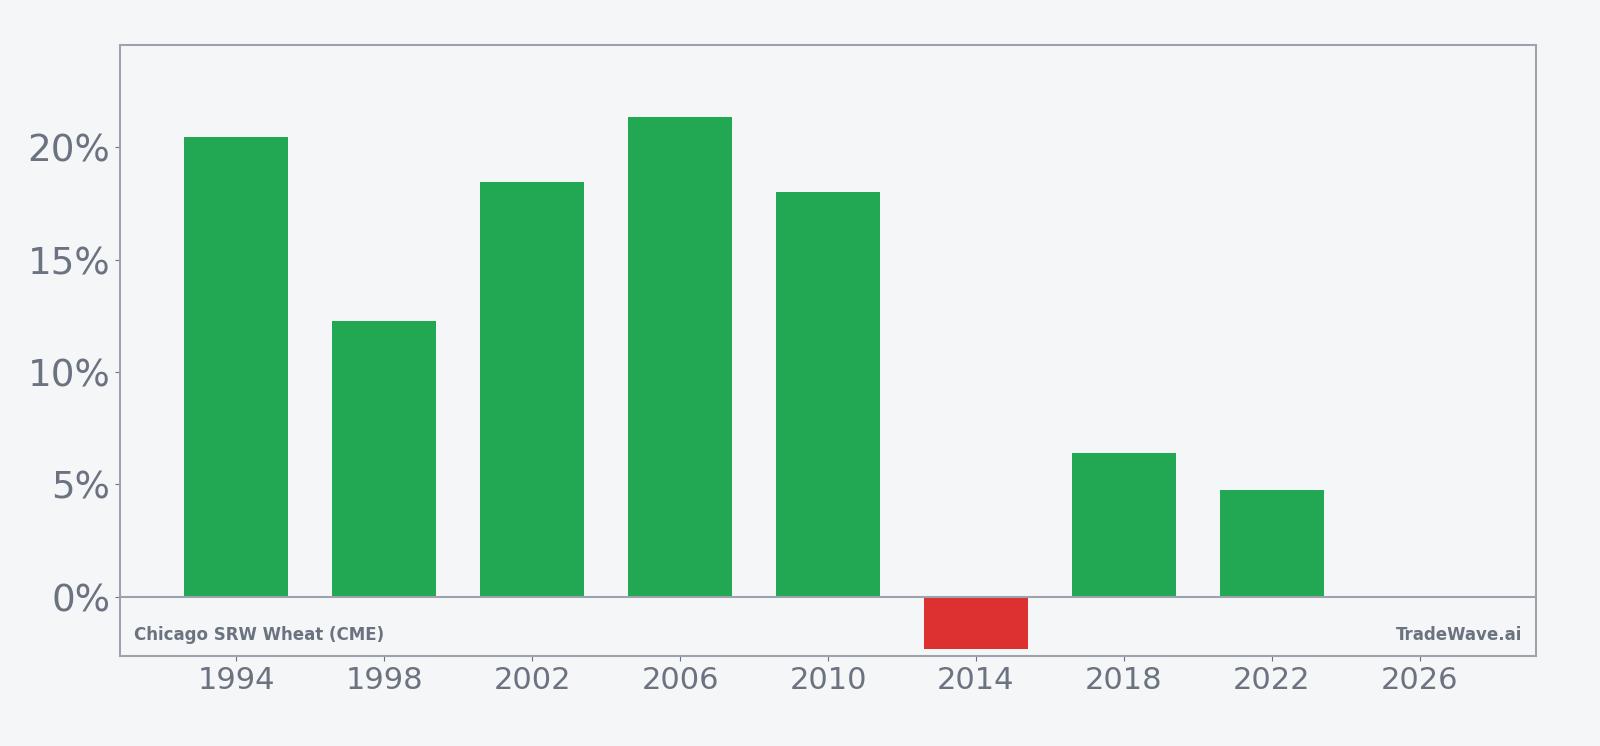
Chicago SRW Wheat (CME) has risen in 7 of 8 midterm-election-year windows during this 120-day stretch, with an average gain of 14.53% in winning years.
- 7 wins and 1 loss in this window, with winning years averaging 14.53% gains and a 149% cumulative return across the sample.
- Percent Profitable sits at 88%, with 7 winners and 1 loser across the last eight midterm election years in this Chicago SRW Wheat (CME) trading window.
- Including the lone down year, Avg Profit - All is still a robust 12%, pointing to a strong bullish seasonal tendency for long positions.
- The worst year in the sample, 2014, lost 2.32% but saw an intraperiod drawdown of 13.3%, showing that downside swings can be sharp even when the final loss is modest.
- The best years, such as 2006 and 2010, posted net gains above 18% with maximum favorable moves above 40%, underscoring how far rallies have run inside this window.
- A Sharpe ratio of 1.28 and a TradeWave Ratio of 2.07 suggest historically attractive risk-adjusted returns for this long seasonal setup.
According to historical data from TradeWave.ai, this midterm-election-year stretch in Chicago SRW Wheat (CME) has behaved very differently from an average quarter, with a distinct bullish bias that many futures desks may be underestimating.
How has Chicago SRW Wheat (CME) (ZW) traded in this midterm-year window?
Chicago SRW Wheat (CME) has risen in 7 of the last 8 midterm-election-year windows that begin around Jul 15 and run for 120 trading days, averaging 14.53% gains in winning years. The front-month ZW contract settled at 644.0 cents per bushel at the prior session’s close, leaving it about 6.4% below its 52-week high of 688.25 and well above the 52-week low of 492.25. That combination of a strong historical seasonal trend and a price sitting in the upper third of its one-year range is why this window is on the radar for grain traders and macro desks alike.
Because this pattern is grouped by the presidential election cycle, it only looks at midterm election years, which often feature shifting farm policy debates and changing expectations for trade and biofuel mandates. The current calendar phase is the midterm election year itself, and this 120-day stretch runs deep into the year before the presidential election, a period that has historically seen risk appetite improve across many cyclical assets.
The trade direction for this setup is long, and the historical record is striking: 88% Percent Profitable with 7 winners and just 1 loser. Average gains of 14.53% in winning years compare with an Avg Loss of 2.32% in the lone down year, leaving the all-years average at 12%. For a major food staple future, that is a meaningful seasonal tailwind rather than a marginal edge.
Looking at individual years, 2006 stands out as the strongest example, with a 21.37% net gain and a maximum favorable move of 41.73% from entry. On the other side of the ledger, 2014 is the only losing year, down 2.32% with a maximum adverse move of 13.3% before partially recovering into the close. That profile shows how the window has historically rewarded longs more often than not, but also how quickly drawdowns can develop when the pattern misfires.
The historical path of returns inside the window tends to build over time rather than spike in a single burst. Trend metrics show 72 days where the seasonal average is higher than the prior day and zero days where the short side dominates, with 57 of those up days clustered in the first half of the window. In plain English, the typical pattern has been a steady grind higher with only brief pauses, not a one-week squeeze.
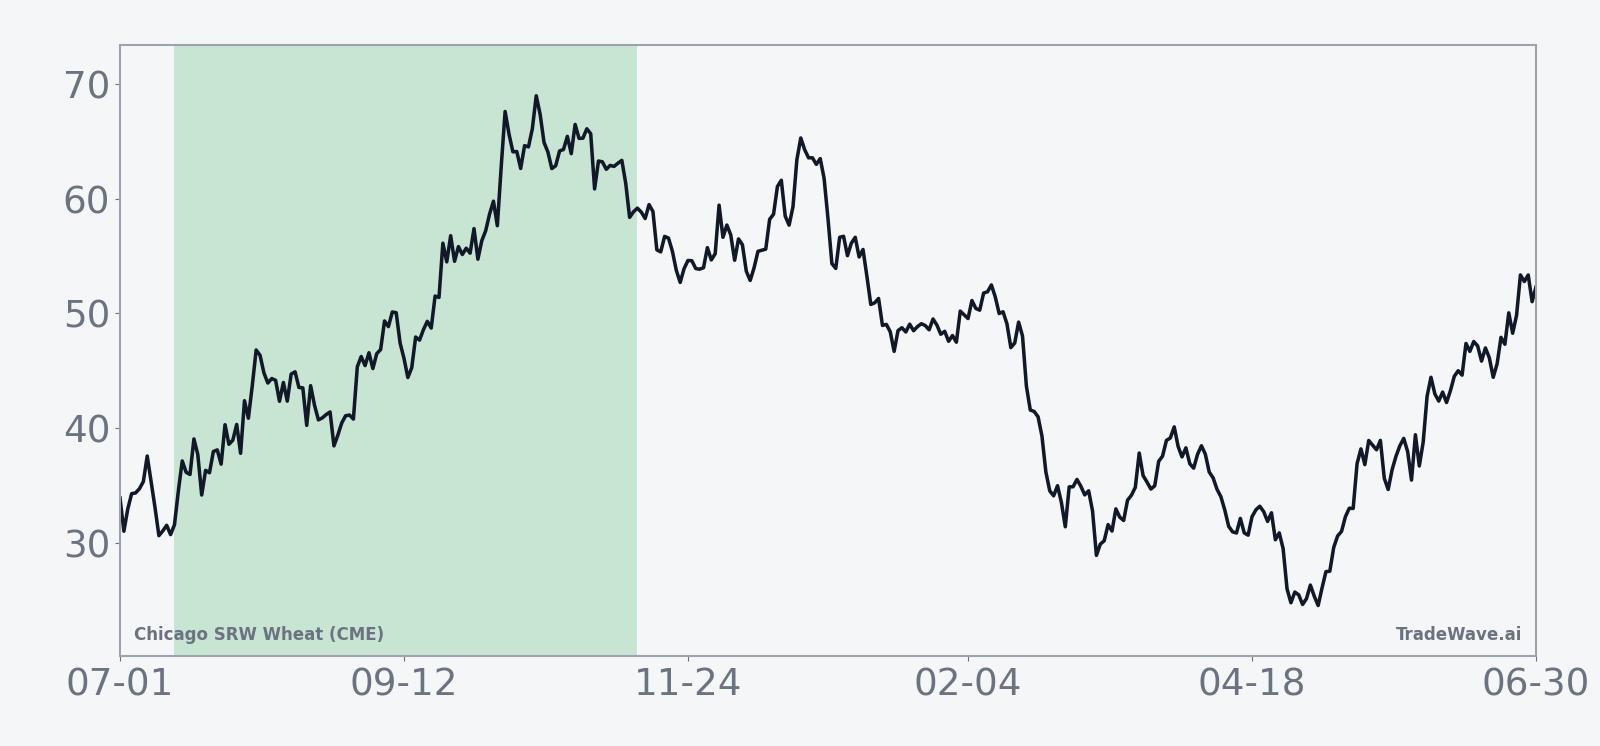
The cumulative return chart for this pattern shows a smooth climb rather than a jagged sawtooth, which is unusual for an agricultural future that often trades on weather headlines and export surprises. Add it up and the window has delivered a 149% cumulative gain across the eight midterm-election-year samples, with only one year breaking the bullish rhythm.
Year-by-year bars that combine net results with peak rallies and worst drawdowns help clarify how much wheat has typically moved inside this window.
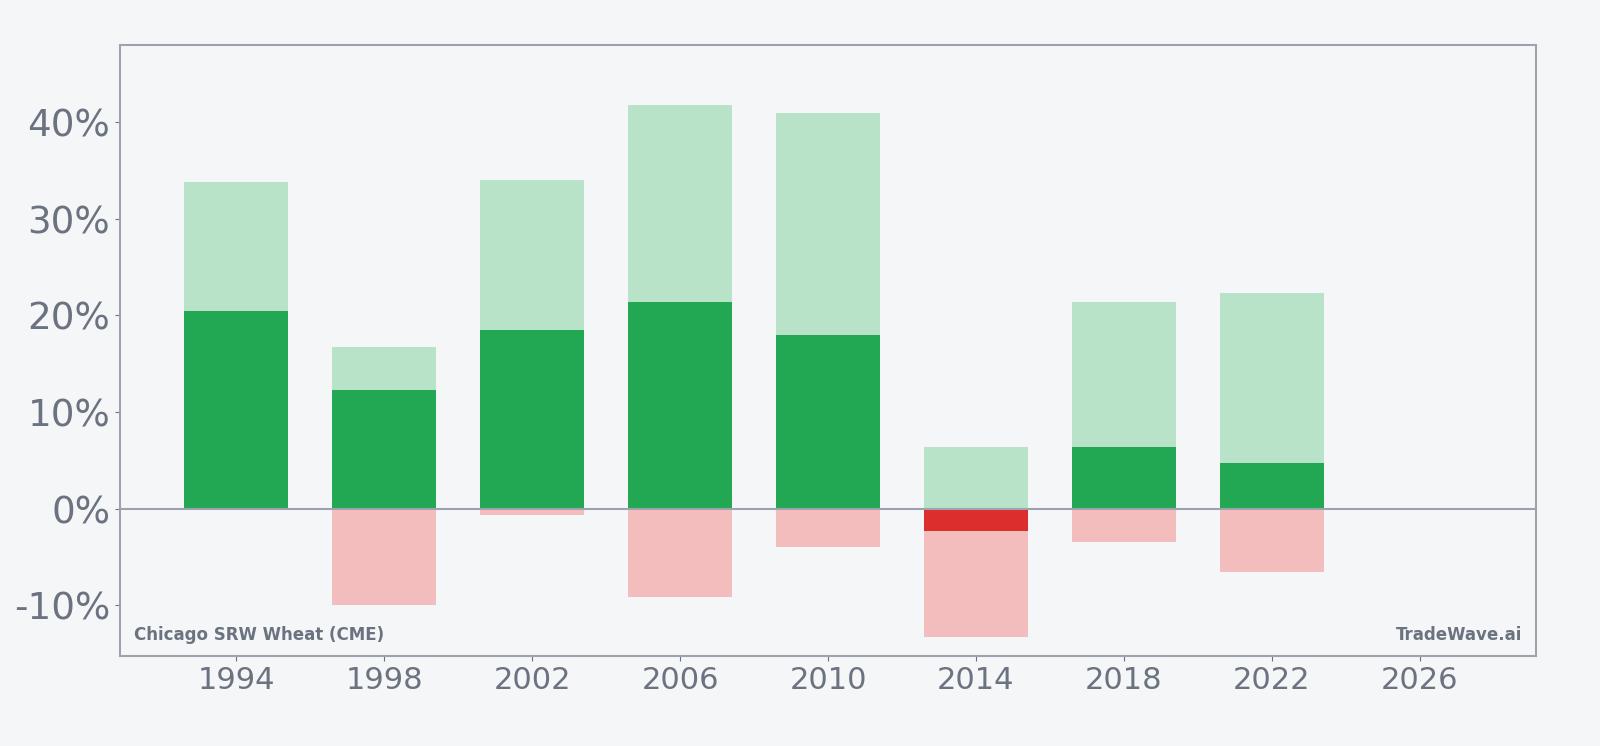
The combined net, maximum favorable move and maximum adverse move bars show that even in winning years, Chicago SRW Wheat (CME) has often swung hard in both directions. Several samples, including 1998 and 2006, saw favorable excursions above 30% while still experiencing adverse moves near or above 10%, a reminder that this bullish seasonal window has historically come with real volatility attached.
History does not guarantee future results; adverse excursions (MAE) can be large even in winning windows.
Why does Chicago SRW Wheat (CME) (ZW) follow this seasonal pattern?
This pattern likely reflects commodity supply and demand seasonality more than pure election politics. The 120-day stretch from mid-July captures the heart of the U.S. growing season, when weather, yield estimates and export programs converge to reset price expectations for the coming marketing year. Analysts also point to portfolio positioning around harvest and the transition from midterm election year to the year before the presidential election, when fiscal and trade policy signals can shift, as reinforcing factors behind this recurring ZW seasonal trend.
What is driving Chicago SRW Wheat (CME) (ZW) today?
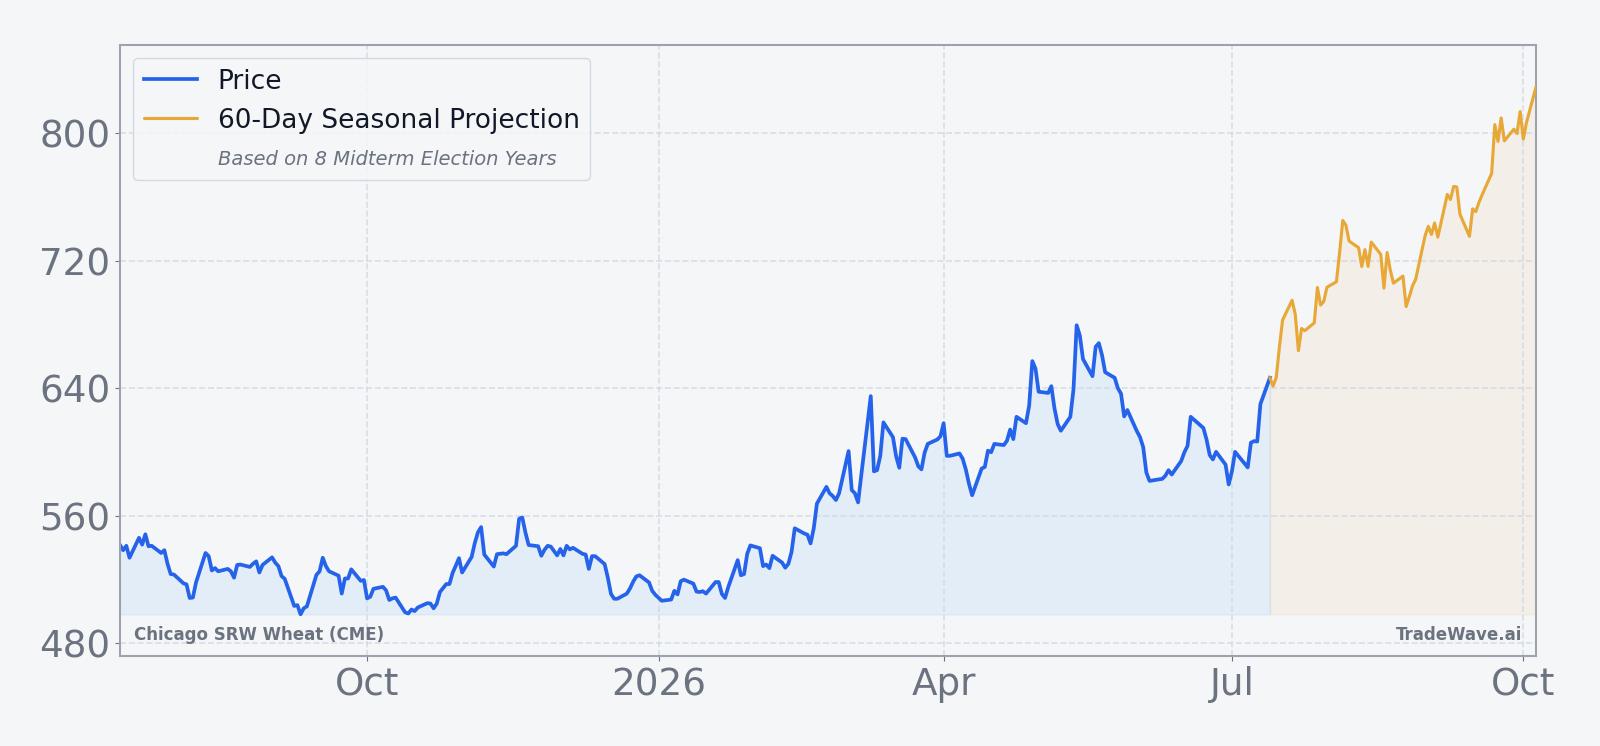
At 644.0 cents per bushel, the prior session’s close leaves Chicago SRW Wheat (CME) up 8.27% over the past month and trading above its 50-day moving average of 616.89 on solid volume near the 20-day average of 64,447 contracts. The contract is sitting in the upper band of its 52-week range between 492.25 and 688.25, a zone where weather headlines and export updates can quickly decide whether prices challenge the old high or fade back toward the middle of the band.
Macro drivers have been mixed in recent months. On Apr 30, 2026, Reuters reported that improved central U.S. weather forecasts and a retreat in crude oil prices weighed on Chicago wheat futures, with USDA weekly export sales described as steady rather than spectacular.[1] That combination of better yield prospects and only average demand helped pull prices lower at the time, and it remains the core tug-of-war for ZW: weather-driven supply optimism versus the need for stronger export or domestic feed demand to justify rallies.
Positioning has also been a factor. Reports from the same period noted that commodity funds were net sellers of wheat, trimming exposure as weather improved and energy markets cooled.[1] When speculative length is light heading into a historically strong seasonal window, it can leave more room for fresh buying if fundamentals turn supportive, but it also means rallies may need clear catalysts to sustain.
The chart below situates the latest move in its recent multi-month context and overlays a short-term seasonal projection.
What should traders watch in this Chicago SRW Wheat (CME) seasonal window?
First, watch how ZW behaves around the 688.25 area, the 52-week high that has capped rallies so far. A sustained push through that level during this 120-day window would be consistent with the historical pattern of strong midterm-year gains, while repeated failures there would be an early sign that this cycle may look more like 2014’s modest loss than the big winners of 2006 or 2010.
Second, monitor U.S. weather and USDA crop updates as the growing season progresses. The last major pullback in late April followed improved weather forecasts and steady export sales, and a repeat of that combination could again blunt seasonal tailwinds if yield expectations keep rising faster than demand.[1] Conversely, any shift toward hotter, drier conditions or a surprise pickup in export bookings could give the seasonal bulls more fuel.
Third, keep an eye on fund positioning and daily volume. If commodity funds move from net sellers to steady buyers while volume holds near or above the recent 20-day average, it would signal that larger players are leaning into the same midterm-year seasonal window that has historically favored longs. If instead rallies occur on shrinking volume and no clear change in positioning, the risk of sharp MAE-style drawdowns inside the window remains elevated.
Finally, remember that this window bridges the midterm election year and the year before the presidential election, a phase when policy rhetoric on trade, biofuels and farm support often heats up. Any surprise on tariffs, export programs or ethanol mandates could either reinforce or overwhelm the historical ZW seasonal trend, so traders will be watching both the weather maps and the policy calendar as this 120-day stretch unfolds.
Sources
About this seasonal analysis
Seasonal pattern data is sourced from TradeWave.ai, which analyzes historical price behavior across annual calendar windows going back up to 30 years. Read the full data methodology or the book The 100-Year Pattern by Afshin Moshrefi (2026 edition). Past performance of seasonal patterns does not guarantee future results. This article is for informational purposes only and does not constitute investment advice.