Gold (COMEX) (GC) Safe-Haven Bid Runs Into a 6-for-6 Midterm-Year Losing Summer
Gold (COMEX) futures are hovering near $4,734 as traders head toward an 84-day midterm-election seasonal window that has produced losses in every cycle since 2002.

What is the seasonal pattern for Gold (COMEX) (GC)?
Gold (COMEX) has fallen in 6 of 6 midterm-election-year windows starting around May 6, with an average loss of 4.41% in those years.
- 6 for 6 on the downside in this window, with average losses of 4.41% across the last six midterm election years.
- Seasonal window begins May 6 and runs 84 trading days, covering the heart of the midterm election year.
- Percent Profitable for the short setup is 100%, with 6 winners and 0 losers over the lookback sample.
- Average winner loss for gold prices in this short pattern is 4.41%, matching the all-years average because there were no losing shorts.
- Intraperiod swings have been meaningful, with several years showing double-digit peak drawdowns before the window closed.
- The pattern aligns with a short trade direction, meaning historical softness in gold prices has favored bearish positioning in this specific stretch.
According to historical data from TradeWave.ai, this midterm-year window has behaved very differently from an average summer for gold, and the next iteration is less than two weeks away.
How has Gold (COMEX) (GC) traded in past midterm-year summer windows?
Gold (COMEX) has dropped in every single midterm-election-year window starting around May 6 since 2002, with shorts averaging 4.41% gains over 84 trading days. Futures settled Thursday at 4,733.7002, leaving the contract about 15.3% below its 52-week high of 5,586.2002 and well above the 3,125.0 low that marked the bottom of the last year’s range. In February 2026, options traders loaded up on far-out-of-the-money December call spreads on Comex gold, a speculative bet on extreme upside that sits awkwardly against this historically weak midterm stretch.[2]
The pattern is grouped by the presidential election cycle, focusing on the last six midterm election years rather than six consecutive calendar years. That matters because policy uncertainty, fiscal debates and shifting rate expectations tend to cluster in midterms, and gold often trades as a referendum on those macro crosscurrents.
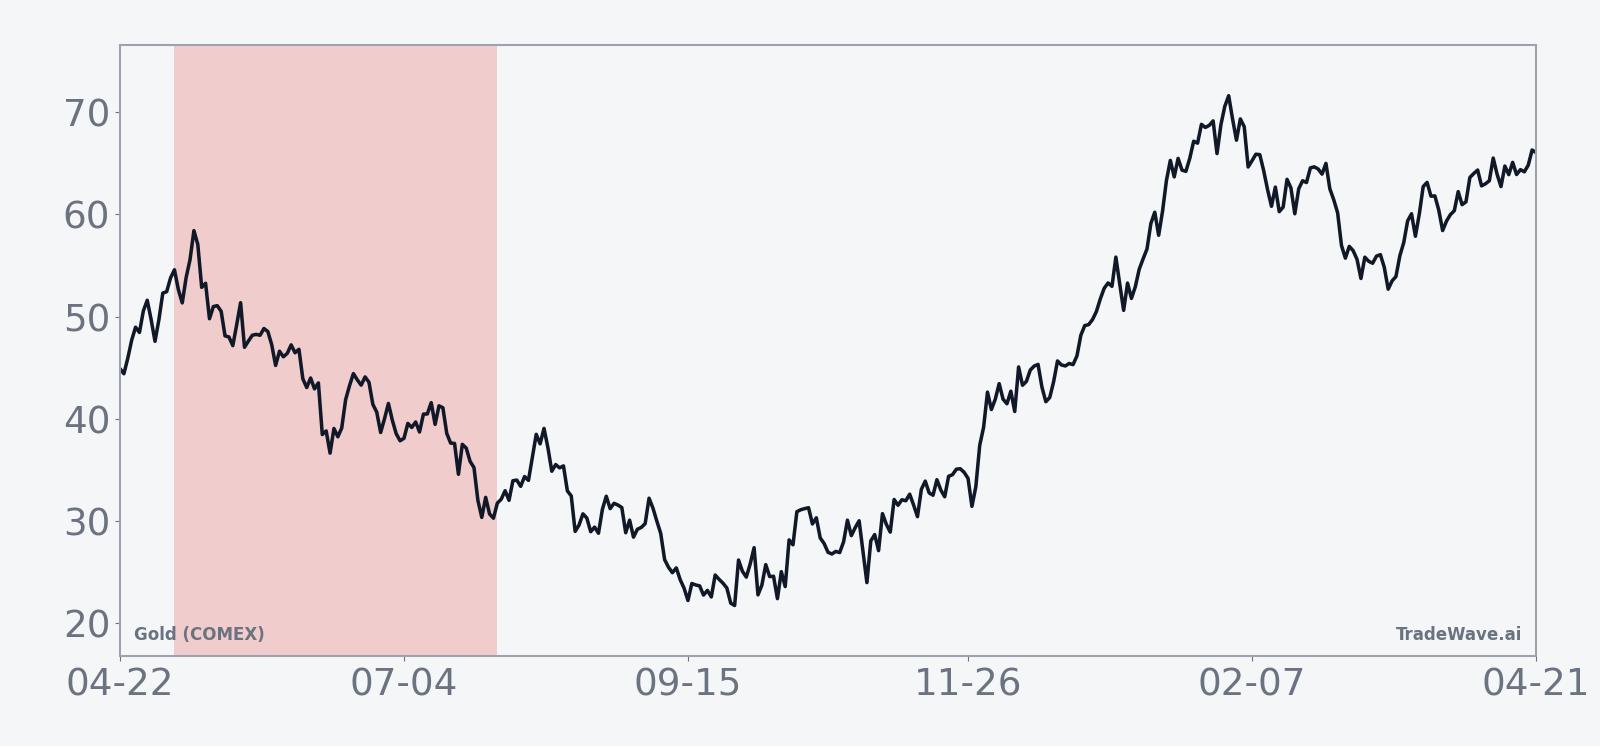
The historical seasonal average shows gold prices tending to soften fairly steadily across the window rather than collapsing in a single air pocket. For a short bias, that has meant more of a grind lower than a one-day shock, with the typical path favoring patience over quick scalps.
Year-by-year bars with maximum favorable and adverse moves show how much room gold has given both shorts and would-be dip buyers in this stretch.
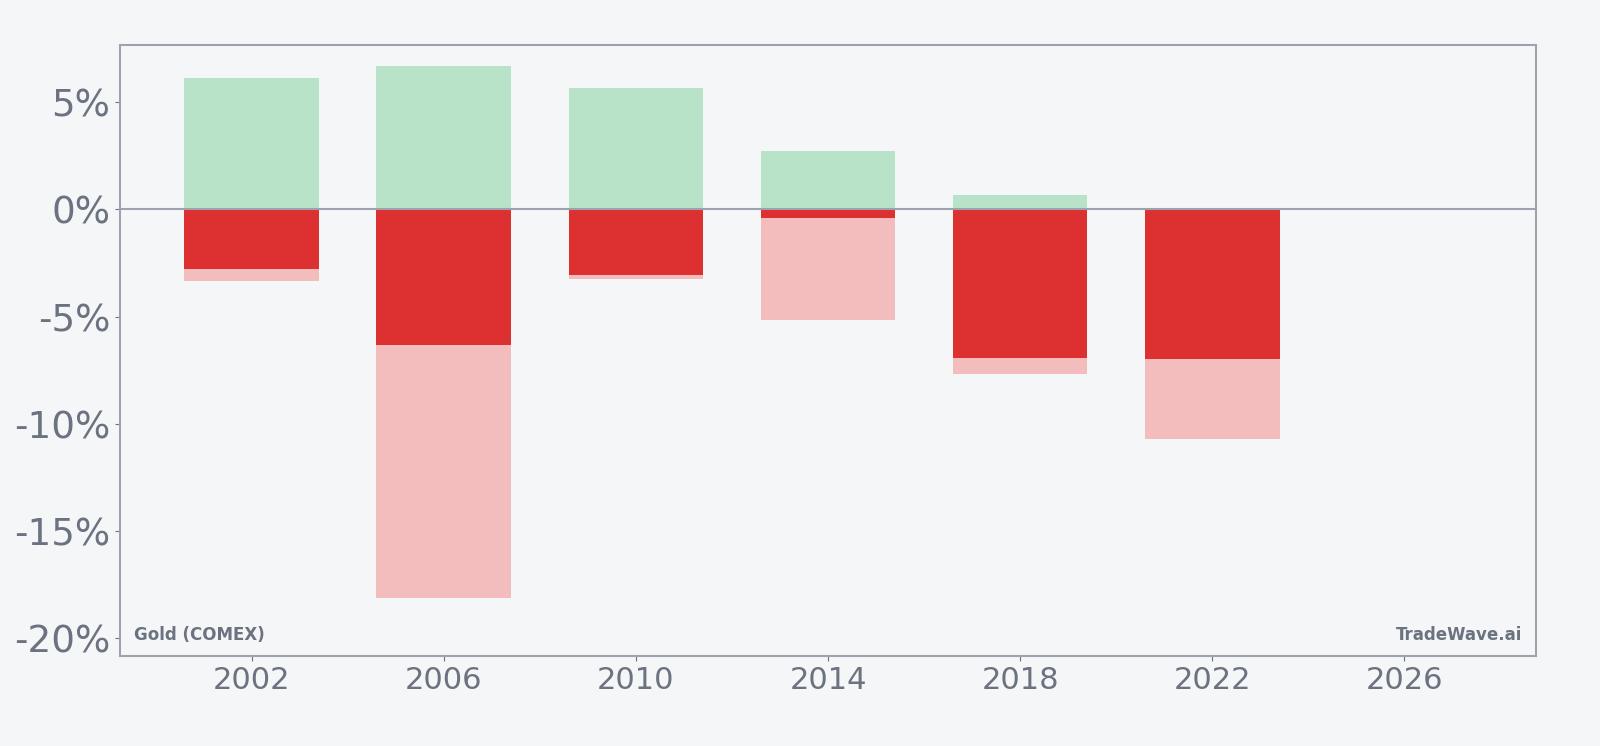
Across the six midterm years in the sample, the strongest short year was 2022, when gold fell 6.96% from entry to exit and at one point traded 10.71% against longs before the window closed. The softest outcome for shorts was 2014, when the net move was just 0.38% but intraperiod swings still saw prices rally as much as 2.71% from the entry before rolling over. Add it up: every midterm-year version of this window has delivered a net decline in gold, but the maximum adverse excursions show that rallies against the short have often been sharp enough to test conviction.
History does not guarantee future results, and even in a clean six-for-six pattern, the worst intraperiod drawdowns have been large enough to punish poorly timed entries or tight stops.
Why does Gold (COMEX) (GC) follow this seasonal pattern?
This midterm-year pattern may reflect a mix of policy and positioning dynamics. One likely driver is that midterm summers often coincide with contentious budget talks and shifting expectations for future rate paths, which can sap enthusiasm for gold after earlier safe-haven spikes. Analysts have also pointed to portfolio rebalancing and profit-taking in commodities as investors reassess risk ahead of the pre-election year, when risk assets historically see a stronger bid.
What is driving Gold (COMEX) (GC) today?
Gold (COMEX) futures finished the session at 4,733.7002, up 0.0254% on the day, trading between 4,705.7002 and 4,771.2998 on volume of 41,543 contracts. That leaves GC roughly 15.3% below its 52-week high and well above the 52-week low, with the front-month contract also sitting under its 50-day moving average around 4,888.998, a sign that the recent surge has cooled.
In January 2026, coverage of Comex gold futures highlighted prices pushing closer to the psychologically important 5,000 level as safe-haven demand picked up amid tariff worries and government shutdown fears.[1] Another Wall Street Journal piece that month described “strong bullish momentum” in gold futures, with charts pointing to higher resistance levels as volatility in broader markets pushed investors toward perceived havens.[3] In October 2025, gold’s role as a hedge was again in focus as shutdown concerns and broader commodity moves supported the metal.[4]
In February 2026, Bloomberg reported that options traders were piling into long-shot upside bets, buying large volumes of December 15,000/20,000 call spreads on Comex gold futures even after a sharp correction.[2] Those structures are far from the current futures price, but they signal that a slice of the market is willing to pay for extreme upside tails, a stance that could collide with the historically weak midterm-year summer window if prices stall or drift lower instead.
The chart below shows how the latest pullback fits into the past year’s rally, along with a short-term seasonal projection.
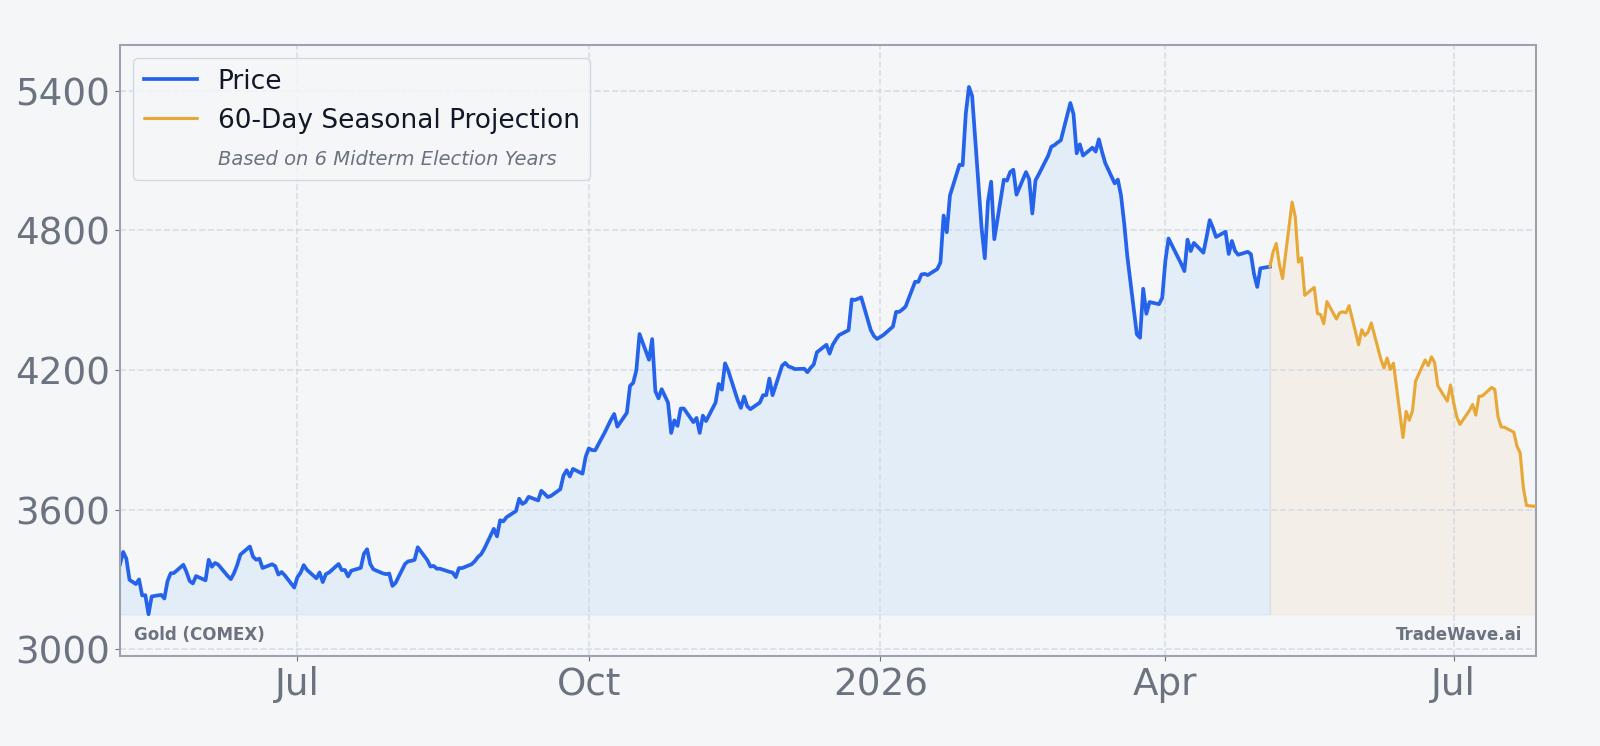
Gold (COMEX) is trading in a firm longer-term uptrend and remains a key reference point for inflation expectations and risk sentiment. Even so, the midterm-year seasonal window that opens on May 6 has repeatedly featured softer prices and sizable intraperiod swings. Because gold influences everything from mining equities to emerging-market FX, volatility in this stretch has often spilled into related assets when the pattern has played out.
What should traders watch in this midterm-year window?
First, the calendar: the 84-day window starting May 6 runs through the heart of the midterm-year policy debate, when headlines around tariffs, fiscal negotiations and shutdown risk tend to cluster. If gold rallies hard into that start date and then stalls or rolls over, it would rhyme with prior cycles where strength early in the year gave way to a choppier, softer summer.
Second, levels: on the upside, the 5,000 area that drew attention in January 2026 remains a psychological marker, while the 4,500 zone looks like a first line in the sand for bulls based on recent trading ranges.[1][3] A decisive break below that band during the window would be consistent with the historical short bias, while a sustained push back toward the 52-week high would mark a clear departure from the pattern.
Third, options and positioning: the December 15,000/20,000 call spreads flagged earlier are a barometer of speculative appetite for extreme upside.[2] If that flow keeps building even as the seasonal window historically associated with weaker prices kicks in, it would raise the risk of a positioning squeeze if gold fails to deliver the kind of breakout those structures imply. Conversely, a fade in that activity or a shift toward downside hedges would suggest traders are leaning more into the midterm-year seasonal script.
Finally, macro catalysts: watch how gold reacts to any renewed tariff headlines, budget showdowns or shifts in rate expectations. In past midterm years, stretches of policy noise have often coincided with the soft patches captured in this GC seasonal trend. If gold shrugs off those shocks and holds near the top of its range, it would be an early sign that this cycle may be breaking from the six-for-six pattern.
Sources
- The Wall Street Journal, "Gold Prices Climb Closer to $5,000 an Ounce," Jan 25, 2026.
- Bloomberg, "Gold Options Traders Boost Long-Shot Bets Even After Correction," Feb 16, 2026.
- The Wall Street Journal, "Comex Gold Futures’ Strong Bullish Momentum Still in Play, Chart Shows," Jan 26, 2026.
- The Wall Street Journal, "Silver Could Emerge as Outperformer Amid Gold Surge," Oct 6, 2025.
About this seasonal analysis
Seasonal pattern data is sourced from TradeWave.ai, which analyzes historical price behavior across annual calendar windows going back up to 30 years. Read the full data methodology or the book The 100-Year Pattern by Afshin Moshrefi (2026 edition). Past performance of seasonal patterns does not guarantee future results. This article is for informational purposes only and does not constitute investment advice.